
1. KPI trends
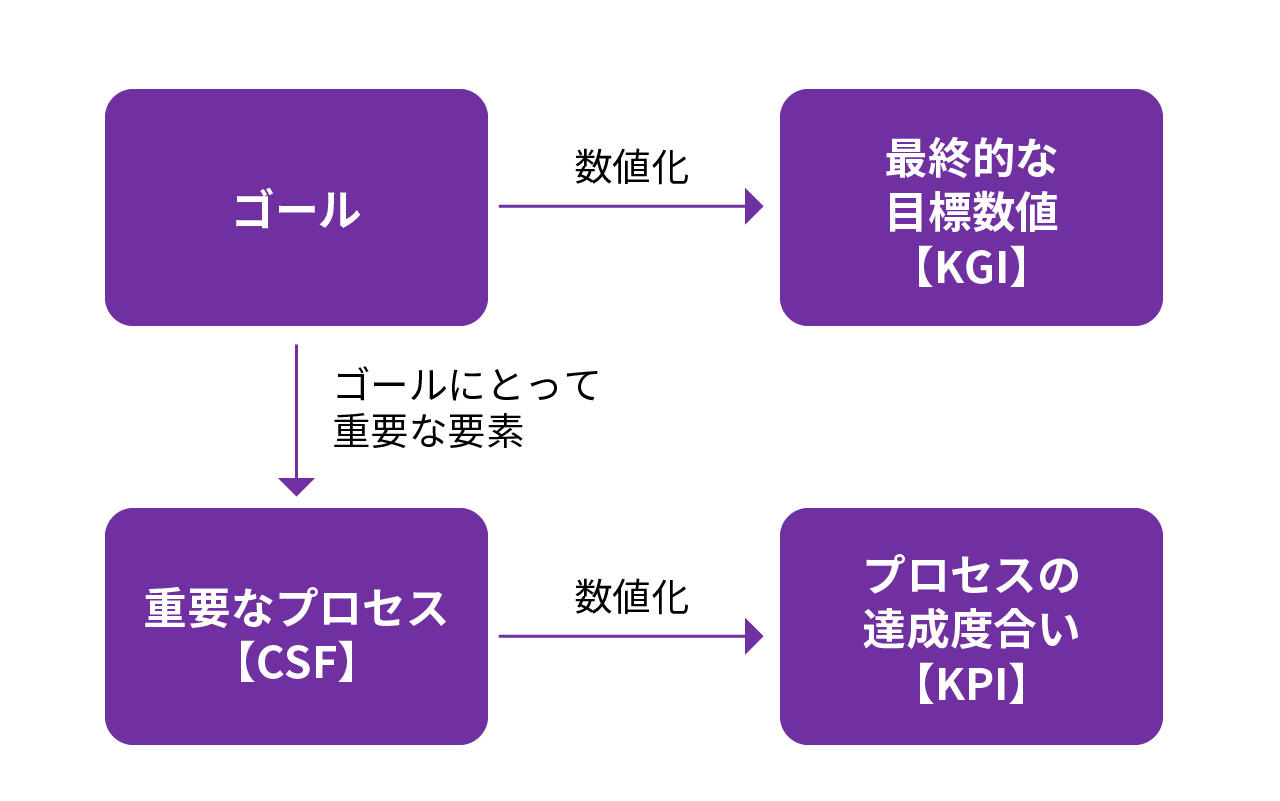
KPI (Key Performance Indicator) is a quantitative representation of the degree of achievement of important process CSF (Critical Success Factor) for the final target value (KGI). By utilizing KPI, you can manage the current situation and progress towards the goal.
KPIs have originally been adopted in a variety of industries and occupations, but in recent years, as data utilization and analysis has progressed, especially in the context of digital transformation, they are now being used in business operations that were previously difficult to quantify, and their range of application is expanding.
The reasons for adopting KPIs in such a variety of situations include the increasing complexity of business, the need for high productivity, and the diversification of team members. And there is no doubt that the need for KPIs will continue to increase in today's rapidly changing society.
2. The growing need for factory KPIs
The same is true in the manufacturing industry.
In recent years, there has been a demand for improved management using KPIs in factories. While social needs are diversifying and small-lot, high-mix production is becoming more common, securing manufacturing personnel is becoming more difficult in Japan due to a decline in the working population. Therefore, in order to continue producing a wide variety of products through various production processes, efficient management is even more necessary.
In fact, efforts to utilize data at production sites known as smart factories are increasing, and in the context of these activities, there is an increasing need to reconsider factory KPIs.
At Macnica, we have supported smart factory projects in a variety of industries and have received many enquiries about setting factory target indicators, or KPIs.
3. The reality of factory KPIs: There are many and they are all over the place
So, what is the general state of factory KPIs?
What I felt through the various projects I was consulted on was,
"There are a lot of KPIs"
"Varies depending on the process"
That is what it means.
For example, in processing processes where it is important that the machine is operating, the operating rate, total downtime, and number of minor stops per hour are used, while in assembly processes where yield is important, the rate of non-defective products, first-pass rate, and number of defective products are emphasized. Furthermore, in addition to the type of process, for products with high manufacturing costs, the yield and waste quantity / value are also managed. All of these indicators are recorded on-site, and the results are managed in a list.
This means,
"So, is the current situation good or bad?"
Which process is not better?
Isn't it true that in many cases people don't even understand something as simple as this?
The reason why we have fallen into this situation is that, up until now, when a wide variety of products have been produced through a variety of production processes, leaders such as site managers and team leaders have tried to manage each process responsibly. This in itself is a wonderful thing, and we need to continue to promote it in the future.
However, in today's rapidly changing world, there is a need for indicators that are not affected by differences in products or production processes, and that can determine relative quality across departments.
4. Factory KPI setting and ideal operation
So, how should factory KPIs be set and operated specifically?
It is generally said that the key to setting KPIs is to be "SMART."
What is "SMART"?
"S"Specific
"M"Measurable
"A"Achievable
"R" stands for Relevant
"T" stands for Time-bound
refers to...
Here, we would like to focus on the things you should keep in mind when considering factory KPIs.
Comprehensive index incorporating management indicators
First of all, what is important is that the KPIs for the production site incorporate and combine all of the management indicators that were previously separate for each process as mentioned above.
For example, in the example of [Figure: Overall indicators and management indicators], "line production efficiency" is set as the overall indicator of the factory KPI. This line production efficiency includes management indicators such as "number of minor stops" and "number of NGs" that were considered for each process as elements.
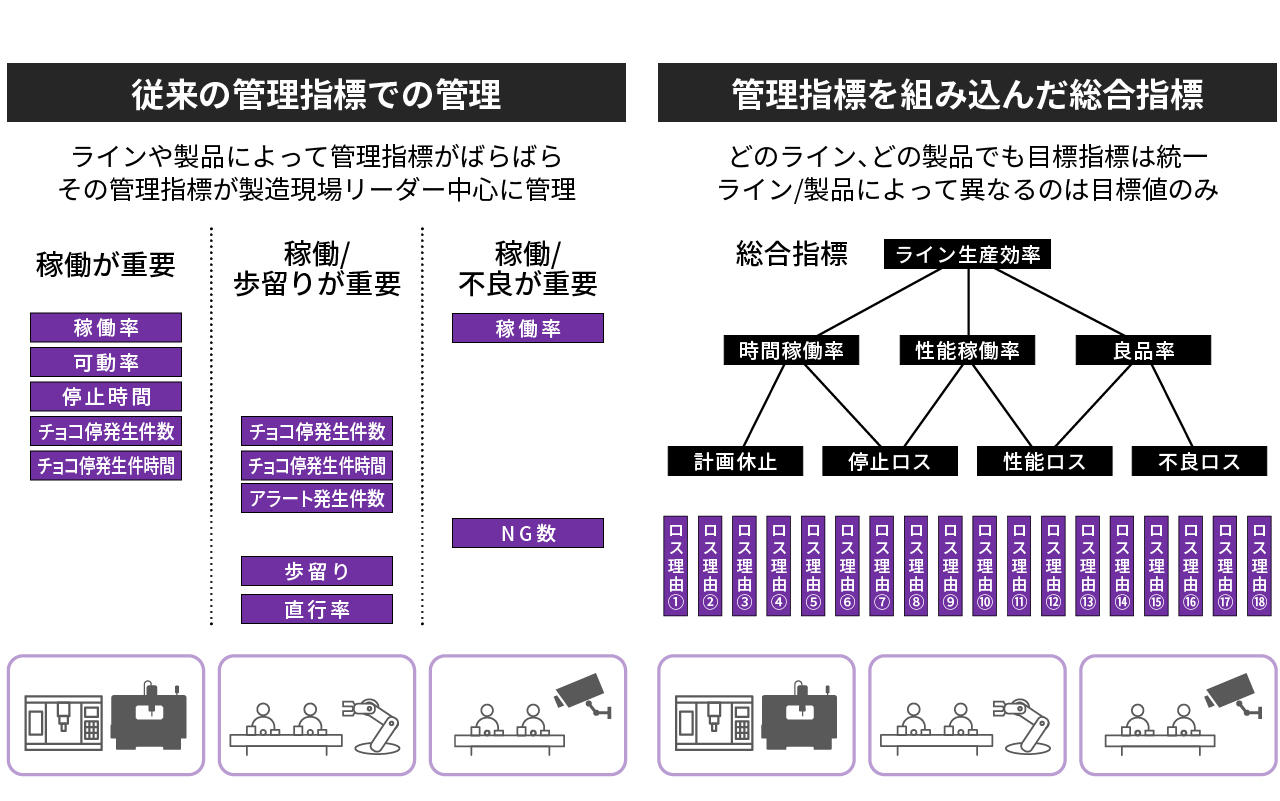
Figure: Comprehensive indicators and management indicators
This allows for prioritization through relative comparisons using line production efficiency as a KPI. In addition, because there are control indicators as factors that cause fluctuations in the KPI, it is possible to grasp larger trends with the KPI while managing more detailed aspects at the control indicator level.
Linkage with factory management KGI
Secondly, it can be understood in conjunction with the factory management KGI. Specifically, when trying to improve the KPIs of the production site, if improvement activities are carried out to improve production efficiency (KPI), if it is possible to clearly evaluate how much the activities contributed to improving productivity (KGI), the departments involved in production can work together to promote the activities.
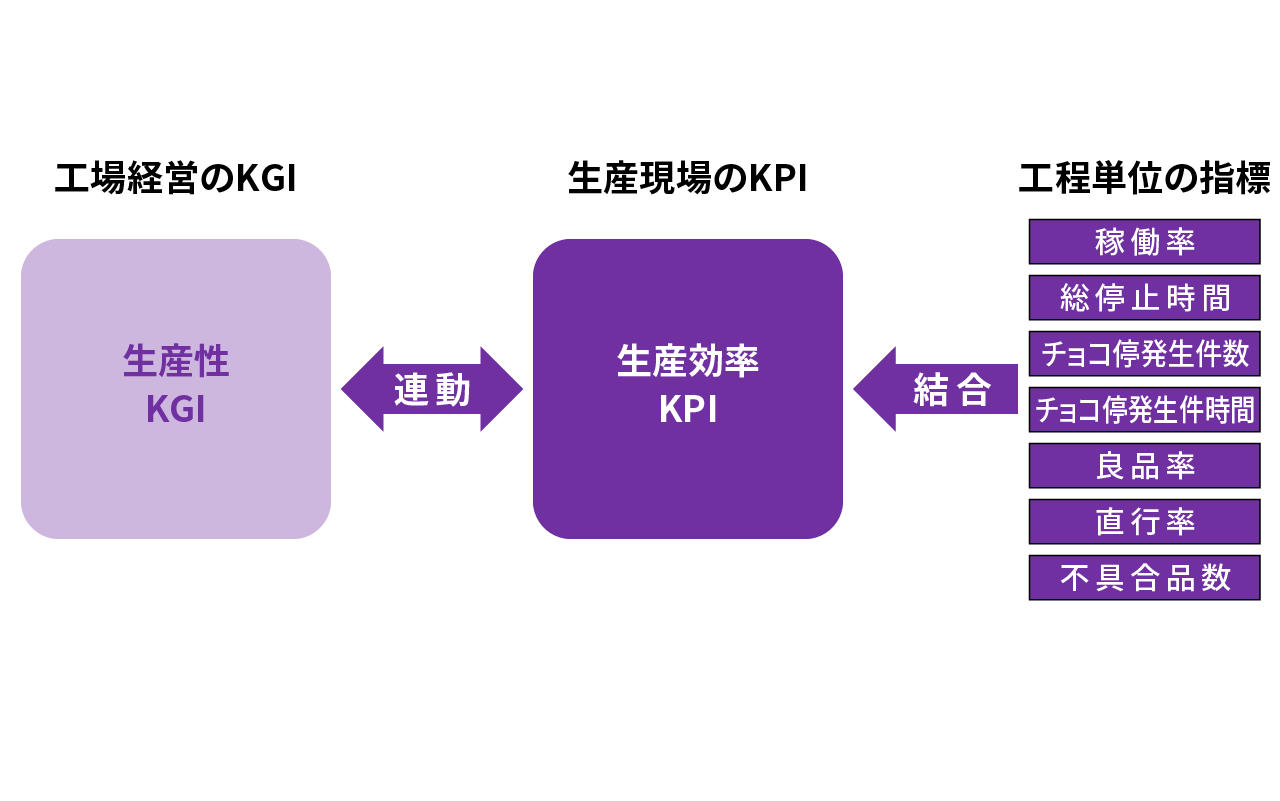
Figure: It is important that the KPIs of the production site are linked to the process indicators and are also linked to the factory management KGIs.
Similar products and processes can be compared relative to each other's KPIs and performance values to prioritize improvements.
However, some may wonder, "Doesn't this mean that it is not possible to be aware of differences in the products and processes?"
The differences in the products and processes can be managed by setting deviations and target values. For completely different products and processes, you can determine priorities by focusing on the degree of deviation in the actual values, or the size of the difference between the target values and the actual values.
5. [Example] Factory KPIs based on company policy
From here, I will introduce some actual examples of when we supported the use of factory KPIs.
When considering factory KPIs, the important thing is not to simply ask "What kind of indicators should we use?" but to think "What situation is our company in and what should our factory be like?"
All companies are conducting business activities in a changing environment. Examples of environmental changes include social and market changes such as a declining birthrate and aging population, market and customer changes such as diversifying needs, and changes in competition such as an increase in new entrants. In light of these environmental changes, there are certain conditions that companies should aim for, such as not losing market share to other companies under any circumstances in industries where the market continues to expand and competition is fierce, and in cases where products essential to society such as medical and defense products are manufactured, stable supply must be achieved under any circumstances. Given these conditions, what should a factory be like? It is important to consider what KPIs it should have.
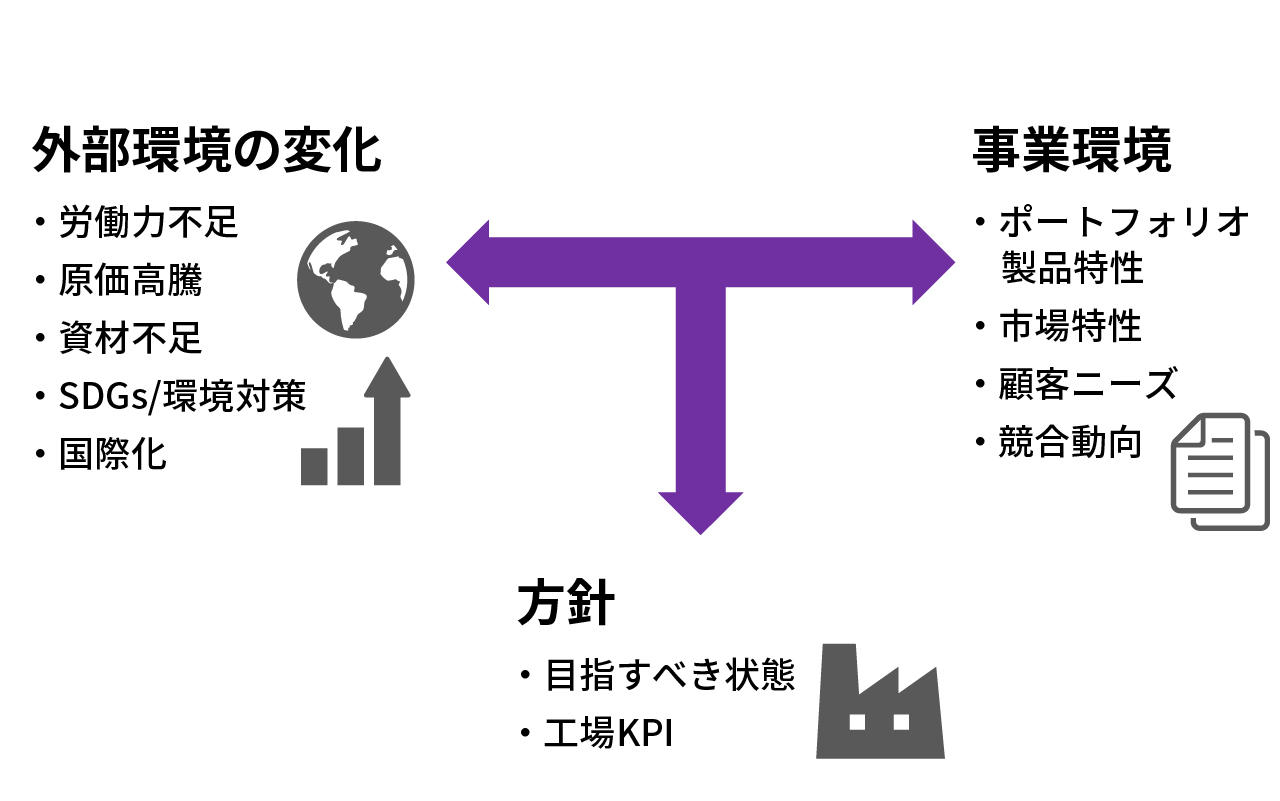
Figure: Setting KPIs based on the desired state
6. [Example] Frequently used factory KPIs
Here is an example of a factory where KPIs were considered based on the desired vision.
This is a simpler version of a common example, but it shows a situation where production is becoming more diverse and in small quantities while the number of people working in manufacturing is decreasing, making it necessary to manufacture a wide variety of products with limited staff.In this case, the factory as a whole aims to maximize productivity by aiming for maximum output with minimal input, and the manufacturing KPI is to increase production efficiency with as little loss as possible on each line.
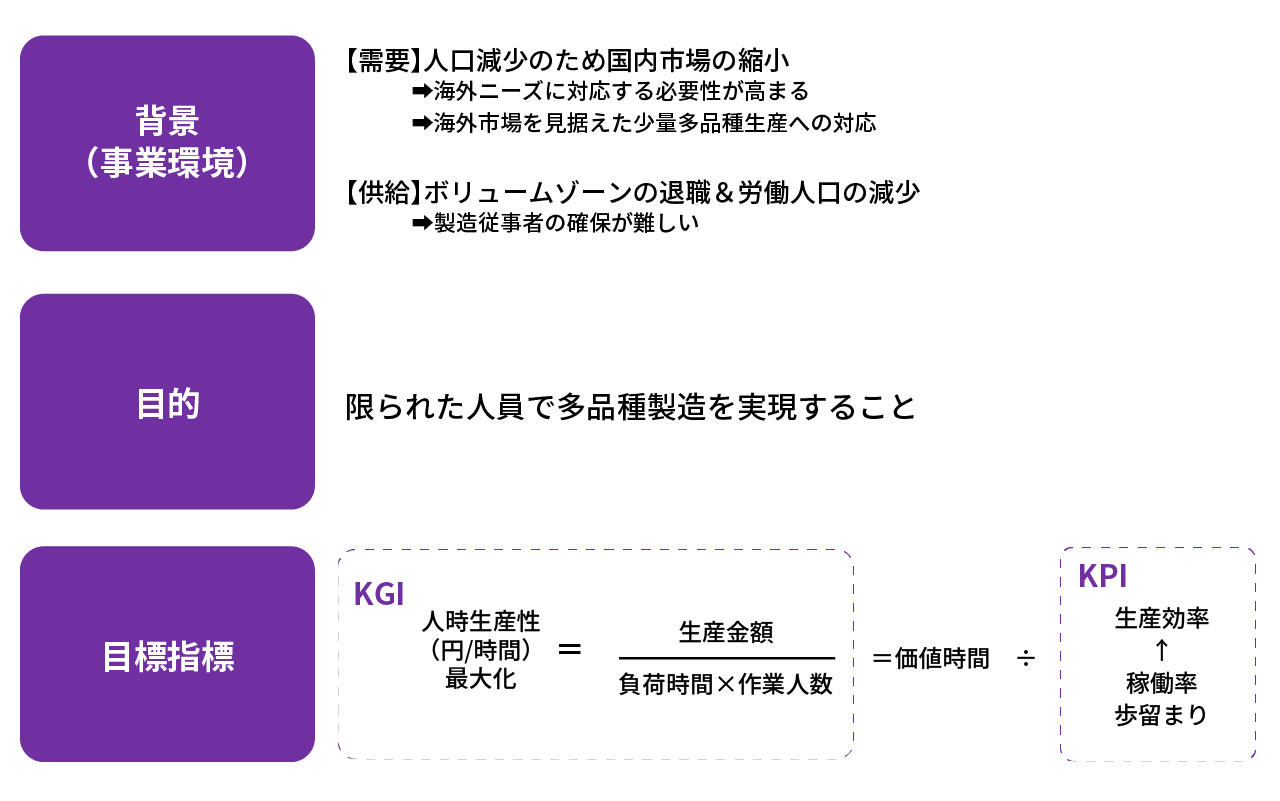
Figure: Example of factory KPI consideration
At Macnica, we have supported manufacturing clients in a variety of industries and processes, and we have noticed that, particularly in Japan, there is an unavoidable barrier in the form of a declining working population, so the factory KPIs for all of our clients tend to be similar.
7. Conclusion
As smart factory initiatives progress, factory KPIs are receiving increasing attention.
We hope that this article will inspire you to promote the use of KPIs in the manufacturing process and aim to create a better factory that contributes to improving overall management through common indicators.
"DSF Cyclone" connects manufacturing results and production plans with structured data to realize "highly productive factories." If you are interested, please also refer to this page.

Related article
What is the role of the production department in the smart factory promotion project?
What is the role of the information system department in the smart factory promotion project?

Reasons why DX in the manufacturing industry is not progressing ~Characteristics and specific examples of organizations where smart factories succeed~
Sophistication of improvement activities at production sites and future DX ~Things to be aware of when using digital technology~