product
- Why choose Splunk
- Installation record
- price
- Splunk Enterprise Security
- Splunk Phantom (SOAR)
- Splunk ITSI (Next Generation IT Operations)
- Splunk Observability Cloud
- Splunk UBA
- Macnica CSIRT App Basic
- App for Splunk for Financial Institutions
- Splunk Analytics for Hadoop
- About Apps
- Splunk Edge Hub
- What is Splunk
service
- Dashboard/SPL Creation Pack [Implementation/Building Support]
- Version upgrade service [implementation and construction support]
- Smart Security Monitoring App [Original App/Service]
- Splunk × LANSCOPE Original App [Original App/Service]
- Security Monitoring App for Box [Original App/Service]
- Cloud Security Monitoring App [Original App/Service]
Specifications/Technical Information
Application for evaluation machine
- FAQ
Splunk
Splunk
Data analysis using Splunk 1: Overview of Machine Learning Toolkit (MLTK)

Introduction
In recent years, data analysis using machine learning has attracted attention. Machine learning derives models such as generalized rules and patterns from collected data, and uses those models to make predictions and classifications on real data.
This article provides an overview of the Splunk Machine Learning Toolkit (MLTK), a free app needed to perform machine learning on data collected with Splunk, and what the actual UI looks like.
table of contents
Overview of MLTK
Splunk Machine Learning Toolkit (MLTK) is an app that supports the creation and execution of machine learning models using data collected on the Splunk platform. You can use it by installing it into Splunk from Splunkbase (https://splunkbase.splunk.com/app/2890). The algorithms provided in MLTK make it easy to create machine learning models, and provide future prediction/anomaly detection implementation and customized visualization methods in areas such as IT, security, business, and IoT.
What can be achieved with MLTK
Utilize MLTK to achieve the following:
- Improved security
Dataset: FW traffic
Determine if specific traffic is caused by malware. - Forecasting the number of purchases
Dataset: Sales performance
Predict the number of products sold by a certain shop each month. - Equipment deterioration prediction
Dataset: Sensor data
Predict the time until deterioration that deviates from the normal range from sensor waveform data.
In addition, the machine learning methods that can be used with MLTK to achieve the data analysis described above can be roughly divided into the following five types.
- Regression: Analysis that predicts numerical values using multiple factors
- Classification: Analysis that uses multiple factors to predict categories of data
- Time series prediction: Analysis that predicts numerical values from time series data
- Clustering: Analysis that groups data using multiple factors
- Anomaly detection: Analysis that calculates expected values from data and detects outliers in actual data.
In addition, by installing MLTK, the following visualization becomes possible. (Image 2-1, 2-2)
3D scatter plot
boxplot
Distribution map
Downsampled line chart
prediction chart
heatmap plot
histogram chart
outlier chart
Scatter plot
scatterplot matrix
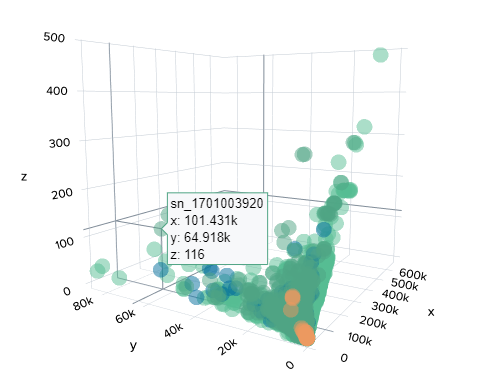
Image 2-1. 3D scatter plot
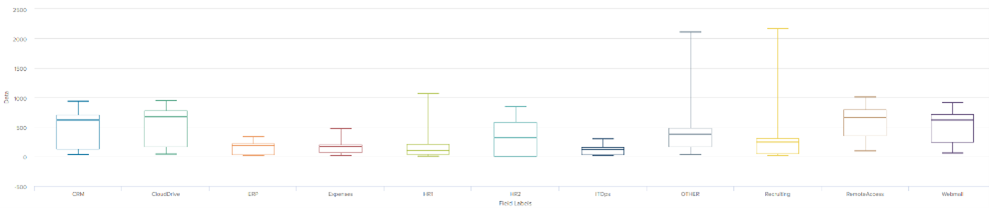
Image 2-2. Boxplot
MLTK UI and navigation bar
The UI and navigation bar when opening MLTK from Splunk's UI is shown below (Image 3-1). The red frame is the navigation bar.
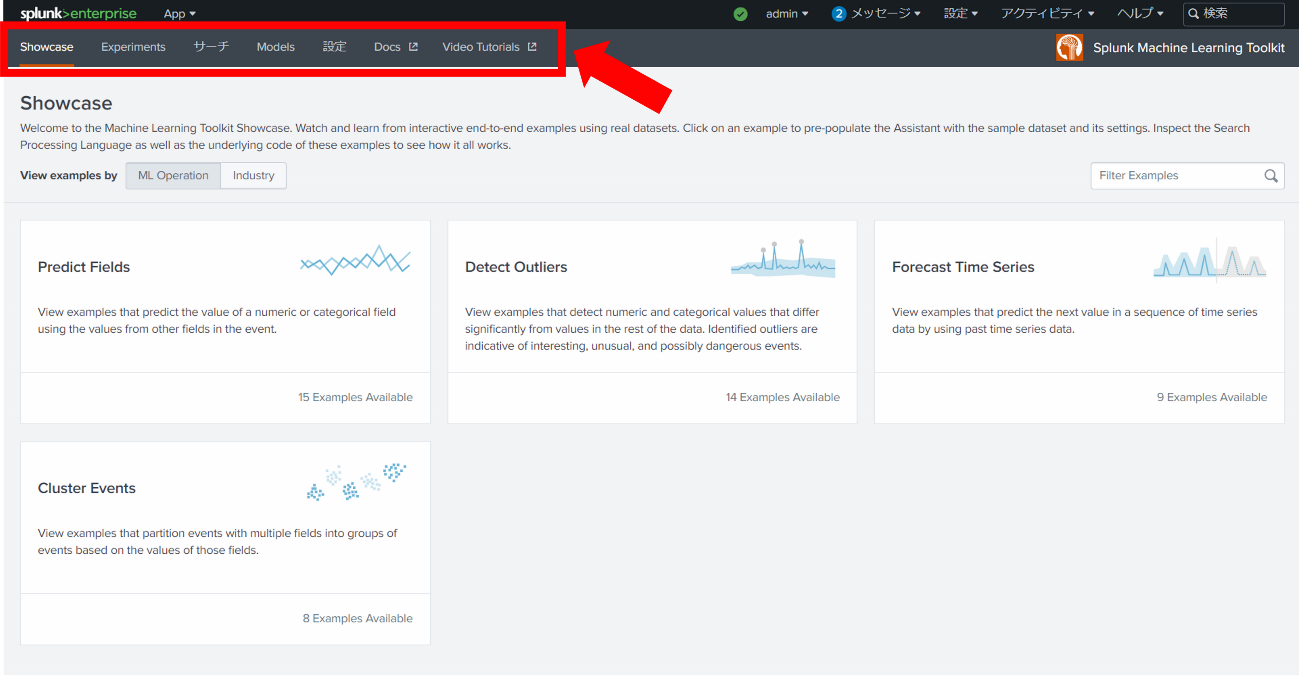
Image 3-1. MLTK UI and navigation bar
Each navigation bar and its overview are as follows.
| Showcase | Input the sample dataset included with MLTK for the selected machine learning method and create an example machine learning model. |
| Experiments | Create a model based on your data |
| search | Data search and apply machine learning models to the retrieved data |
| Models | Display a list of created machine learning models |
| setting | Tuning the parameters of machine learning algorithms provided by MLTK |
| Docs | Check the MLTK documentation |
| Video Tutorial | Watch the video to learn how to use MLTK |
As an example, I will show you the UI for Showcase, Experiments, Models, and Settings.
Showcase
You can check analysis examples for the following four analysis items. (Image 3-2)
| Predict Fields | Prediction and classification of values |
| Detect Outliers |
Outlier detection |
| Forecast Time Series | Prediction of time series data |
| Cluster Events | Clustering of events |
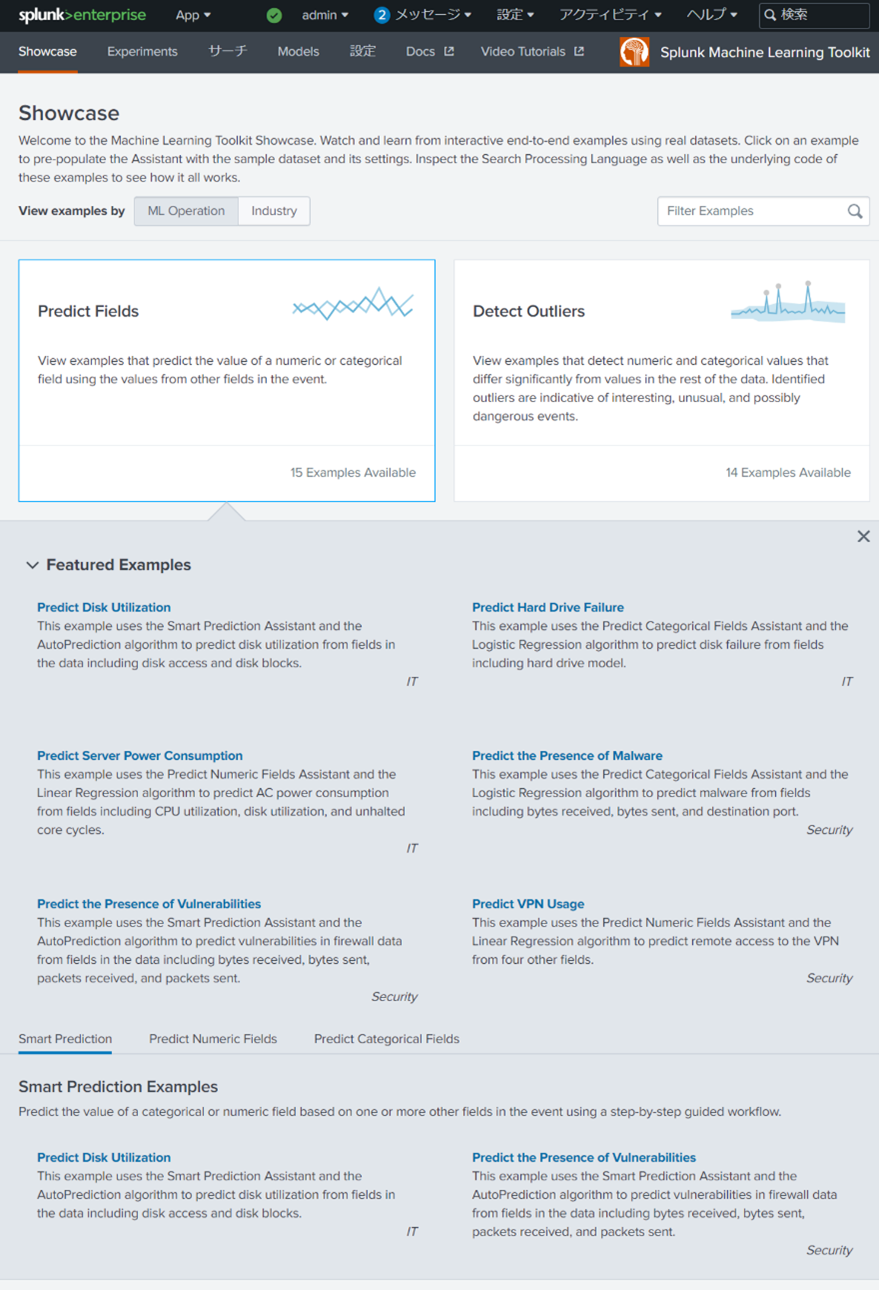
Image 3-2. Showcase
Experiments
You can create machine learning models using the analysis assist function included with MLTK.
(Image 3-3)
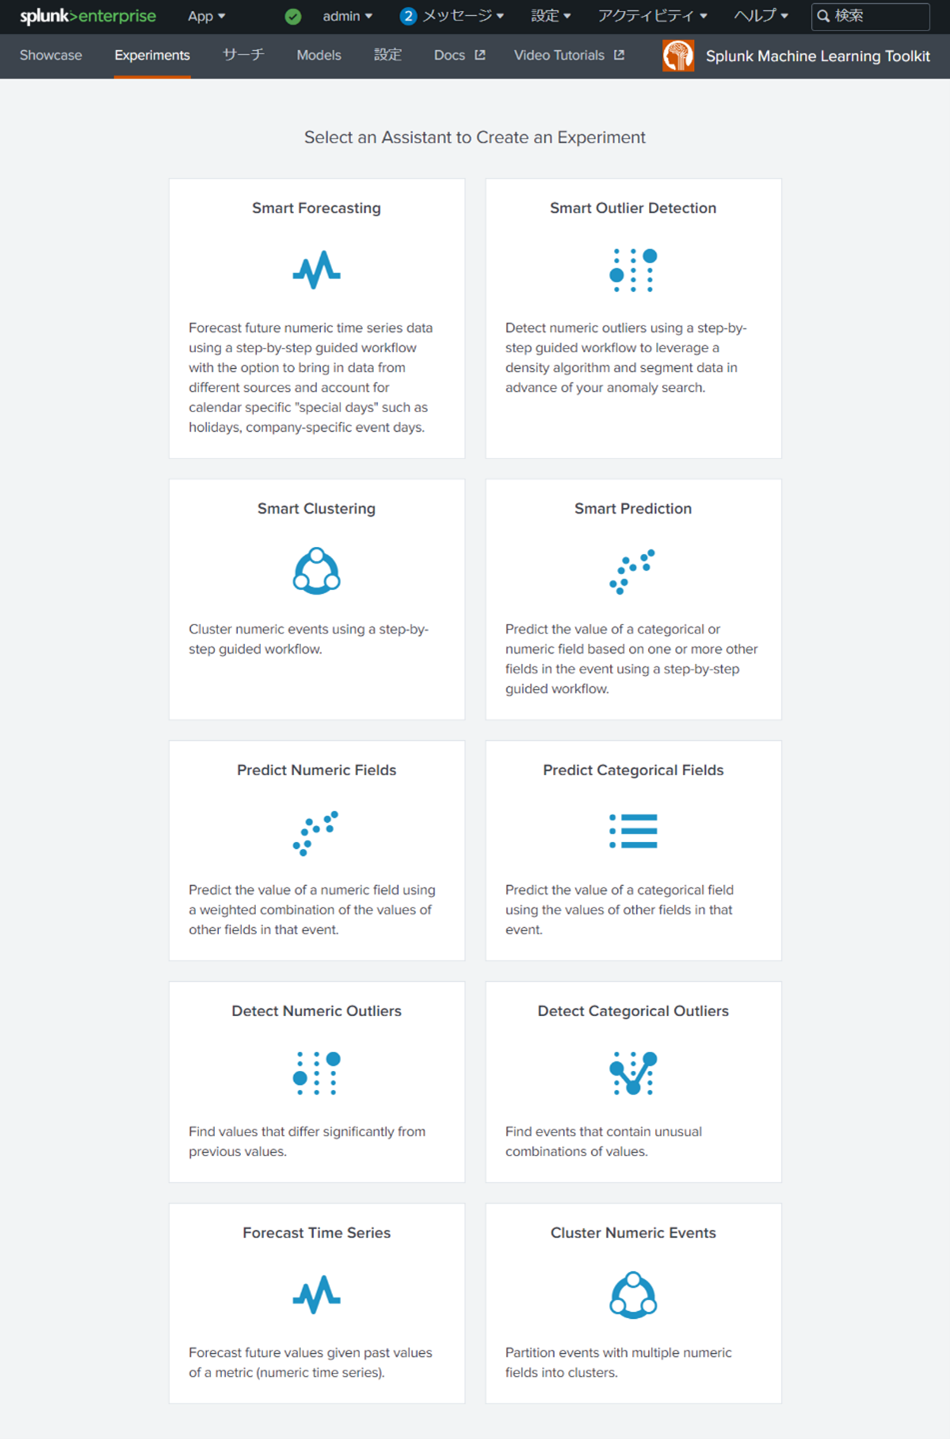
Image 3-3. Experiments
Models
You can check the models created with MLTK. You can also upload machine learning models in ONNX format here. (Image 3-4)
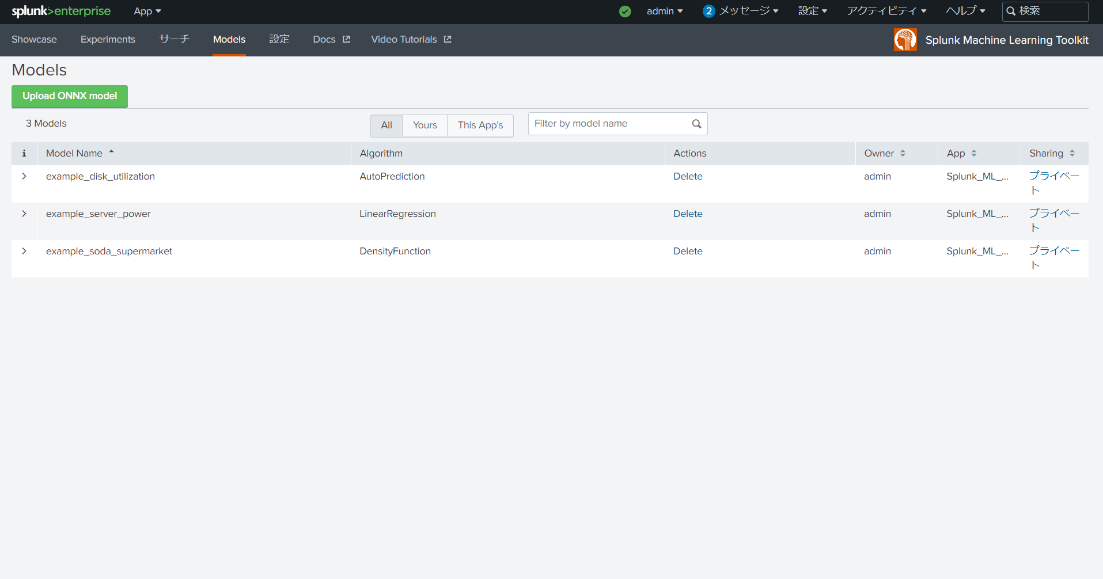
Image 3-4. Models
setting
You can select each algorithm and check and tune the parameters. (Image 3-5, 3-6)
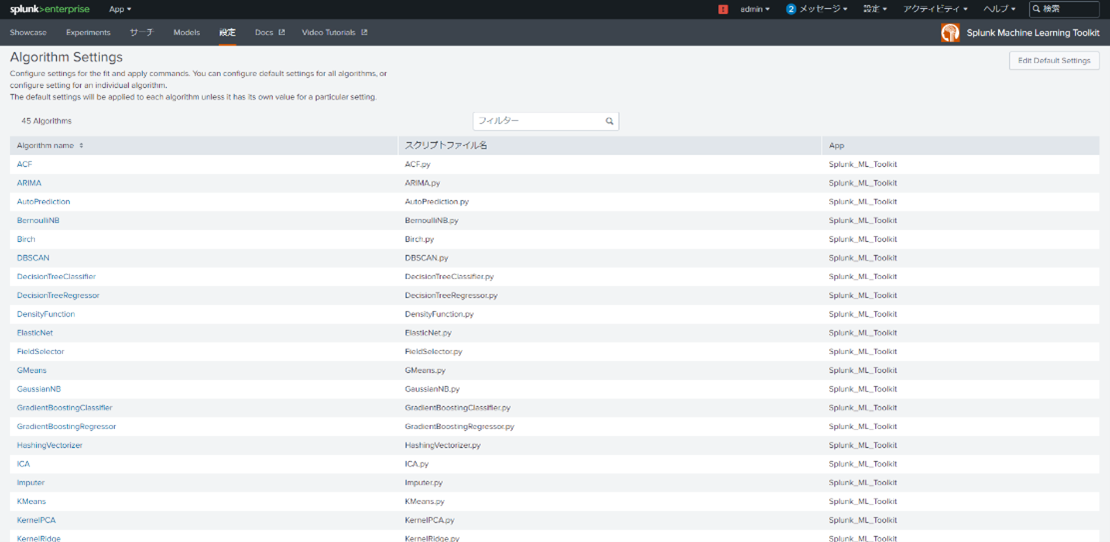
Image 3-5. Setting list
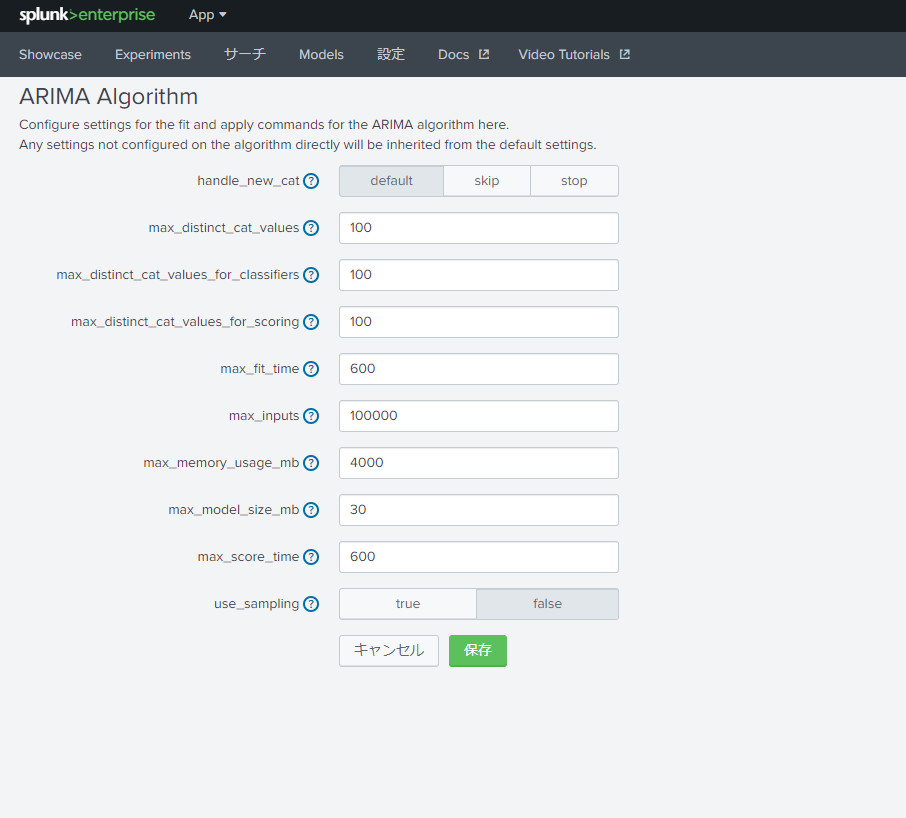
Image 3-6 Tuning algorithm parameters
Reference information
- splunkbase
https://splunkbase.splunk.com/app/2890 - About the Splunk Machine Learning Toolkit
https://docs.splunk.com/Documentation/MLApp/5.4.1/User/AboutMLTK
If you have any questions regarding this matter, please feel free to contact us.
Inquiry/Document request
In charge of Macnica Splunk Co., Ltd.
- TEL:045-476-2010
- E-mail:splunk-sales@macnica.co.jp
Weekdays: 9:00-17:00