product
- Why choose Splunk
- Installation record
- price
- Splunk Enterprise Security
- Splunk Phantom (SOAR)
- Splunk ITSI (Next Generation IT Operations)
- Splunk Observability Cloud
- Splunk UBA
- Macnica CSIRT App Basic
- App for Splunk for Financial Institutions
- Splunk Analytics for Hadoop
- About Apps
- Splunk Edge Hub
- What is Splunk
service
- Dashboard/SPL Creation Pack [Implementation/Building Support]
- Version upgrade service [implementation and construction support]
- Smart Security Monitoring App [Original App/Service]
- Splunk × LANSCOPE Original App [Original App/Service]
- Security Monitoring App for Box [Original App/Service]
- Cloud Security Monitoring App [Original App/Service]
Specifications/Technical Information
Application for evaluation machine
- FAQ
Splunk
Splunk
What is Observability? A new way of thinking about IT operations that you should know

Introduction
Recently, as systems are migrating to the cloud, the word "observability" is becoming more common. Observability is a word that combines Observe and Ability and is often used in the context of improving the performance of distributed IT systems. In Japanese, it is translated as "observability" and is attracting attention as a new concept in operations.
In this article, we will explain Observability with differences from conventional monitoring.
table of contents
What is Observability?
Observability refers to "a mechanism for grasping the state at any time in any IT system/service configured with any architecture".
As the use of clouds and containers progresses, the system becomes more complex, and it becomes difficult to understand the entire system with just a single log or metric. Therefore, by understanding the behavior and internal state of the system in accordance with the concept of observability, it is possible to identify abnormal behavior of the system and quickly deal with it, such as debugging and failure recovery. Observability is also useful for system design and improvement, and by understanding system performance and bottlenecks, it is possible to take measures for improvement.
In the "Cloud Native Trail Map" *1, which depicts the recommended process for utilizing open source and cloud native technologies, Observability is listed as the 4th step out of 10 steps. In particular, for DevOps engineers, SREs, IT service personnel, cloud promotion and development infrastructure managers, observability is one of the issues that should be addressed along with container utilization and automation in cloud promotion.
※1 Cloud Native Trail Map, CNCF(Cloud Native Computing Foundation)
Background for Observability
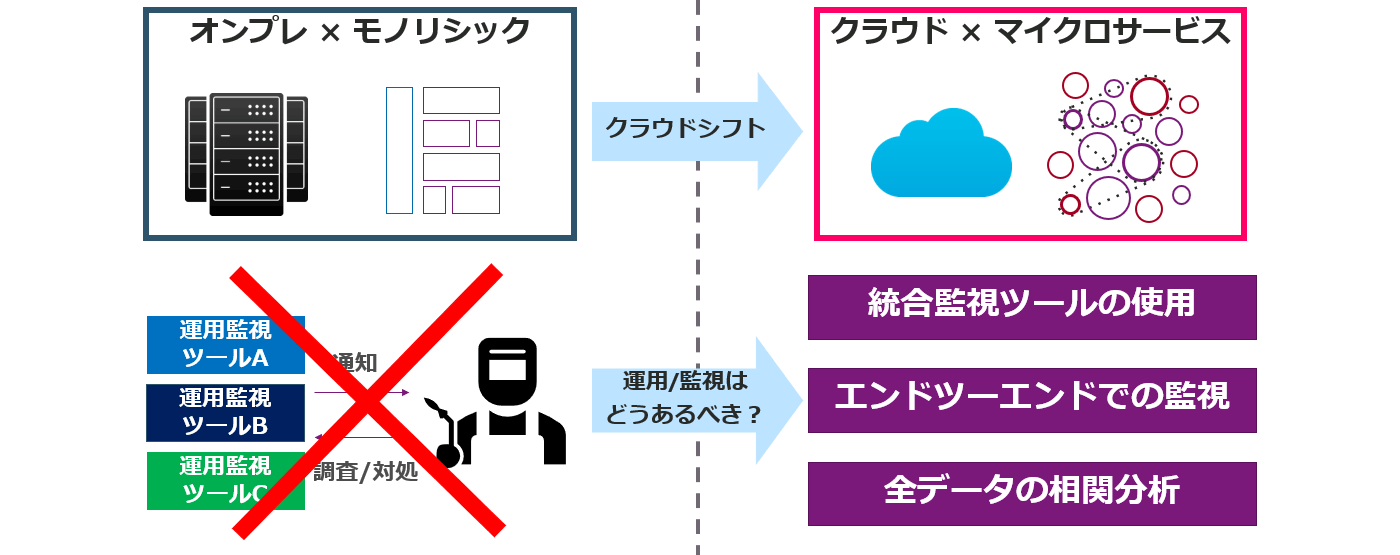
Behind the appearance of Observability technology is the existence of Microservices architecture unique to cloud-native technology, which has emerged as a new IT service infrastructure.
Due to the increasing size and sophistication of IT services, there is a demand for further efficiency in the development cycle, and Microservices architectures (such as cloud technology) that can flexibly change the components are beginning to be used instead of conventional monolithic architectures. By utilizing these technologies, it is possible to concentrate on development without worrying about infrastructure resources, and to increase the speed of the development cycle to various levels. progressing.
However, in a dynamic Microservices architecture, the configuration elements are very complex and change automatically, so the architecture is logically abstracted, so conventional single logs and metric monitoring cannot grasp the system status. is not possible.
Therefore, the observability mechanism that enables monitoring even in a dynamic environment is attracting attention as one of the very important technologies among cloud-native technologies.
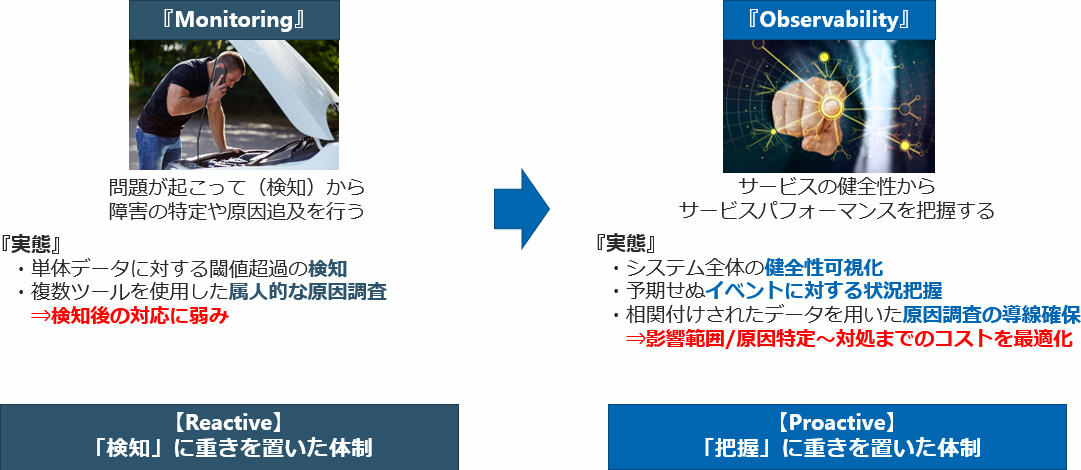
Difference from monitoring
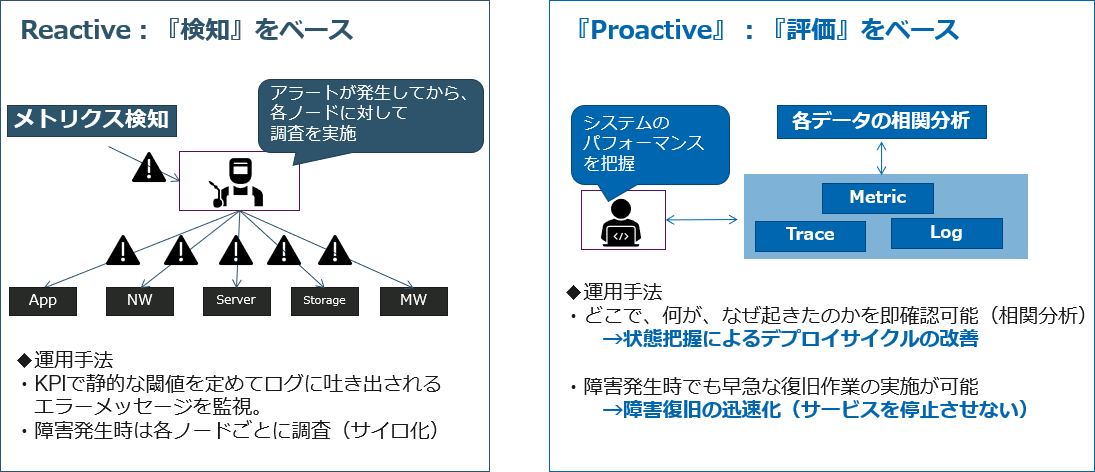
If conventional "monitoring" is a reactive response that investigates the system with an alert as a kick, Observability is a proactive response that grasps the internal situation from the health of the system. However, not all Observability is effective, and it is necessary to understand the differences between the two and the background required.
About the difference between Reactive and Proactive
How to realize the mechanism of Observability?
In order to realize this mechanism, the basic idea is to correlate and analyze the three data of "metrics", "traces" and "logs" instead of single metrics monitoring.
- metrics
A metric is a means of providing numerical data for measuring system performance. Metrics include CPU usage, memory usage, network traffic, and more. Metrics provide a quantitative understanding of system performance. - trace
Tracing is used to track the path and time of a particular transaction within the system. Tracing can follow the flow of transactions across multiple systems and provides important information for identifying system problems. Tracing is useful for debugging distributed systems and for disaster recovery. - log
Logs are a means of recording events and errors that occur within the system. Logs provide important information for understanding the behavior and internal state of the system. Logs include timestamps, log types, detailed information, and more.
Using these three types of data, the status of IT systems/services can be understood as follows.
- Metrics (numerical data on system performance such as usage and traffic)
→ Detect events from numerical data thresholds - Tracing (data that allows you to track the path and time of a transaction)
→ Identify/address problems by tracing the flow of events - Logs (data that records events and errors)
→ Investigation of root cause from actual history
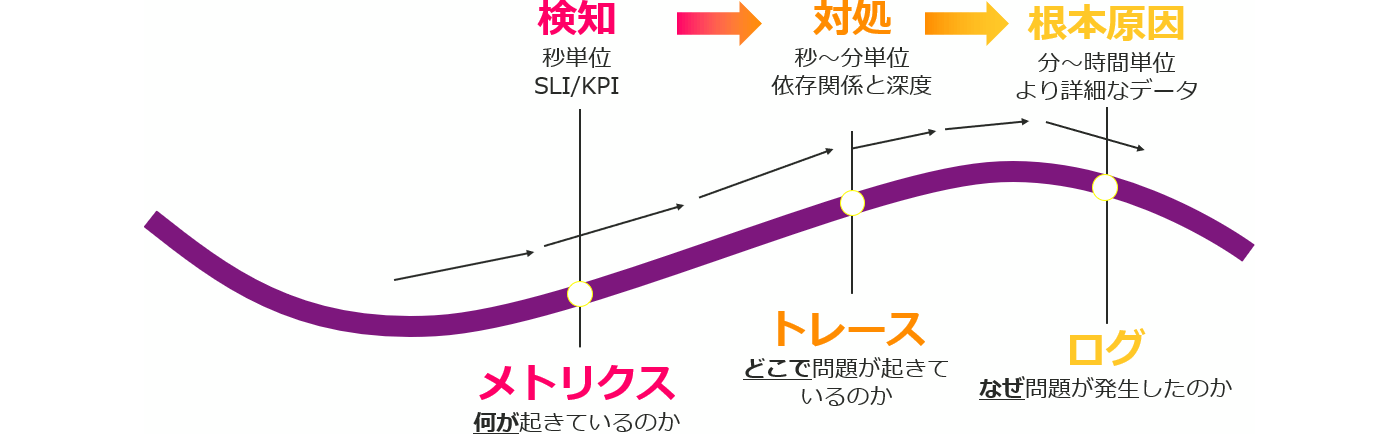
Correlation analysis of each point makes it possible to extract information through detection, countermeasures, and investigation of the root cause of any event, leading to stable system operation.
In addition, from the perspective of users who use IT services, "convenience and comfort" are required, and the demand for service levels is increasing. In order to continue to maintain IT services that satisfy customers at a high level, it is necessary not only to visualize and detect single logs, but also to understand events in detail and respond quickly to incidents. It can be said that it is a mechanism that is indispensable and will become commonplace in order to realize both the sophistication of the development environment (cloud promotion) and the improvement of the service level.
We hope that you will understand the overview of Observability and find the optimal operation method.
Macnica
Sales & Marketing
Ryo Ando
Since 2021, he has specialized in fields related to IT Operation/Cloud Solution, engaging in customer project support, marketing activities, and enlightenment activities related to the efficiency and sophistication of system operation associated with DX.
Inquiry/Document request
In charge of Macnica Splunk Co., Ltd.
- TEL:045-476-2010
- E-mail:splunk-sales@macnica.co.jp
Weekdays: 9:00-17:00