product
- Why choose Splunk
- Installation record
- price
- Splunk Enterprise Security
- Splunk Phantom (SOAR)
- Splunk ITSI (Next Generation IT Operations)
- Splunk Observability Cloud
- Splunk UBA
- Macnica CSIRT App Basic
- App for Splunk for Financial Institutions
- Splunk Analytics for Hadoop
- About Apps
- Splunk Edge Hub
- What is Splunk
service
- Dashboard/SPL Creation Pack [Implementation/Building Support]
- Version upgrade service [implementation and construction support]
- Smart Security Monitoring App [Original App/Service]
- Splunk × LANSCOPE Original App [Original App/Service]
- Security Monitoring App for Box [Original App/Service]
- Cloud Security Monitoring App [Original App/Service]
Specifications/Technical Information
Application for evaluation machine
- FAQ
Splunk
Splunk
- The Deployment Server UI has been changed to make it easier to manage your clients!
- Dashboard Studio now enables more intuitive data visualization!
Main additional functions
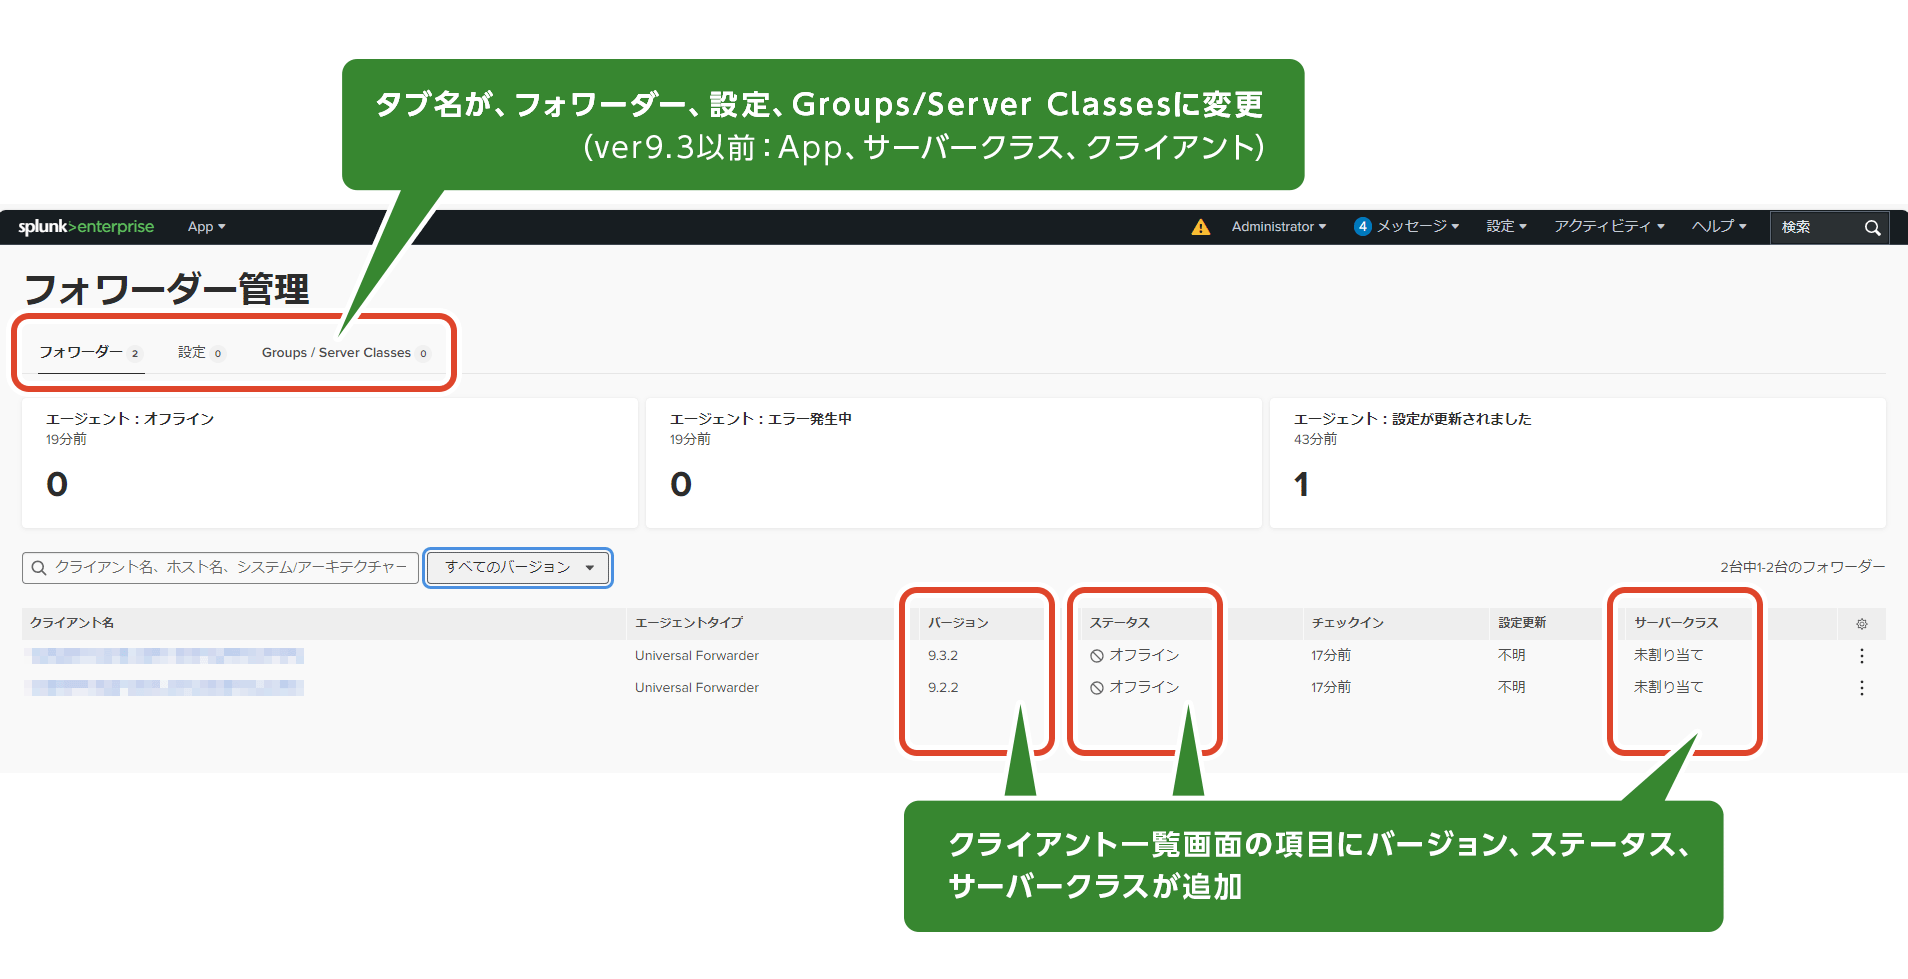
Partial changes to the deployment server UI
The following UI specifications for the "Forwarder Management" function have been changed:
- Checking the health of communication with clients
- Filter the client list by version
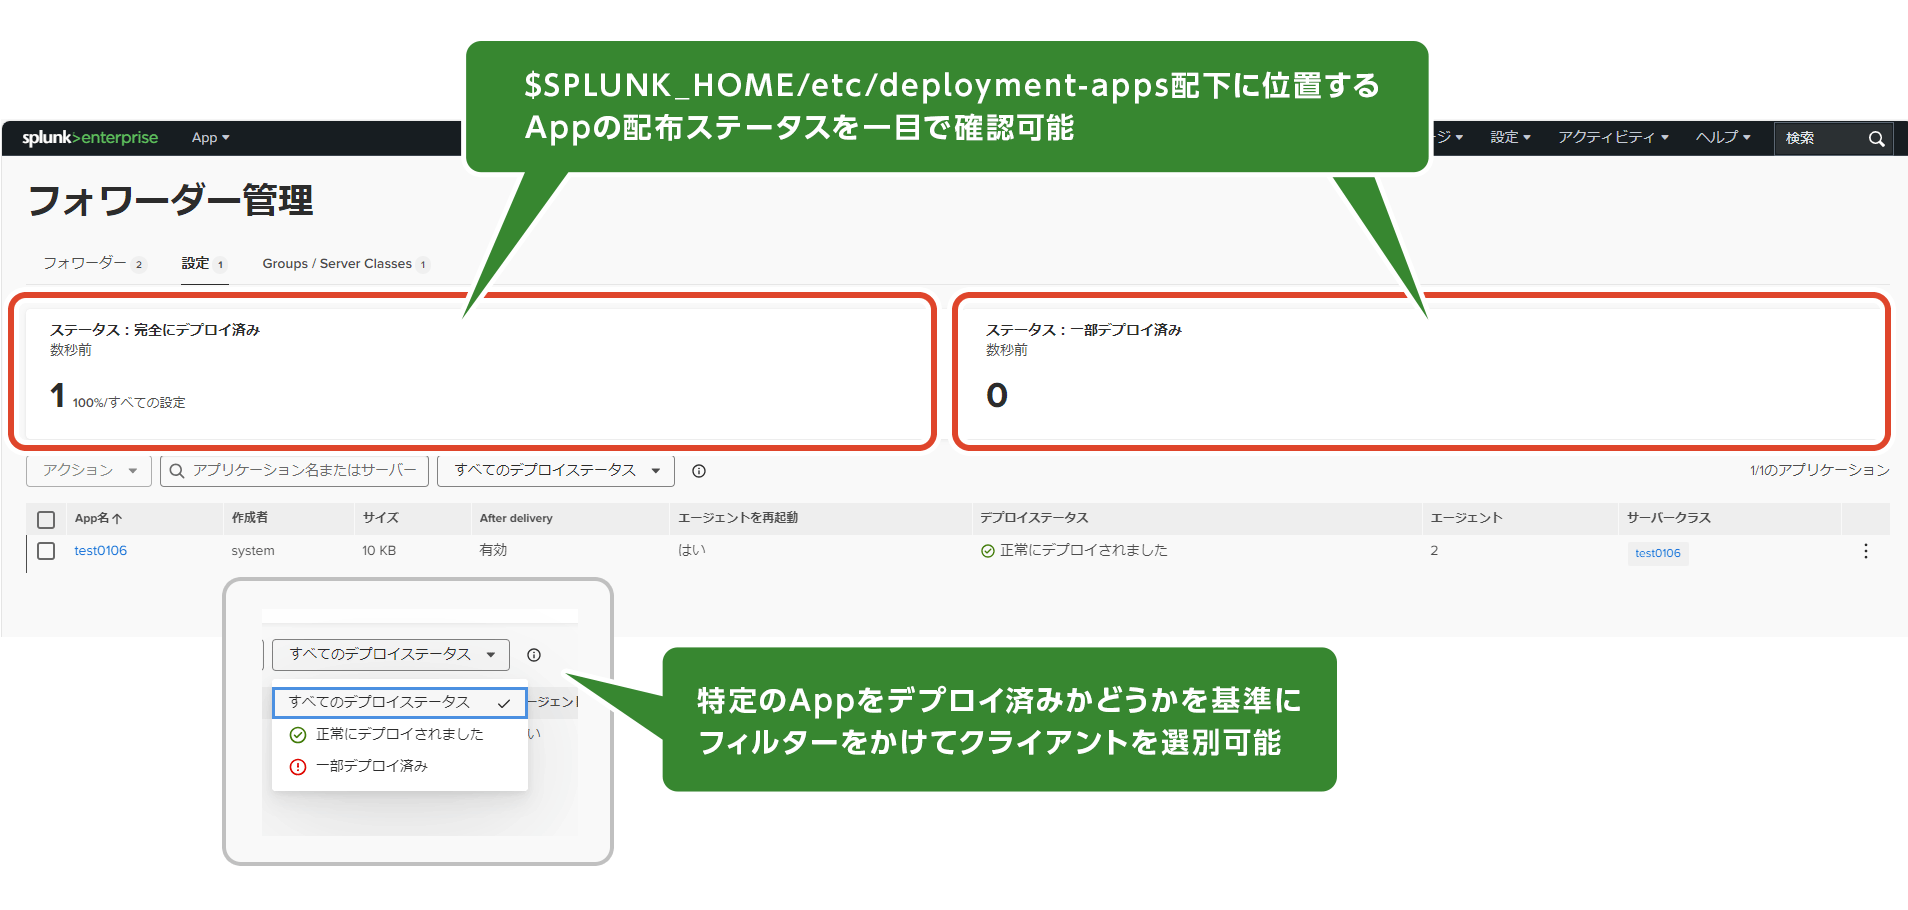
- Check whether your app is deployed successfully
- I want to filter clients by version
- I want to check errors when deploying an app to a client
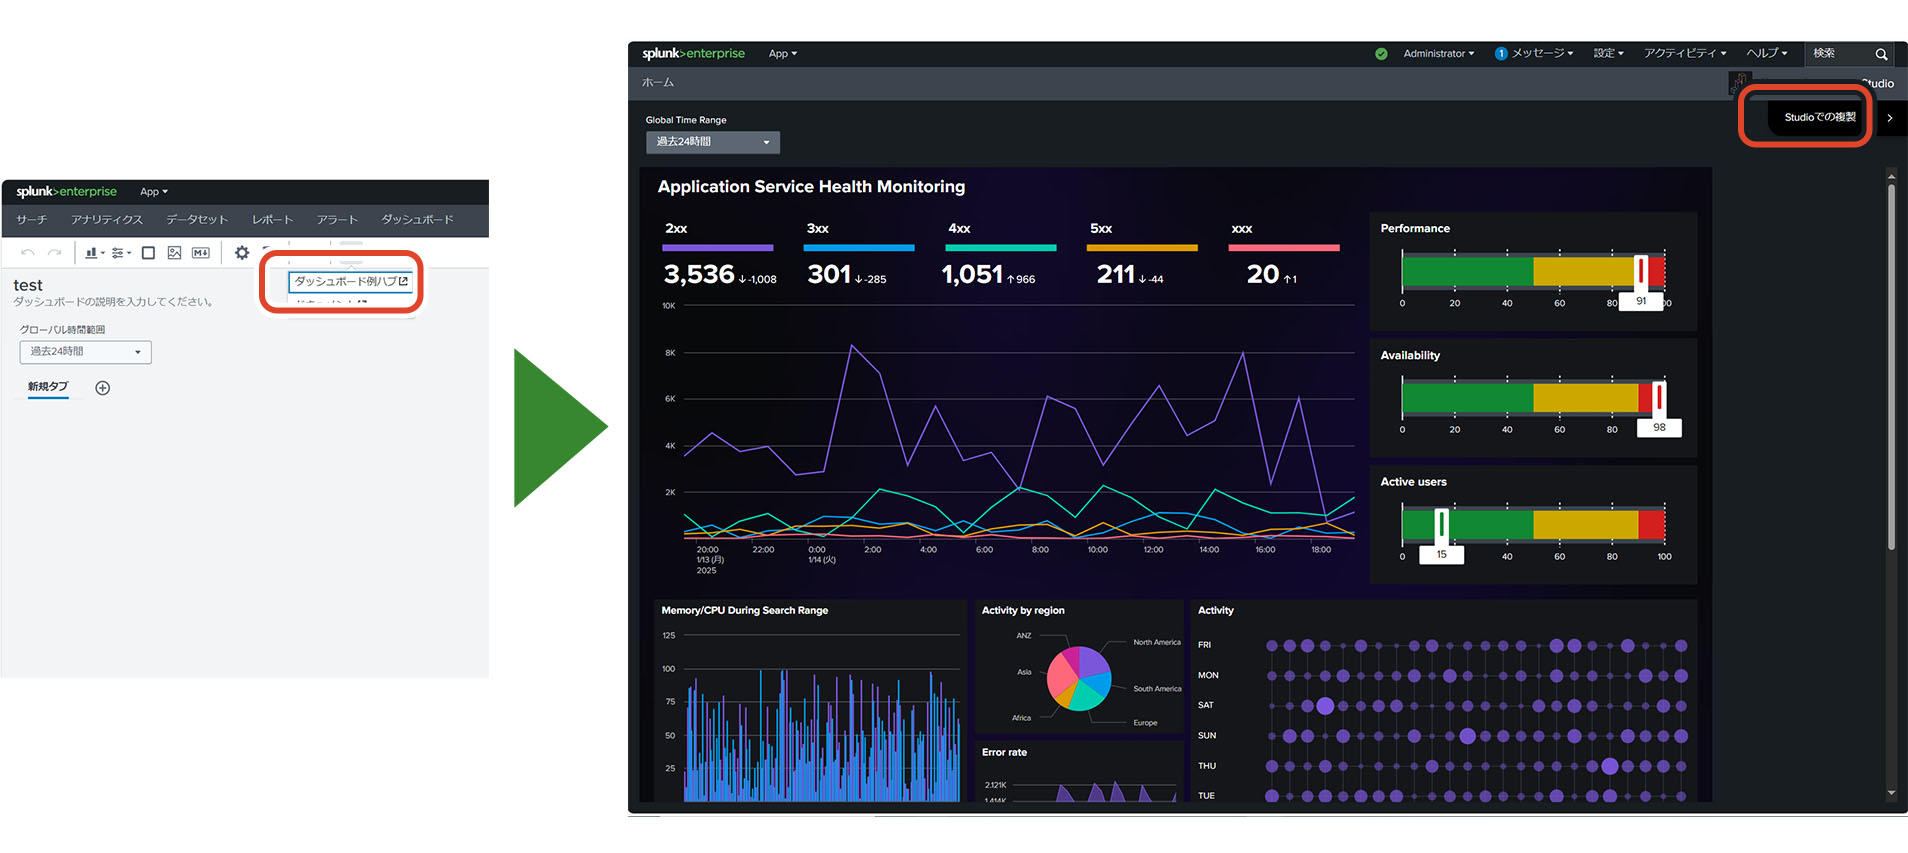
Dashboard Studio enhancements
You can now clone dashboards from the Examples Hub.
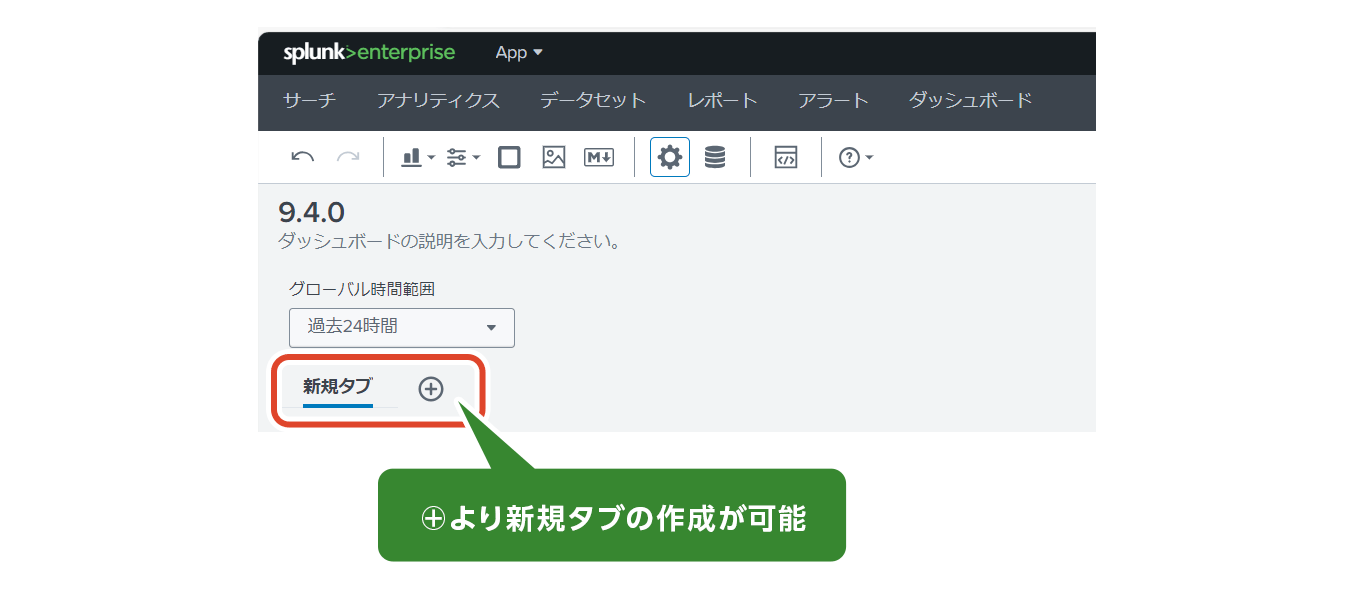
The Dashboard tab has been implemented.
Scheduled exports now render using Chromium by default.
- It is set to ON by default, and you can revert to the previous specifications by turning it OFF.
- The ON/OFF setting is described in the web-features.conf file under $SPLUNK_HOME/etc/system/default. To turn it OFF and return to the previous specifications (pre-9.3.2), change it to “activate_chromium_legacy_export = false”.
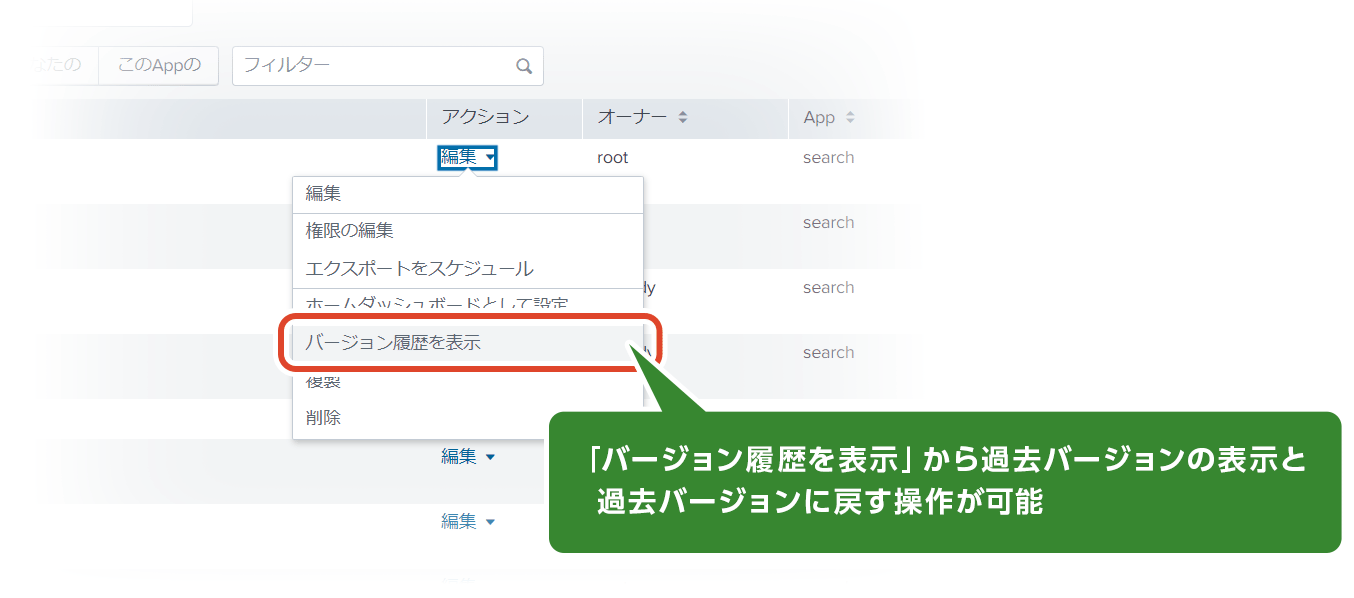
If you have editing permissions, you can now perform the following operations: "1. Save the latest version," "2. View previous versions," and "3. Revert to previous versions."
By reducing the amount of data rendered, it is now possible to improve dashboard performance.

The Splunk Platform and App bars are now collapsible.

- It is now possible to narrow the time range on time series charts to narrow down the scope.
- If you use Splunk Observability Cloud, you can now view observability metrics in dashboards.
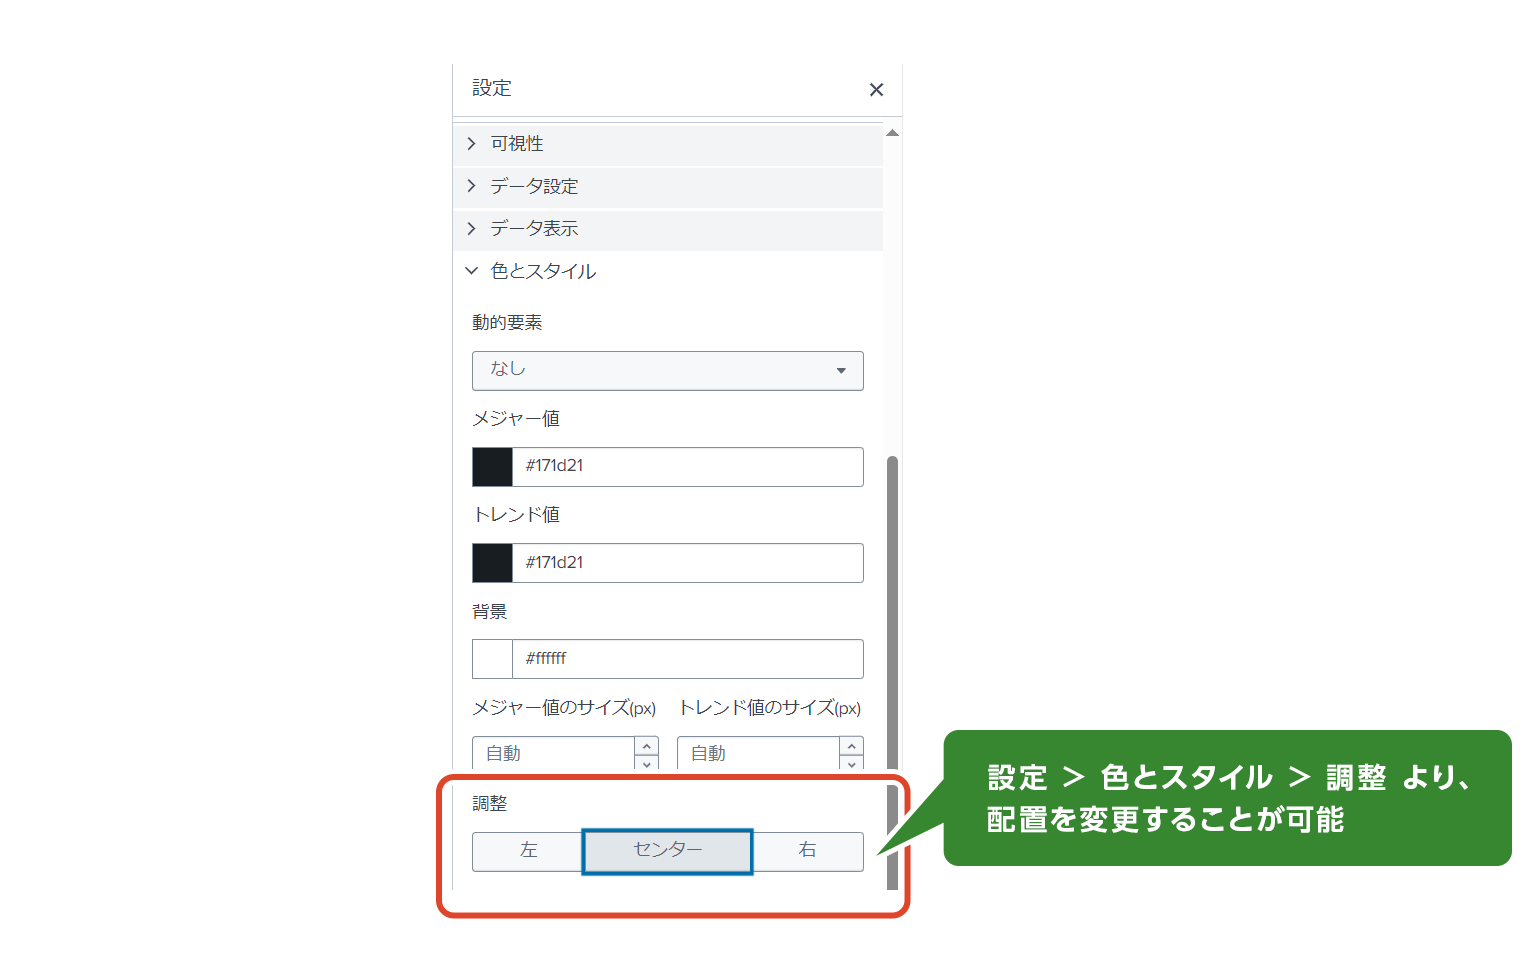
- It is now possible to change the alignment of single values and tables.
- I want to undo a mistake in the dashboard settings
- I want to arrange the charts on multiple tabs to suit my specific needs and classifications
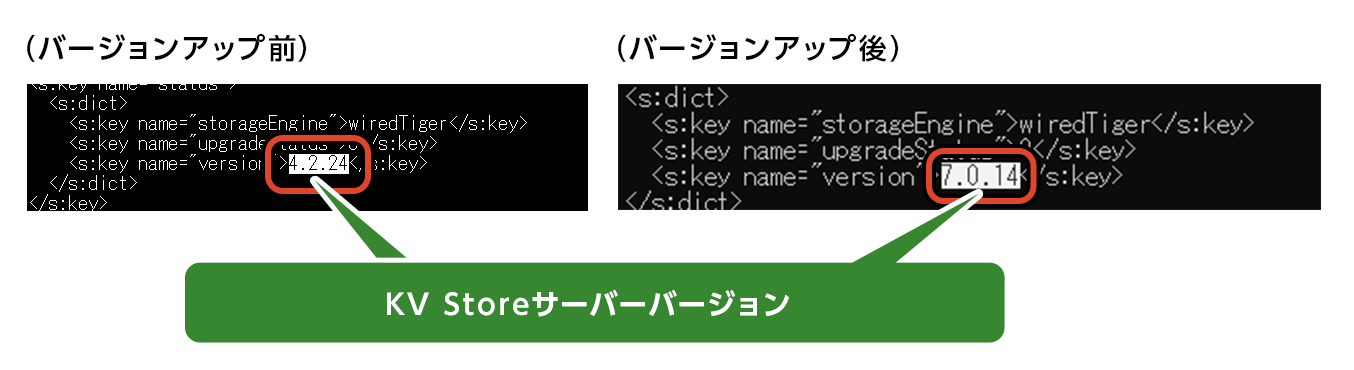
KV Store upgrade (ver4.2→7.0)
- Splunk Enterprise 9.4 requires the use of KV Store server version 7.0 or later.
- When you upgrade to Splunk Enterprise 9.4, the KV Store will automatically be upgraded from version 4.2 to 7.0.
Verification procedure (Linux/Windows)
- Upgrade to Splunk Enterprise 9.4
- Run the following command on the CLI:
curl -k -u admin:Macnica0- https://<IP address or DNS name of your Splunk server>:8089/services/kvstore/version
*Before upgrading to Splunk Enterprise 9.4, you must first upgrade your KV Store to version 4.2.
*More than 50% of the search head's disk capacity must be available.
*Before upgrading, please check that the KV Store is normal using the following command.
splunk show kvstore-status --verbose[kvstore]kvstoreUpgradeOnStartupEnabledfalse
Click here for function information of past and other versions
Inquiry/Document request
In charge of Macnica Splunk Co., Ltd.
- TEL:045-476-2010
- E-mail:splunk-sales@macnica.co.jp
Weekdays: 9:00-17:00