product
- Why choose Splunk
- Installation record
- price
- Splunk Enterprise Security
- Splunk Phantom (SOAR)
- Splunk ITSI (Next Generation IT Operations)
- Splunk Observability Cloud
- Splunk UBA
- Macnica CSIRT App Basic
- App for Splunk for Financial Institutions
- Splunk Analytics for Hadoop
- About Apps
- Splunk Edge Hub
- What is Splunk
service
- Dashboard/SPL Creation Pack [Implementation/Building Support]
- Version upgrade service [implementation and construction support]
- Smart Security Monitoring App [Original App/Service]
- Splunk × LANSCOPE Original App [Original App/Service]
- Security Monitoring App for Box [Original App/Service]
- Cloud Security Monitoring App [Original App/Service]
Specifications/Technical Information
Application for evaluation machine
- FAQ
Splunk
Splunk
Next-generation IT operation platform
"Splunk IT Service Intelligence"

The next-generation IT operation platform "Splunk ITSI" is Splunk's Premium App that makes IT system monitoring and failure investigation more advanced and efficient, and eliminates the dependence of operation work on individual skills. It realizes visualization of IT system dependencies and anomaly/prediction detection using machine learning.
Background of Splunk ITSI attracting attention
~ IT operation required in the DX era = IT Operation Analytics (ITOA) ~
DX (Digital Transformation), which all companies are working on, is based on the concept that "the penetration of IT will change people's lives in a better direction". The realization of DX means that business will become more dependent on IT systems. "How we can continue and stably operate the IT system" will greatly affect the future success of the business.
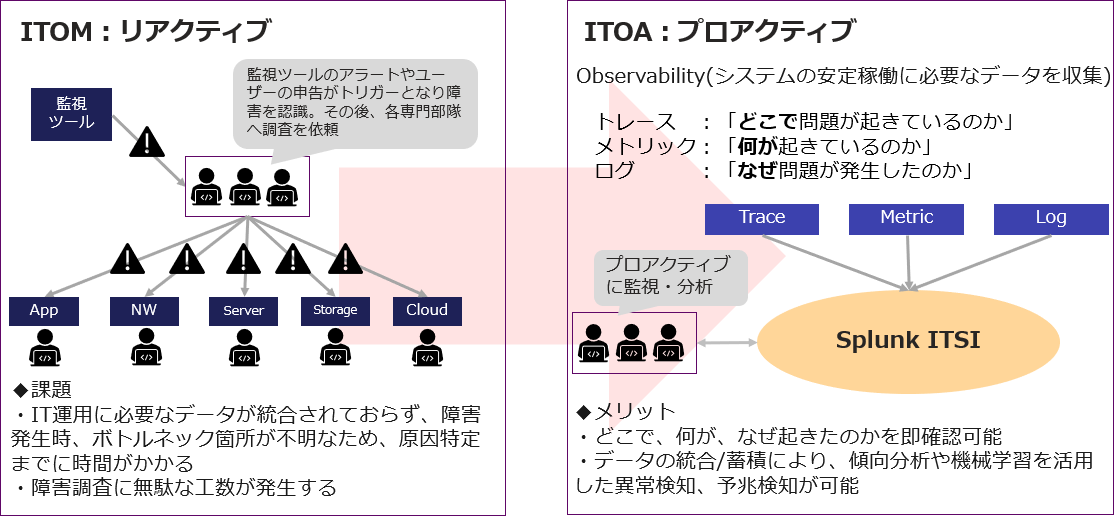
That is why IT operations are required to transform from ITOM (IT Operation Management) to ITOA (IT Operation Analytics).
ITOA integrates the data necessary for operation and utilizes machine learning to detect anomalies and predictive signs, and also realizes observability to quickly identify "where, what, and why" when a failure occurs. It is possible to.
Features of Splunk ITSI
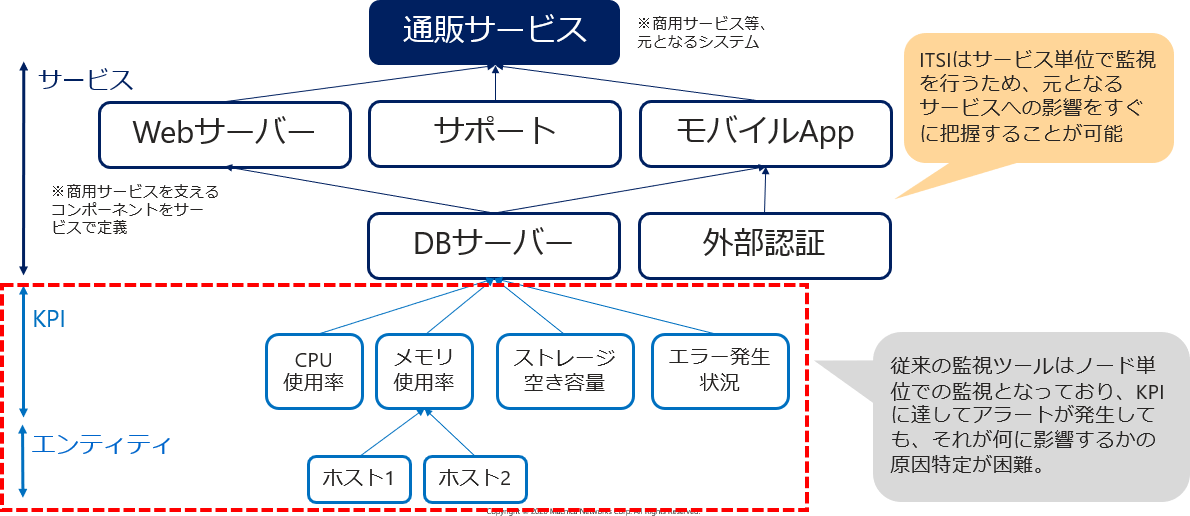
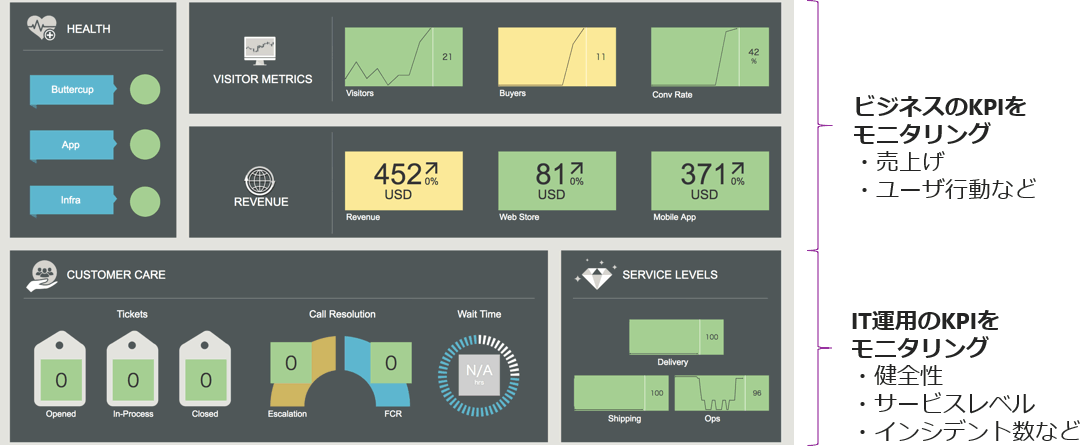
1. Service point of view monitoring
In order to keep the IT system running stably continuously, it is possible to clarify the dependencies of each service and monitor the status of the entire system instead of each host.
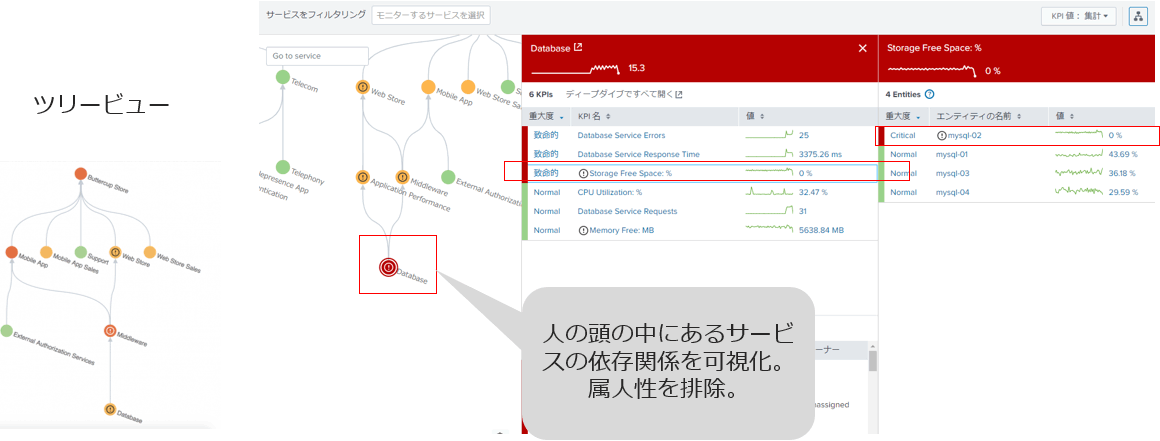
2. Quick fault isolation and root cause investigation -Tree view-
You can check the dependencies and health scores of each service that makes up the system, and easily identify the bottleneck point when a failure occurs.
*Database health score deteriorated → Storage KPI increased → Target host identified as mysql-02
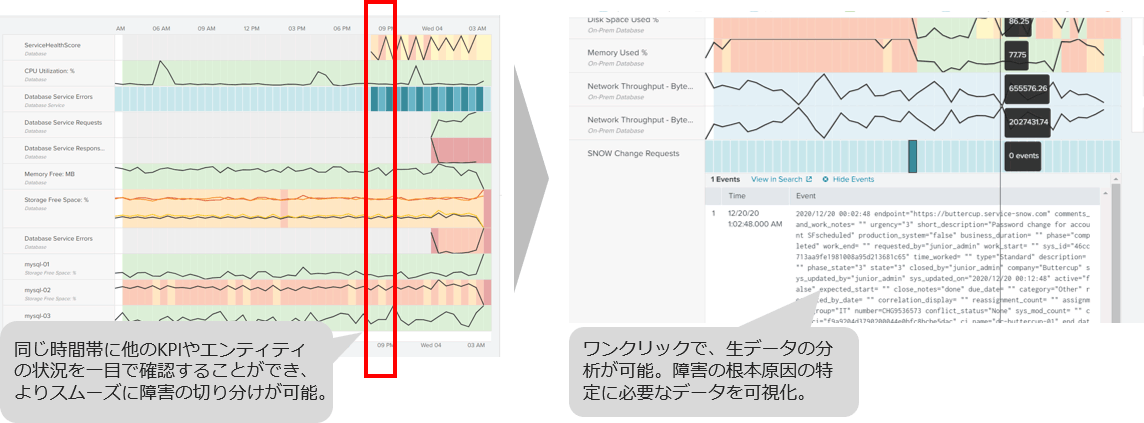
2. Rapid fault isolation and cause investigation ~Deep dive~
Useful for root cause identification (why did this failure occur). Each KPI necessary for measuring the health of the service can be confirmed at the same time, and furthermore, checking the event log contributes to the identification of the root cause.
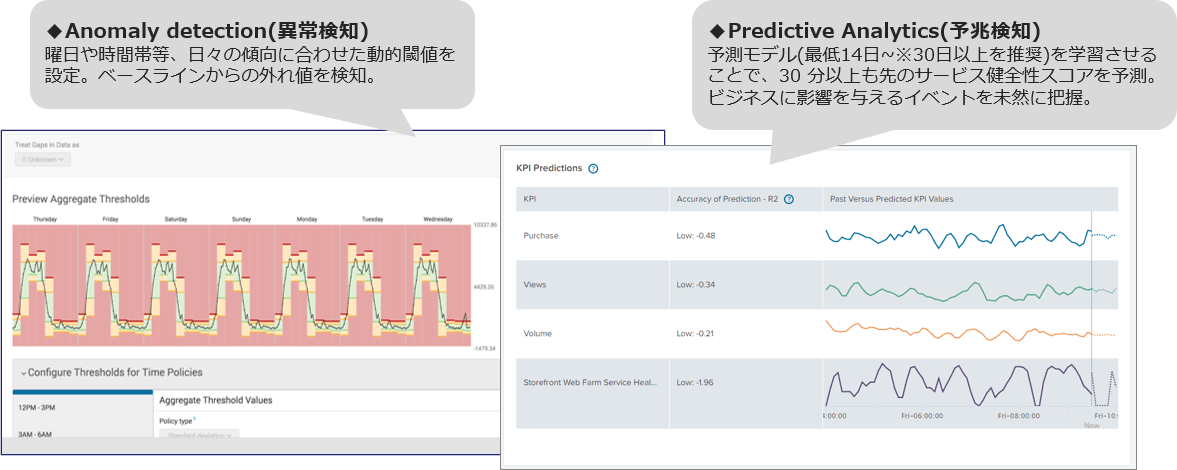
3. Proactive anomaly detection with machine learning
Leverage machine learning to reduce unnecessary alerts, streamline operations and eliminate lost opportunities.
Others: Create a dashboard with a high degree of freedom ~Glass table~
A flexible canvas and editing tools make it easy to create flexible dashboards.
Splunk ITSI Use Case
1. Case of SB Payment Service Corp., Ltd.

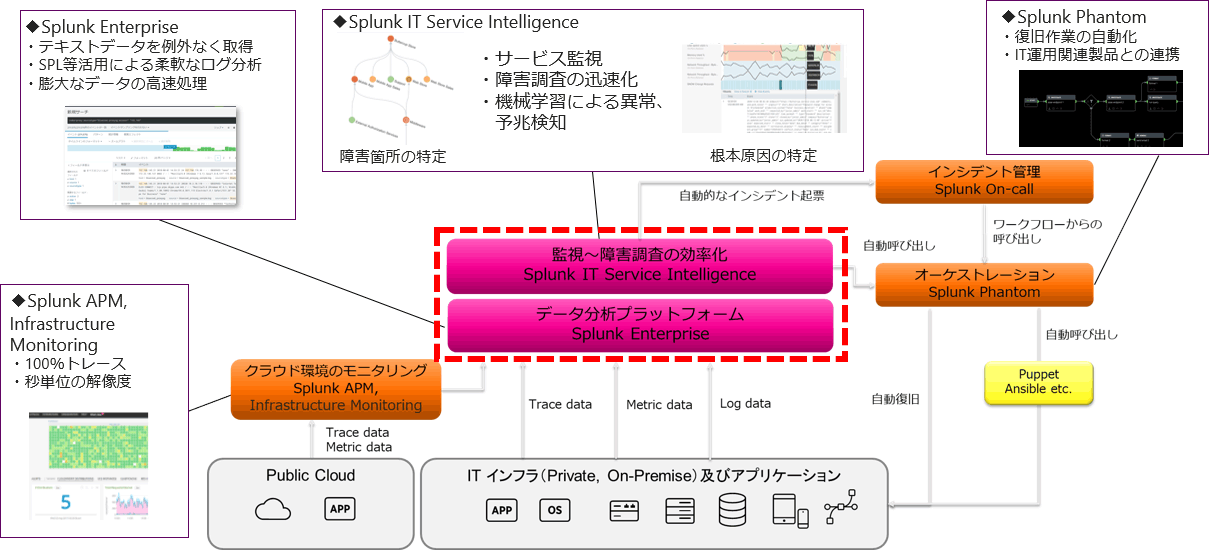
Overview of ITOA platform using Splunk
Splunk Enterpriseを核にして、IT運用を高度化するソリューションを幅広くご提供いたします。

Weekdays: 9:00-17:00


Inquiry/Document request
In charge of Macnica Splunk Co., Ltd.
- TEL:045-476-2010
- E-mail:splunk-sales@macnica.co.jp
Weekdays: 9:00-17:00