product
- Why choose Splunk
- Installation record
- price
- Splunk Enterprise Security
- Splunk Phantom (SOAR)
- Splunk ITSI (Next Generation IT Operations)
- Splunk Observability Cloud
- Splunk UBA
- Macnica CSIRT App Basic
- App for Splunk for Financial Institutions
- Splunk Analytics for Hadoop
- About Apps
- Splunk Edge Hub
- What is Splunk
service
- Dashboard/SPL Creation Pack [Implementation/Building Support]
- Version upgrade service [implementation and construction support]
- Smart Security Monitoring App [Original App/Service]
- Splunk × LANSCOPE Original App [Original App/Service]
- Security Monitoring App for Box [Original App/Service]
- Cloud Security Monitoring App [Original App/Service]
Specifications/Technical Information
Application for evaluation machine
- FAQ
Splunk
Splunk

Cloud-native approaches are attracting increasing attention in the construction of huge systems and service development in the DX era.
On the other hand, it is also necessary to change the monitoring mechanism from the conventional method.
It is possible to increase development speed without worrying about components.
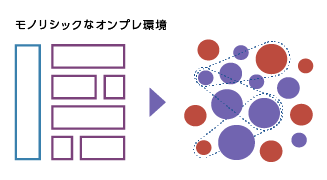
Make configuration changes easier with Microservices
Enabling a scalable environment
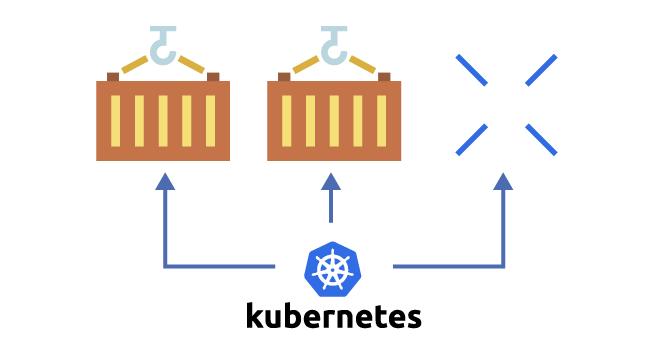
by container/Kubernetes etc.
Flexible, automated configuration
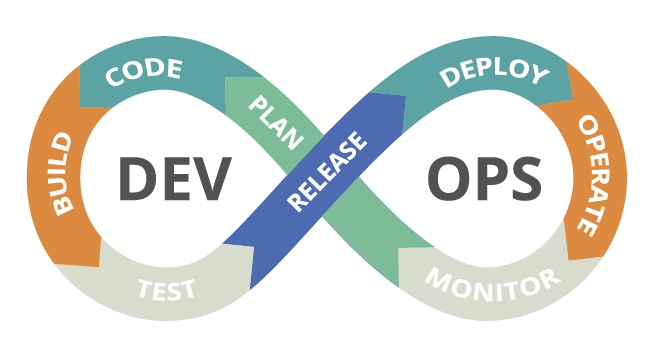
Realization of DevOps system
Faster development cycle

However, it is difficult to trace communication paths and interdependencies in distributed architectures.
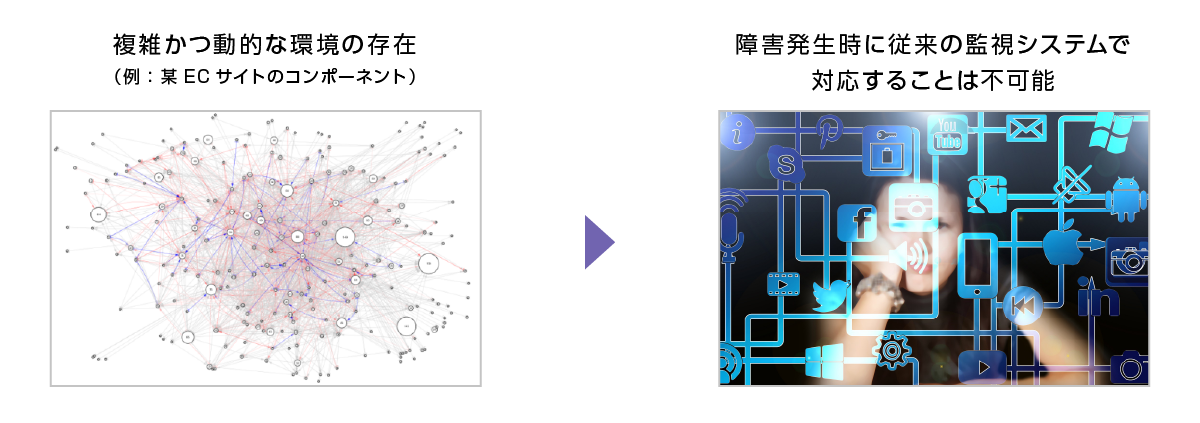
Even in complex and dynamic environments
Enables efficient monitoring, problem detection, and root cause investigation


What is Observability?
It is a word that combines Observe and Ability, and indicates whether it is possible to accurately grasp what is happening in the system and accurately deal with it.
Feature 1 By correlating data, it is possible to understand events even in a complex and dynamic environment
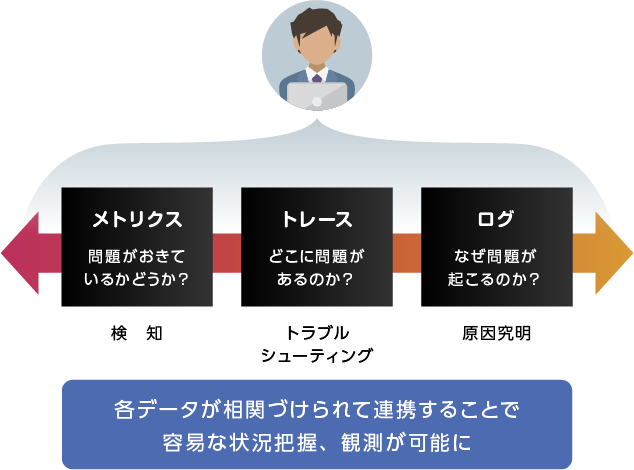
Conventional operation monitoring solutions were based on a static environment in which thresholds were set for each node and alerts were fired when KPIs reached their upper limits.
In a dynamic environment such as cloud-native, there is a need for a mechanism that enables immediate judgment even if the configuration changes, so "Observability" efforts are essential.
Observability's solution enables easy situational awareness and observation even in dynamic environments by correlating various data (logs, metrics, traces).
Feature 2 Easy-to-understand UI enables intuitive operation
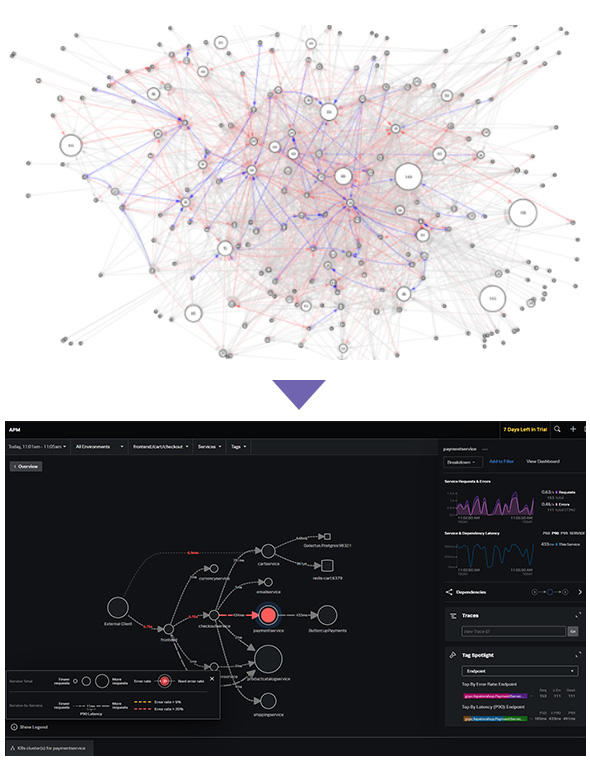
System failures in corporate systems and services lead to great losses. Even in a robust cloud-native environment, investigating the cause of failures and speedy recovery is one of the important measures to be taken.
Powered by Observability, even in complex Microservices architectures, an automatic tree-structured UI reveals dependencies and enables rapid fault isolation.
Feature 3 Digital Experience Monitoring
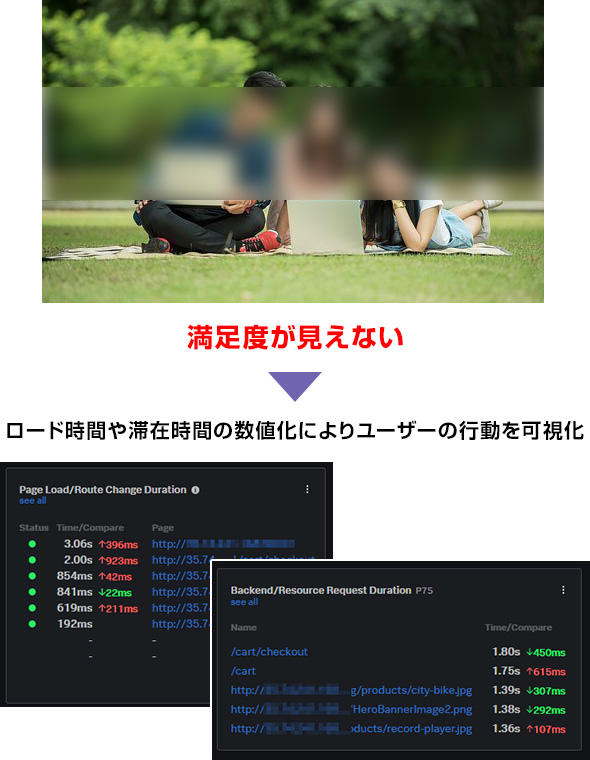
While it is important to visualize the back-end applications and infrastructure environments in system and service operations, it is also important to monitor the front-end systems, such as actual user behavior and UI screens.
"Observability" makes it possible to monitor from the impact of specification changes and new releases on the user side to the usual performance.
Splunk Observability Cloud
The only product that enables full-stack, end-to-end observation
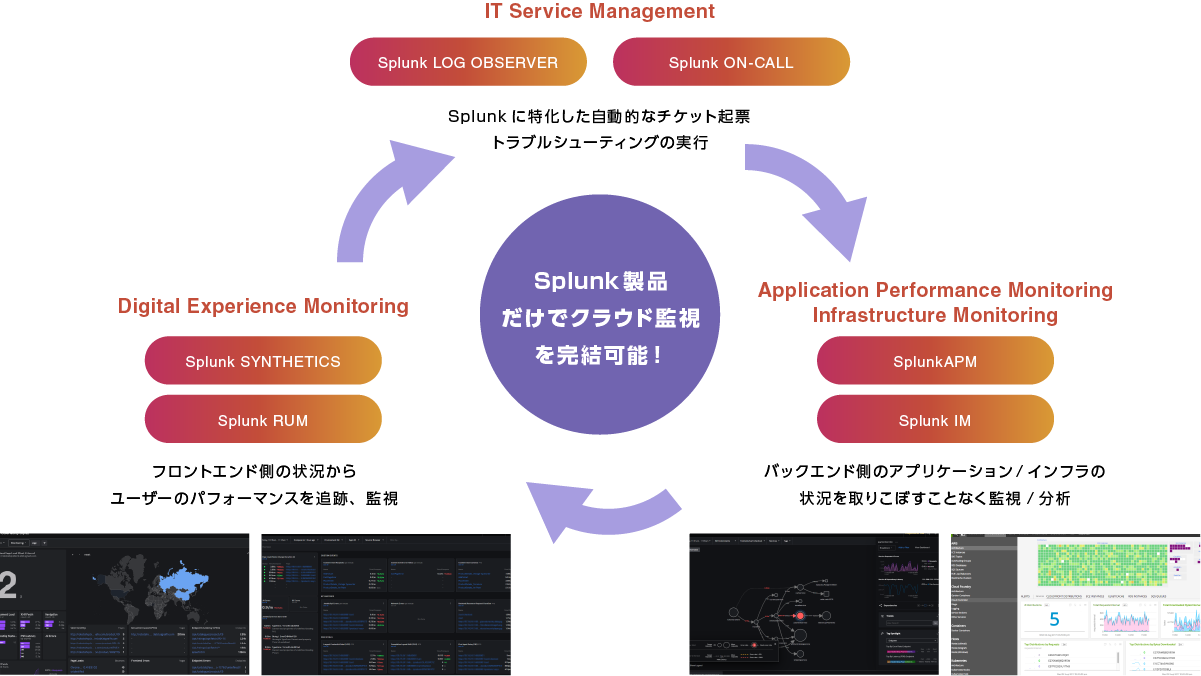
Highlight all the challenges companies face
Visibility from front-end to back-end
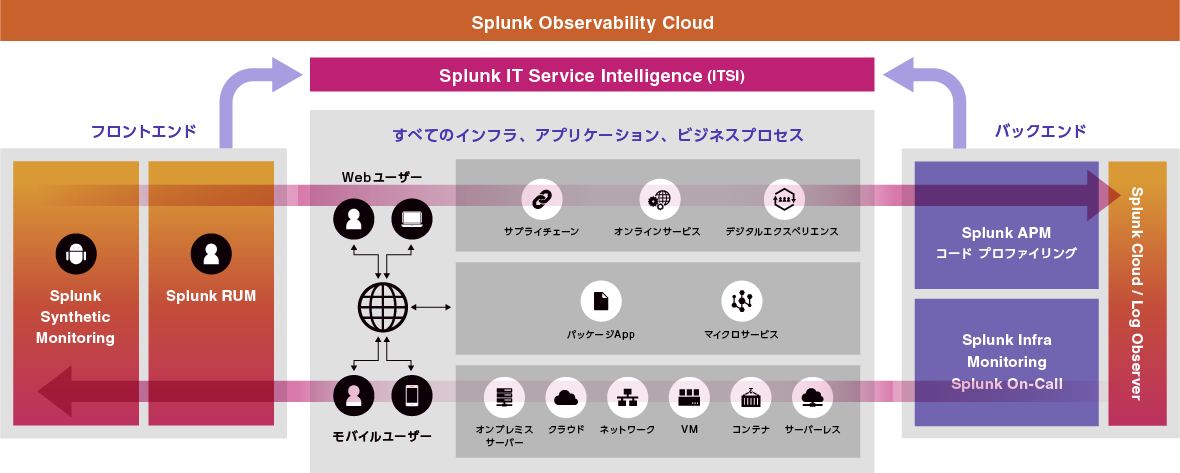
Splunk can comprehensively monitor from on-prem environment to cloud native
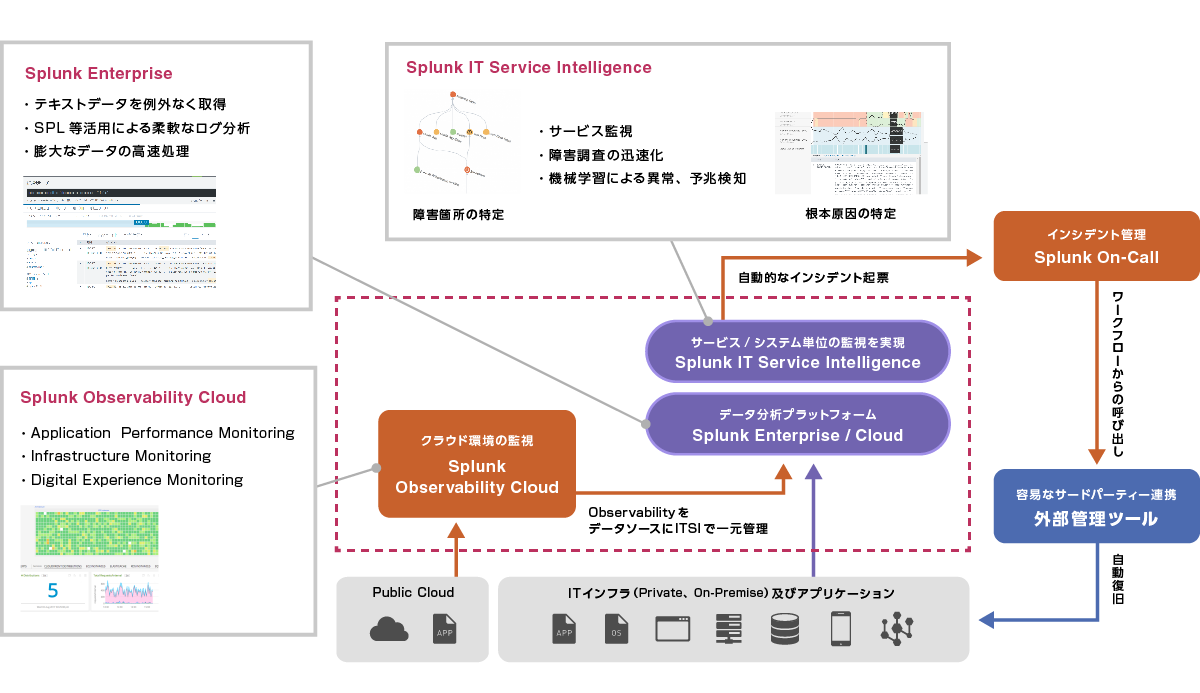
With Splunk at the core, we provide a wide range of solutions that advance IT operations.
Inquiry/Document request
In charge of Macnica Splunk Co., Ltd.
- TEL:045-476-2010
- E-mail:splunk-sales@macnica.co.jp
Weekdays: 9:00-17:00