
A common obstacle to becoming a smart factory - is it just limited to visualization?
The creation of smart factories at manufacturing sites is an important project that many companies are embarking on. In particular, efforts such as monitoring the operation status of equipment in real time and visualizing data to make the situation at the site clear at a glance are attracting attention as the first step to improving efficiency. The approach of understanding the operating rate, downtime, and reasons for downtime of the manufacturing line and improving the site based on that information is being introduced at many sites.
However, this is where many manufacturing sites stop for a moment. This is because, although "visualization" is effective in discovering problems, it is difficult to approach the fundamental problems of the production line with just that. Even if it becomes possible to visualize equipment operation data in real time, what can be obtained is the "result" and not the "cause." For example, further data and analysis are needed to clarify why the line stops so frequently and how the stoppage is affecting the entire production.
"Invisible problems" that cannot be solved with equipment data alone
By collecting and visualizing equipment data, it is possible to obtain information such as "how much of which equipment is currently operating", "which equipment has stopped", and "what is the cause of the stoppage". Specifically, by using graphs such as those shown below, such as monthly and weekly stoppage loss comparisons, daily operation rate trends, downtime comparisons by loss reason, Pareto charts by stoppage reason, and downtime decomposition trees, you can visually grasp the equipment operation status and stoppage causes, and check the overall picture of the site.
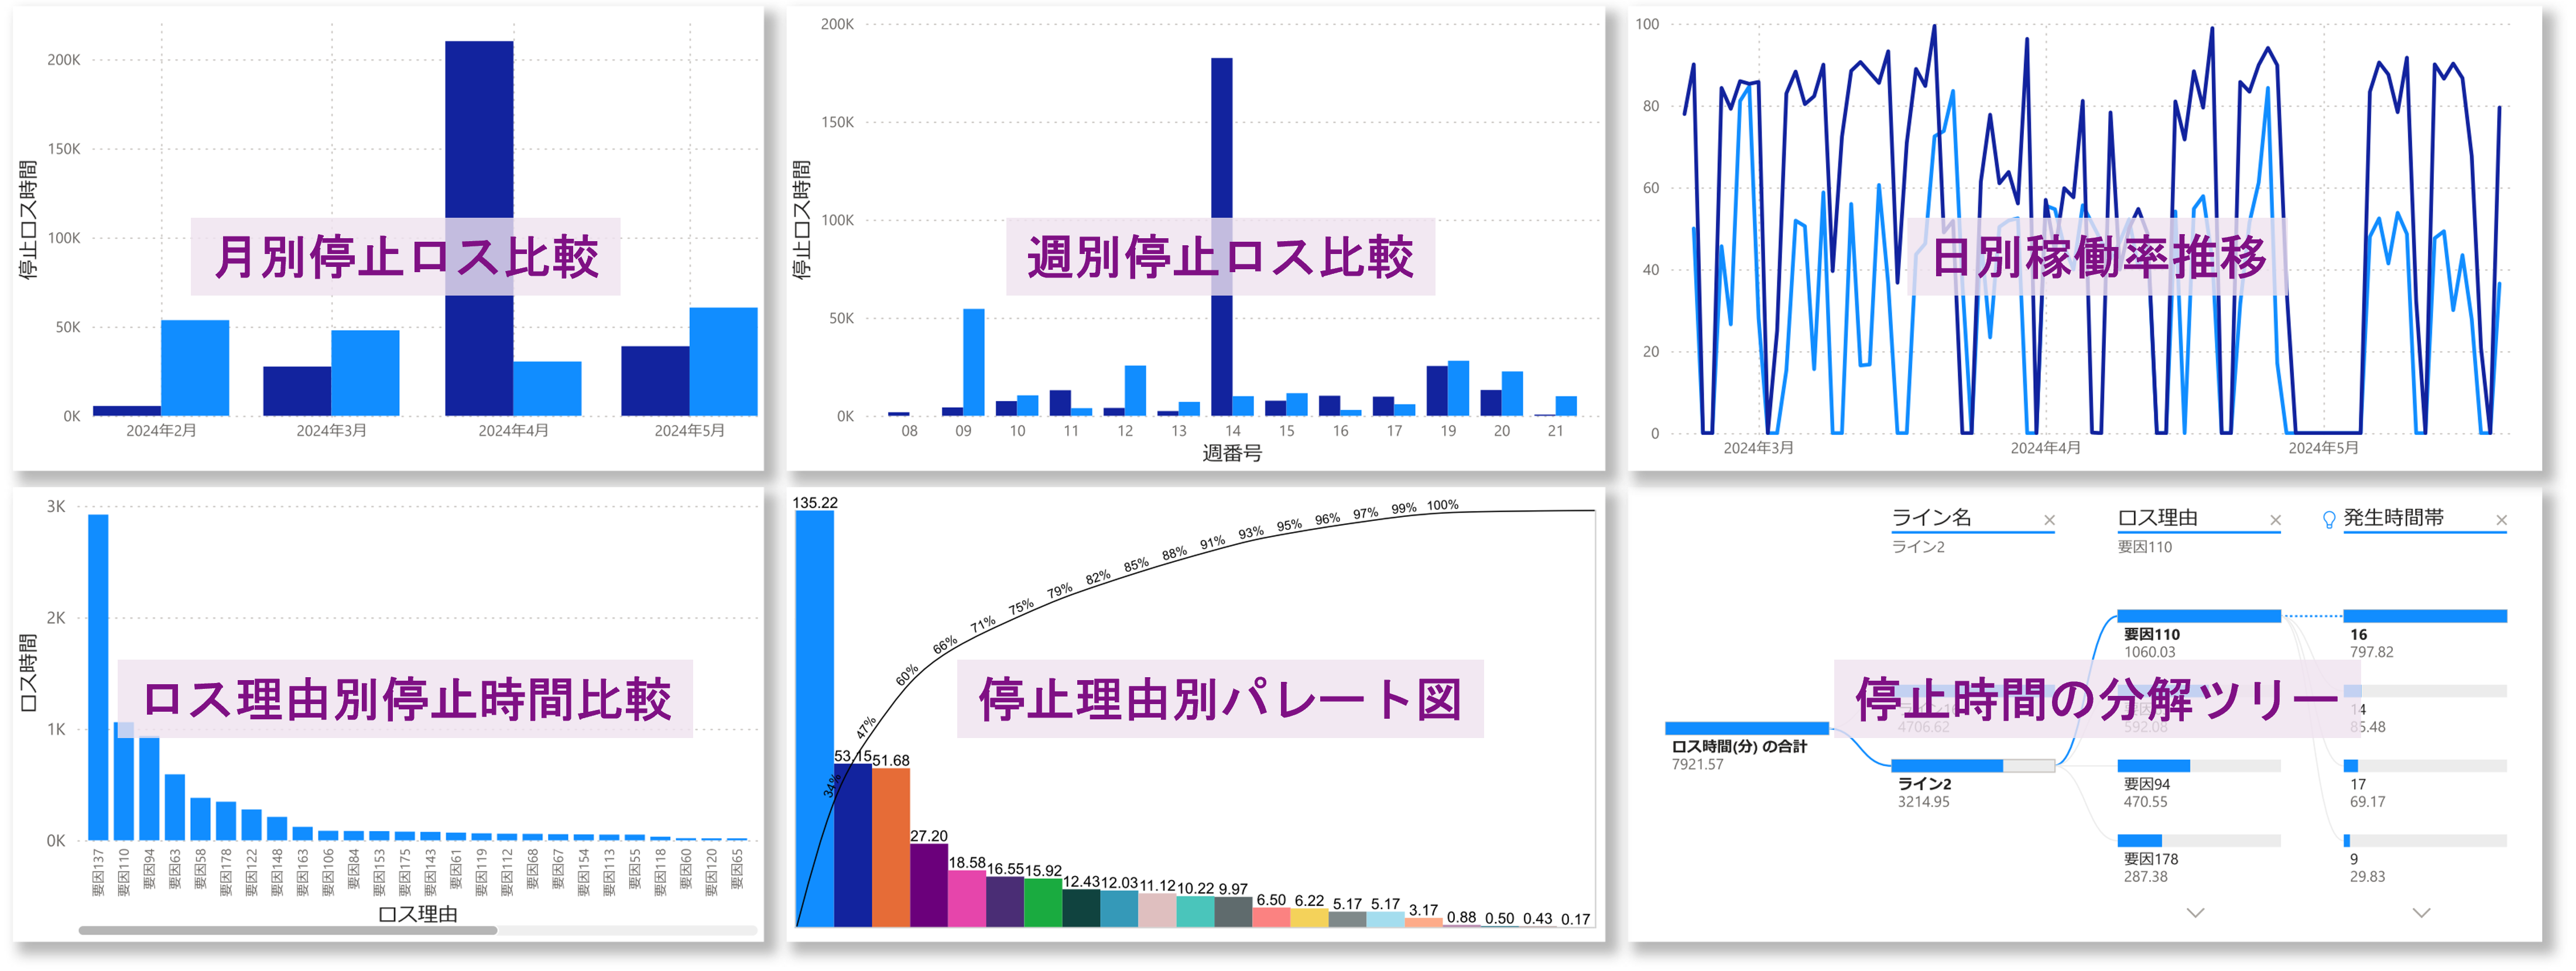
Graph example using equipment data
However, this alone cannot solve the real problems at the site, because the operation status of the equipment is merely a "surface phenomenon" and does not reveal the root cause of the stoppage or its impact on the entire production.
For example, let's say a production line frequently stops. This may be due to equipment failure or lack of maintenance, but it could also be due to a combination of factors such as changes to the production plan, operator error, or even delays in the supply of materials.
Equipment data alone cannot fully grasp these complex causes. In order to fundamentally solve on-site issues, it is necessary to not only monitor the equipment status, but also to conduct "multifaceted analysis" that links equipment data with other production data.
Limitations of outage time and cause data
・It is difficult to break down the reasons for stoppages for each product.
Equipment data alone is not enough to identify the cause of stoppages specific to a product. The causes of stoppages vary from product to product, and in order to identify them, it is necessary to compare data with daily reports and work operations. This can make analysis complicated and delay on-site responses.
・It is difficult to identify discrepancies with production plans.
When actual time is longer than the production plan, it is not easy to determine what is causing the deviation from the plan. There may be a stoppage involved, but without checking the start and end times of production, it is difficult to determine the exact cause of the deviation.
・Insufficient confirmation of the suitability of equipment and lines against standard production times
In order to evaluate whether each line or facility is operating appropriately for its standard production capacity, it is essential to compare it with the standard time. Without this, even if it appears to be operating, waste may actually be occurring.
Resolving invisible issues through multifaceted data analysis
As you can see, there are limitations to just looking at downtime and equipment data. So how can we solve the real issues? The answer lies in multifaceted data analysis. By integrating and analyzing equipment data with other data such as production instructions, production plans, and quality data, we can discover the underlying issues and make real improvements.
The power of normalized data - DSF Cyclone creates true Kaizen
DSF Cyclone supports this multifaceted data analysis. DSF Cyclone does not simply collect equipment operation data, but normalizes and centrally manages all data generated within the factory, such as production instructions, production plans, and quality data. This "normalized data" allows for detailed understanding of not only equipment operation status, but also production results for each product, quality fluctuations, and deviations from production plans.
For example, if a certain product is produced on a certain line and there are a lot of defects, DSF Cyclone can be used to perform a detailed analysis of which equipment that product was produced on, when, and under what conditions. It also makes it easy to compare with other products and other production lines, and it helps to identify the root cause. This makes it possible to develop more effective kaizen measures, such as reviewing production plans and work procedures themselves, rather than simply repairing and maintaining equipment.
The diagram below shows the difference between equipment data and normalized data. Conventional equipment data simply visualizes the equipment's operating status and the reason for shutdown, but data normalized by DSF Cyclone integrates order numbers, standard production times, detailed information for each product, and even the timing of shutdowns and maintenance work. This makes it possible to analyze beyond mere "phenomena" and delve into the "causes," achieving deeper problem solving.
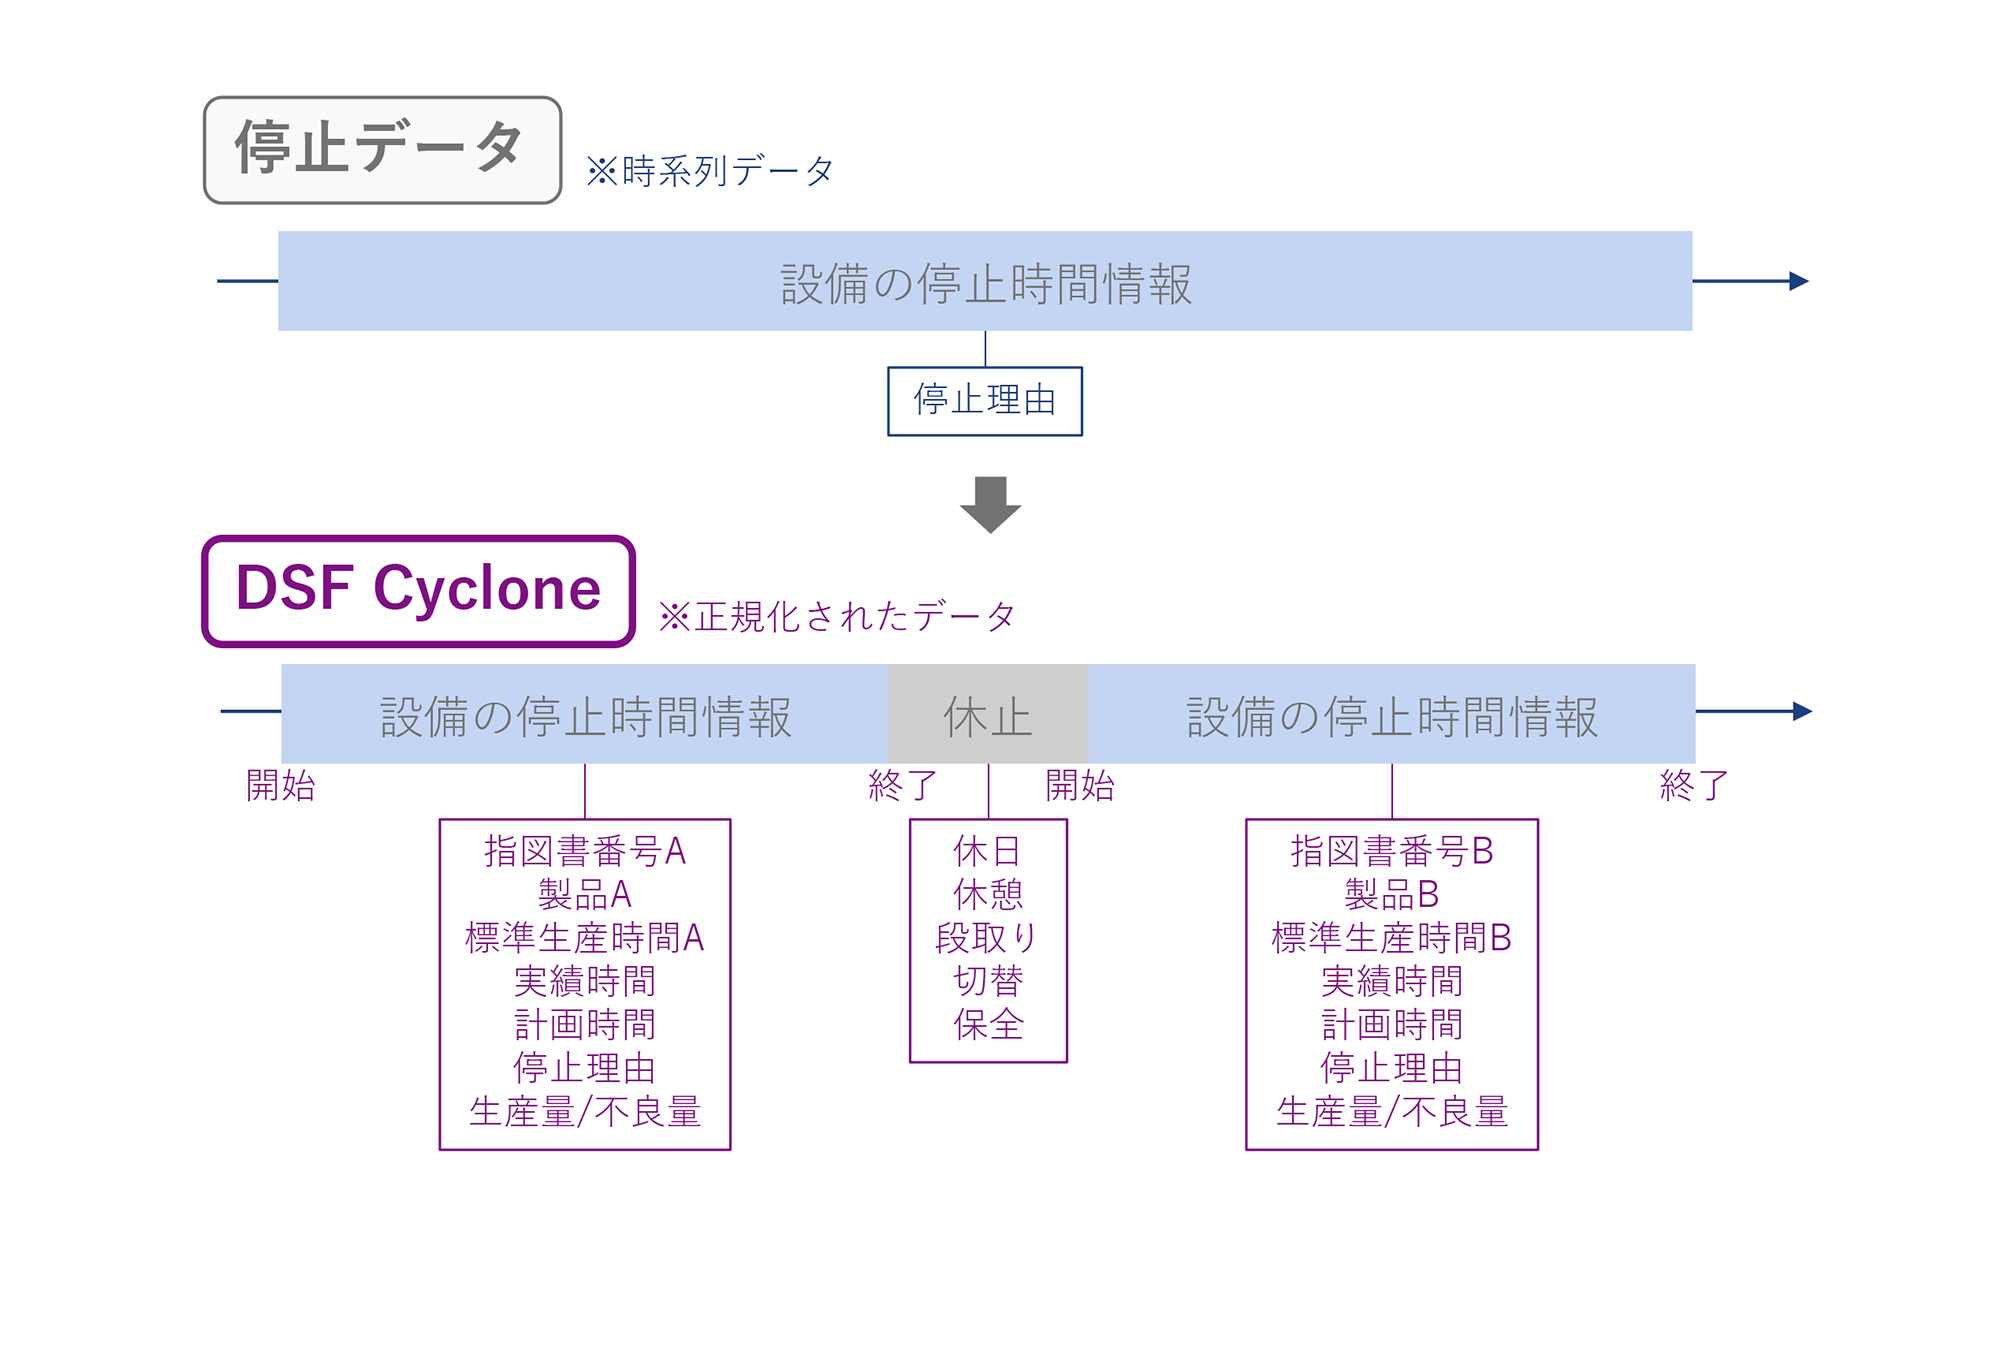
Comparison of data structures between facility data and DSF Cyclone data
The table below shows the difference in "analysis axes" between facility data and DSF Cyclone normalized data. More analysis axes allow for more detailed analysis.
|
Analysis axis |
Facility Data |
DSF Cyclone |
|---|---|---|
|
line |
〇 |
〇 |
|
Facilities |
〇 |
〇 |
|
Stop time / number of times |
〇 |
〇 |
|
Reason for suspension |
〇 |
〇 |
|
Production Planning Time |
〇 |
〇 |
|
Standard production capacity value |
― |
〇 |
|
Production Products |
― |
〇 |
|
Manufacturing Instructions |
― |
〇 |
|
Actual production time |
― |
〇 |
|
Production volume / defective volume |
― |
〇 |
|
shift |
― |
〇 |
|
Maintenance Record |
― |
〇 |
|
Cycle Stop Information |
― |
〇 |
Specific benefits of DSF Cyclone
Benefits of deploying DSF Cyclone include:
1. Multifaceted analysis of the cause of the outage
By comparing the cause of equipment downtime with production instructions and quality data, you can identify the underlying root causes, allowing you to plan specific actions that will lead to overall improvement rather than simply fixing the equipment.
2. Optimization of production plans
Production plans can be optimized based on production data acquired in real time. By understanding the difference between plans and results and making appropriate adjustments, production efficiency can be improved.
3. Improve quality and reduce defects
By correlating and analyzing equipment operation status with quality data, it is possible to identify which equipment or processes are affecting the occurrence of defects and to implement specific kaizen measures to improve quality.
Specific analysis examples using DSF Cyclone
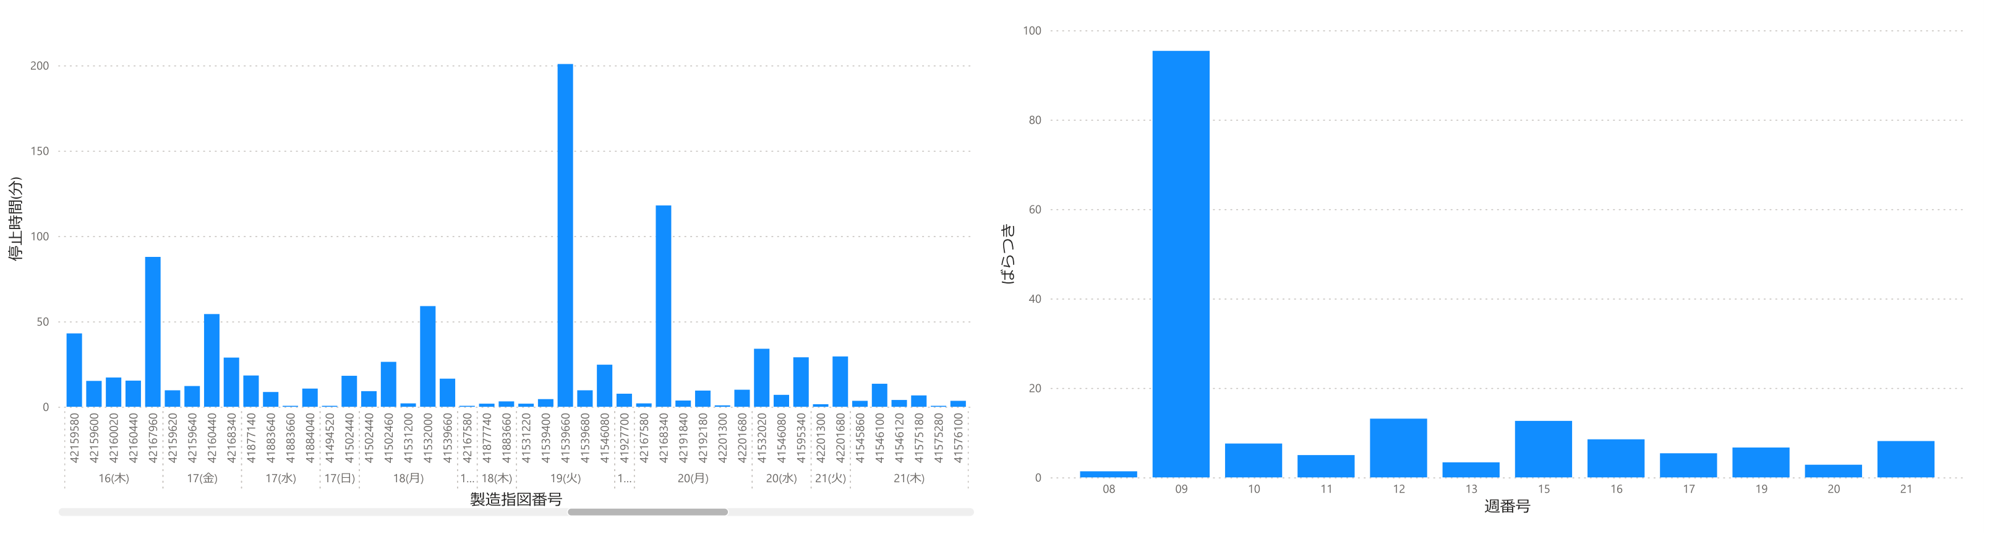
1. Analysis of downtime by order
You can collect downtime for each manufacturing order number and understand the variation in downtime for each manufacturing order number.
By comparing the downtime by manufacturing order number on a weekly basis and checking the stability of production, improvement measures can be considered promptly.
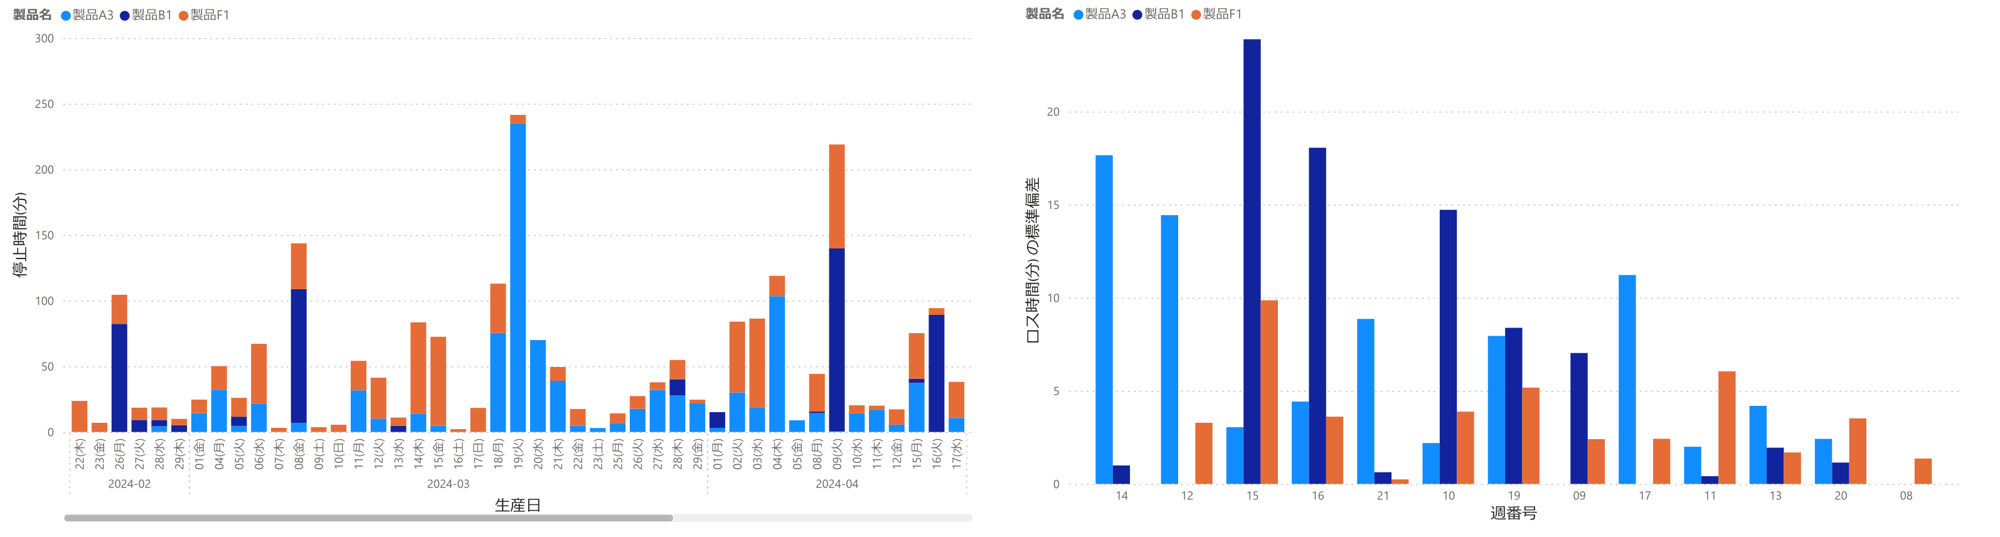
2. Analysis of downtime by production day
By aggregating downtime by production day and adding a legend for each product, it is possible to identify which products are causing the most downtime on which days.
This allows you to identify any abnormalities on a particular day or with a product and take appropriate action.
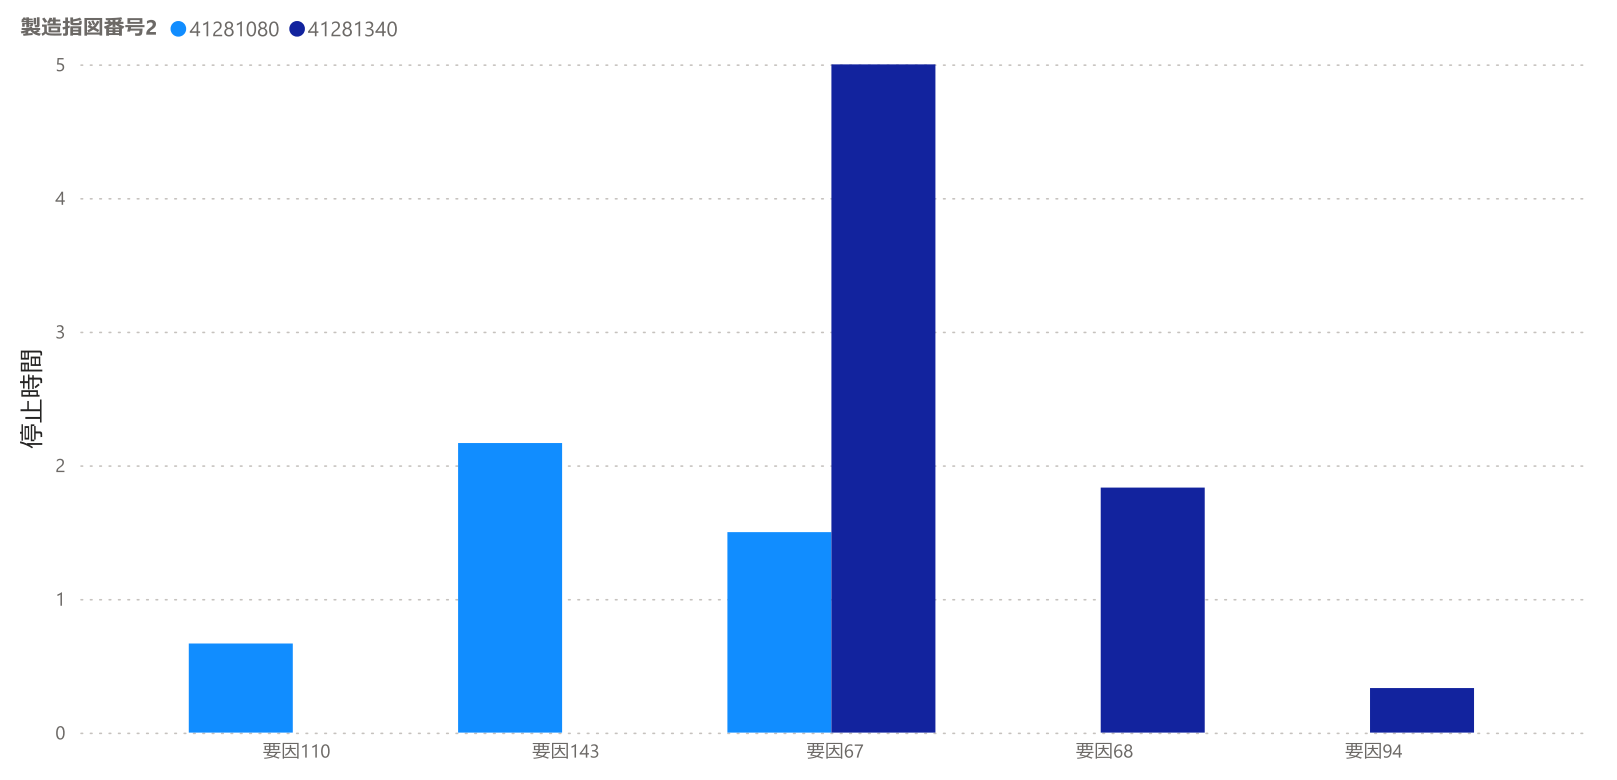
3. Comparison of downtime by reason for downtime on an instruction basis
By analyzing the time difference for each stoppage reason for each manufacturing order number, you can identify the reason why a certain manufacturing order number is causing a longer stoppage than other manufacturing order numbers and take measures.
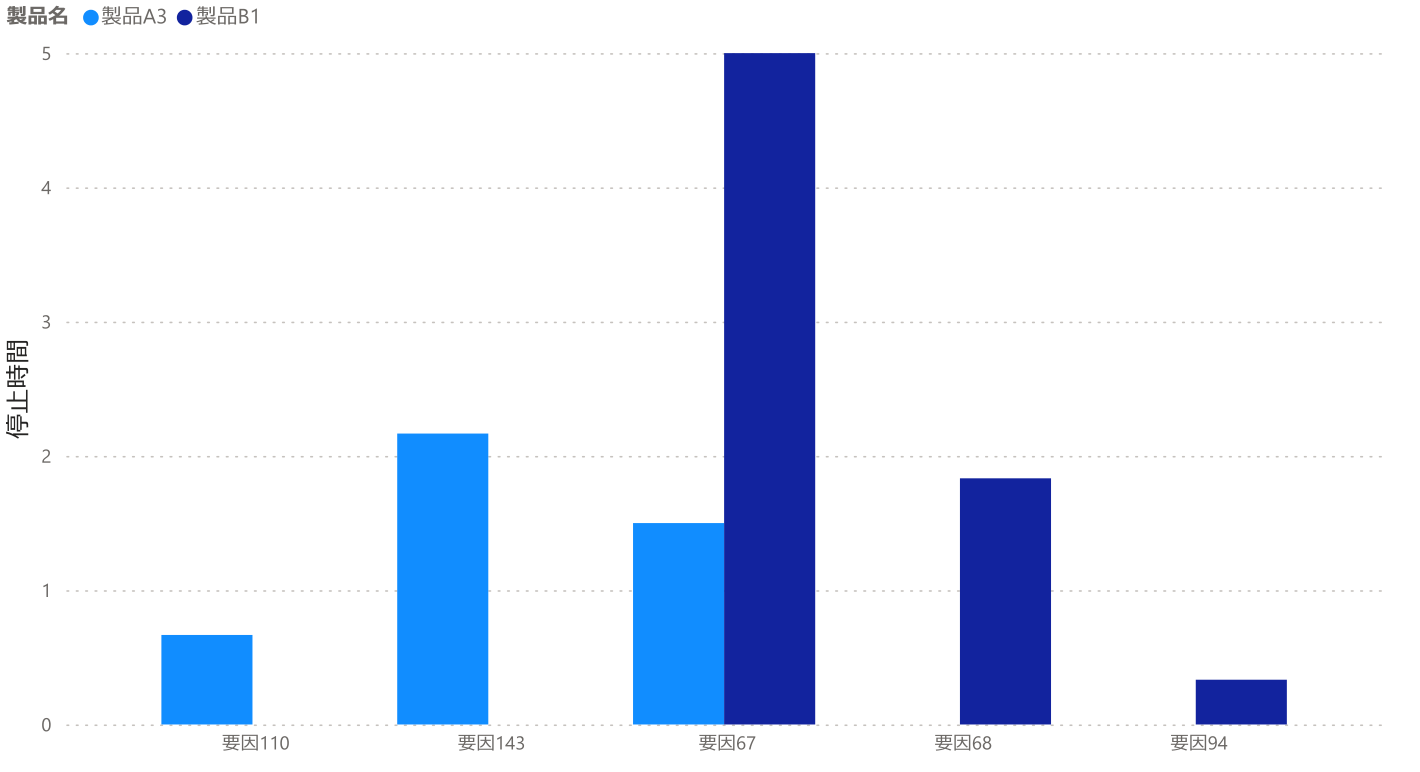
4. Comparison of downtime by loss reason on a product-by-product basis
By comparing the downtime for each reason for a particular product, if that product requires longer downtime than other products, you can find out the reason and consider ways to improve it.
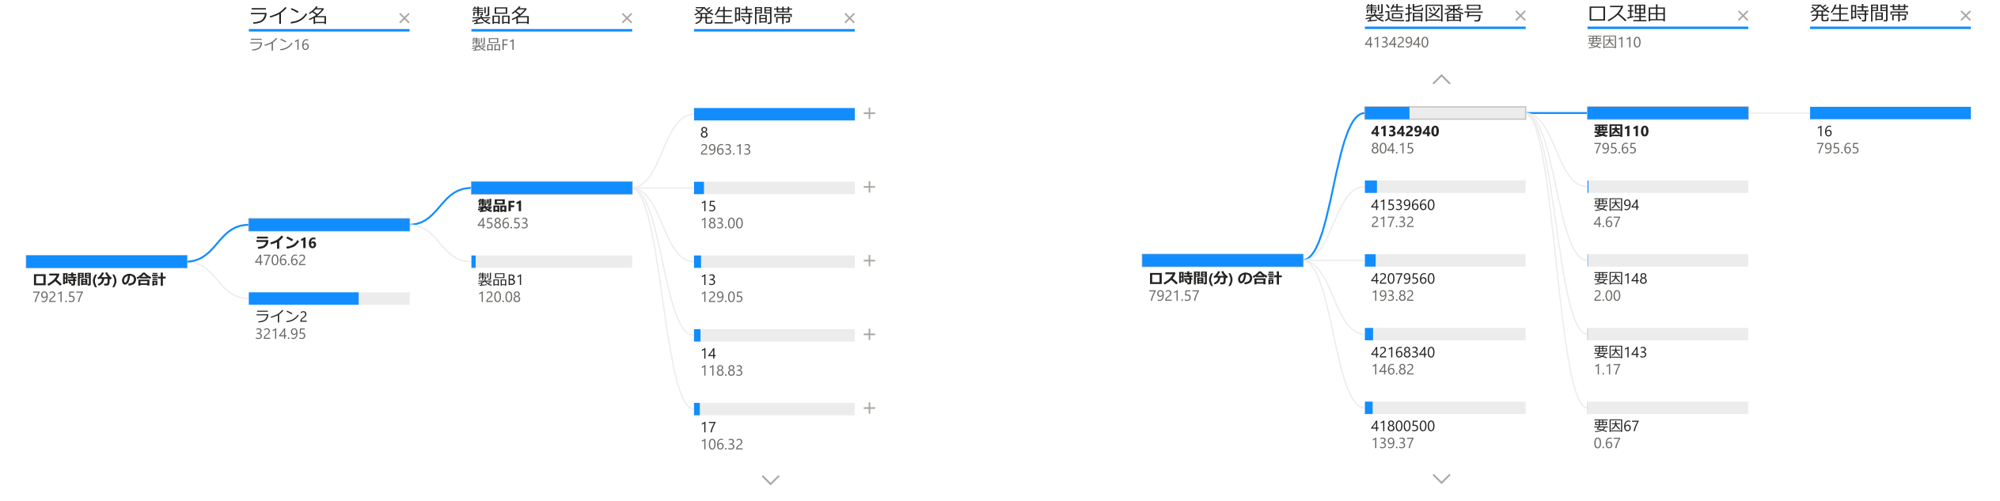
5. Disassembly tree including manufacturing order number, product, etc.
It is possible to analyze not only equipment but also other elements such as instruction numbers and products, allowing you to analyze the cause of stoppages in more detail and find improvement measures.
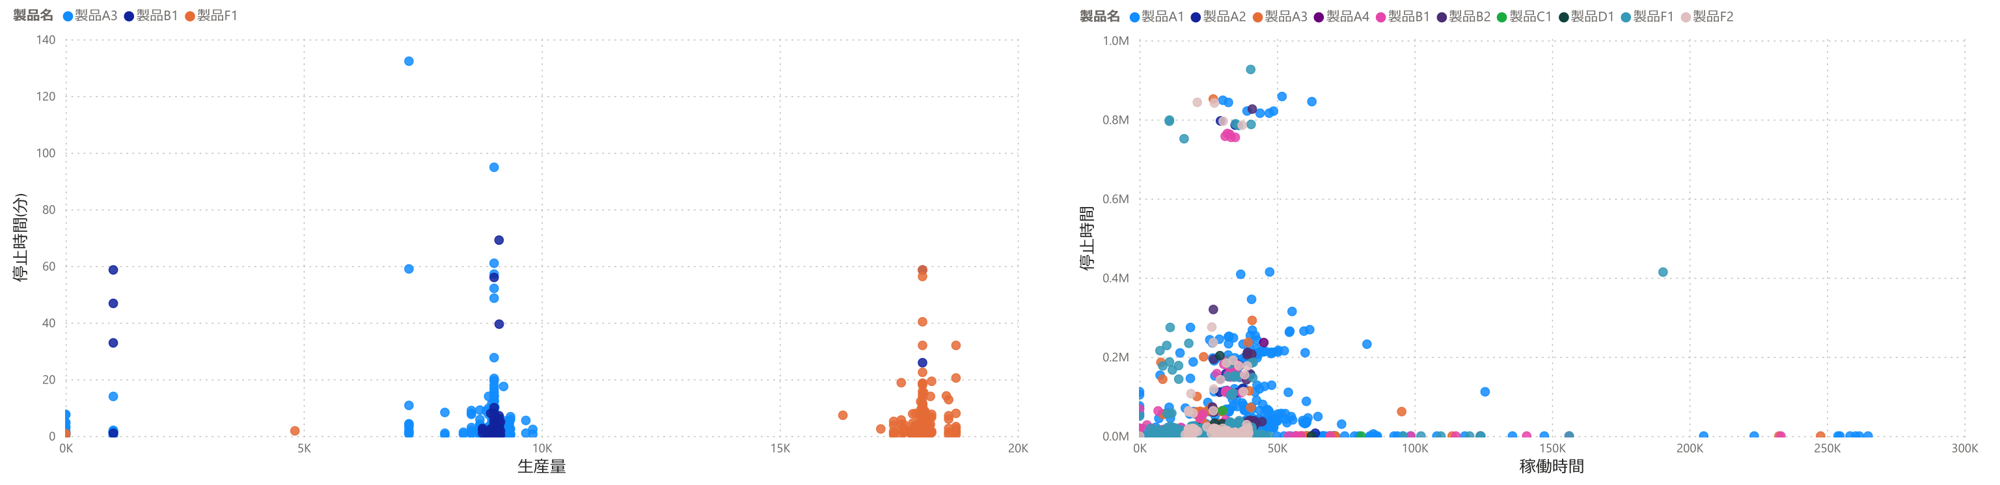
6. Correlation analysis between downtime and production volume or operation time
By checking the correlation between downtime and production volume and operation time, you can identify instruction numbers, production time periods, products, etc. that are causing abnormally long downtimes and take measures to address them.
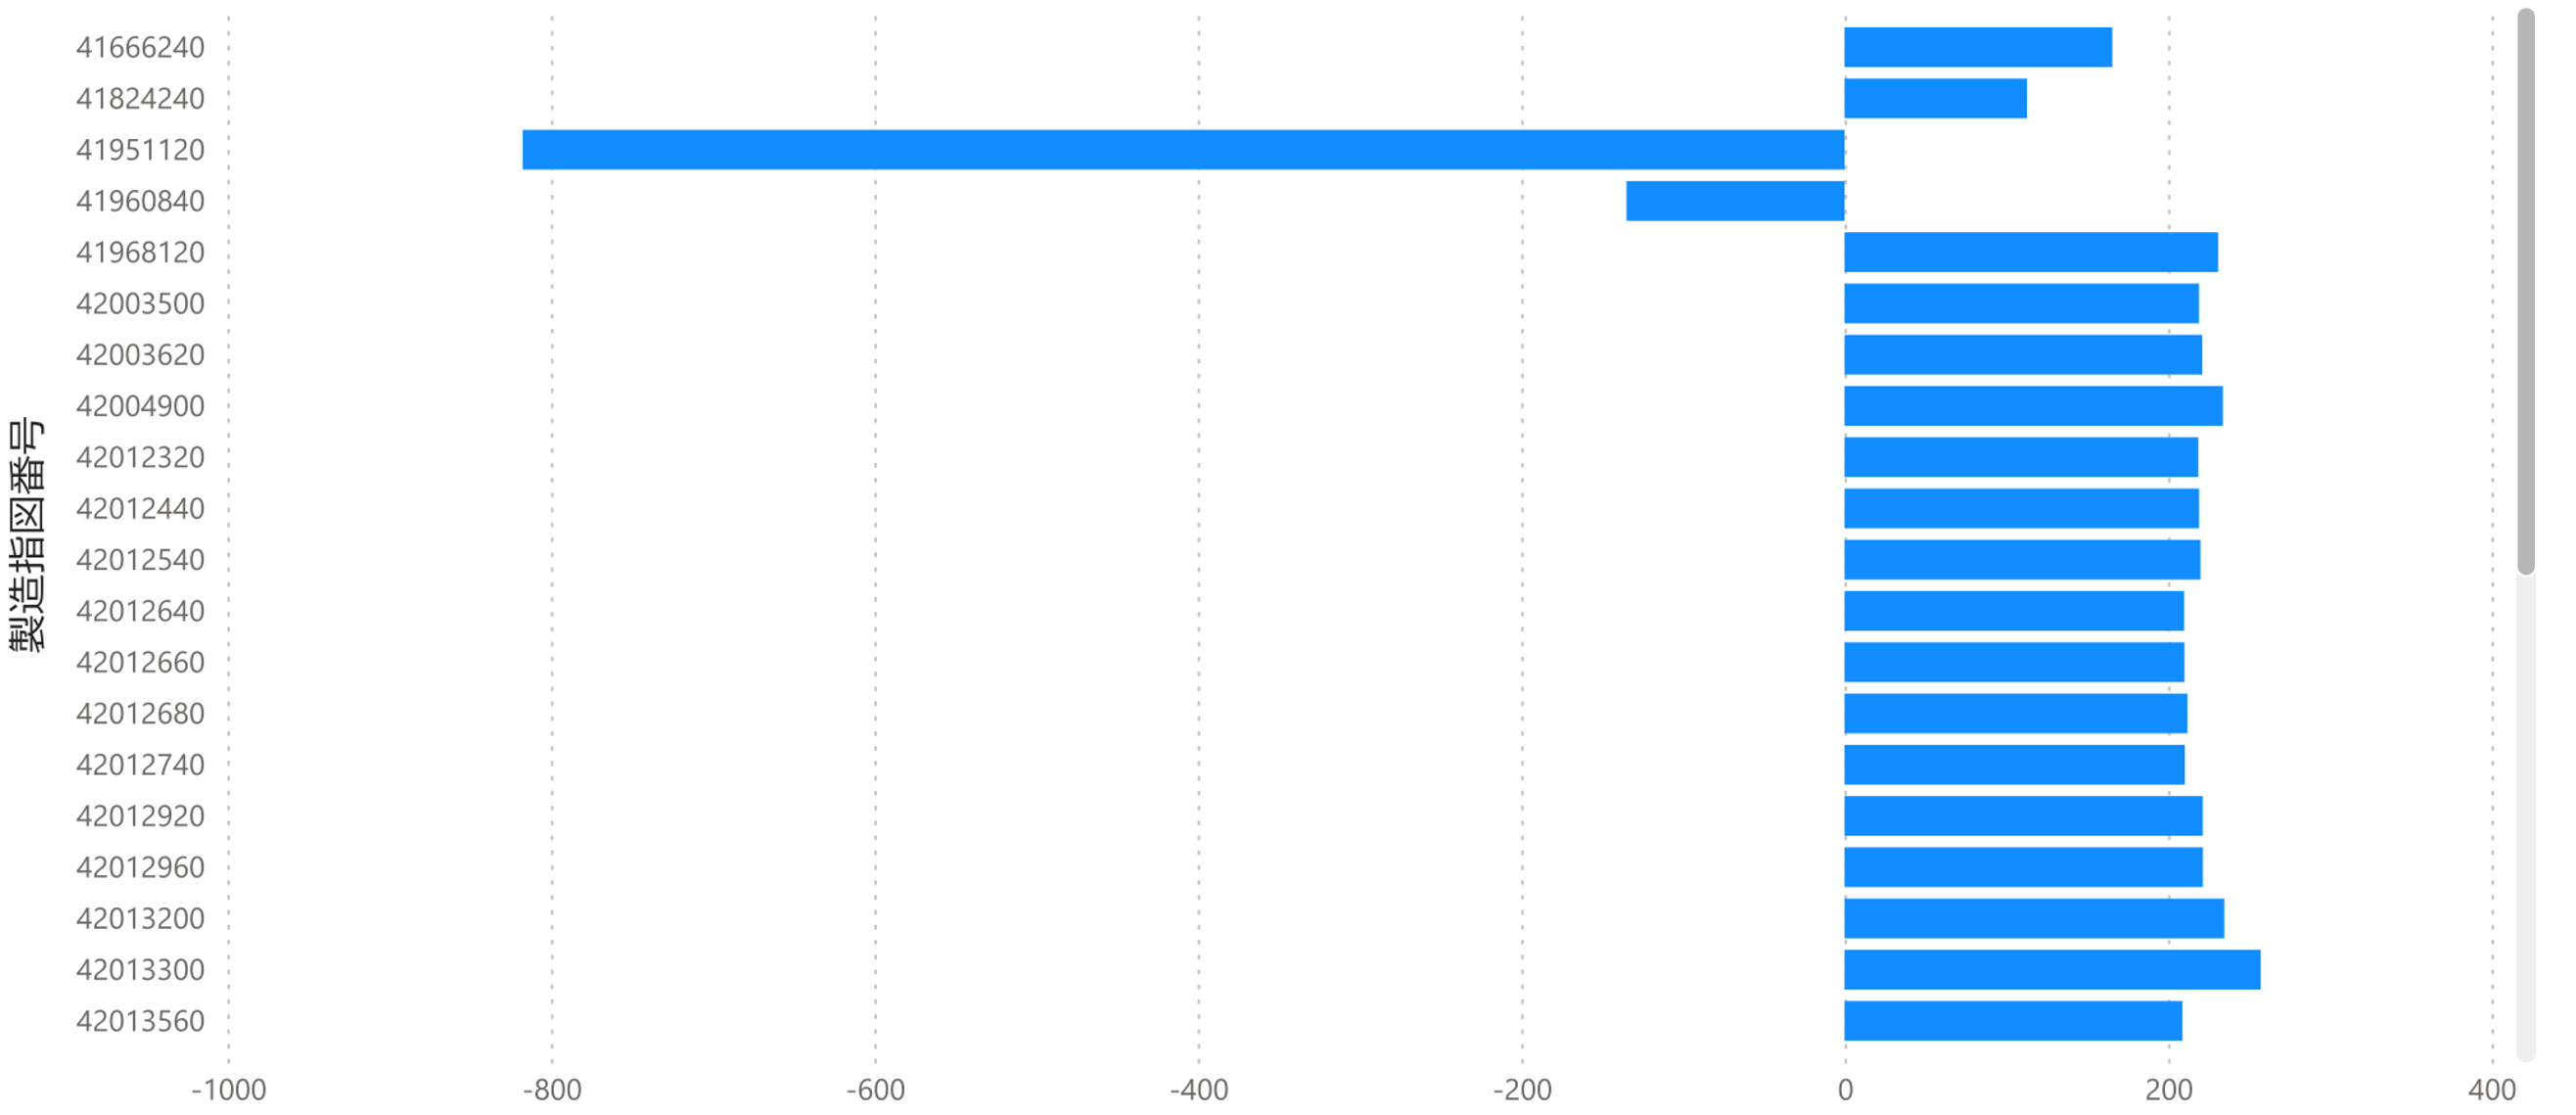
7. Analysis of the difference between production plan time and actual time
By analyzing the difference between planned and actual production time, you can identify where the production deviation is occurring. If there is a significant deviation from the plan, the plan itself needs to be revised.
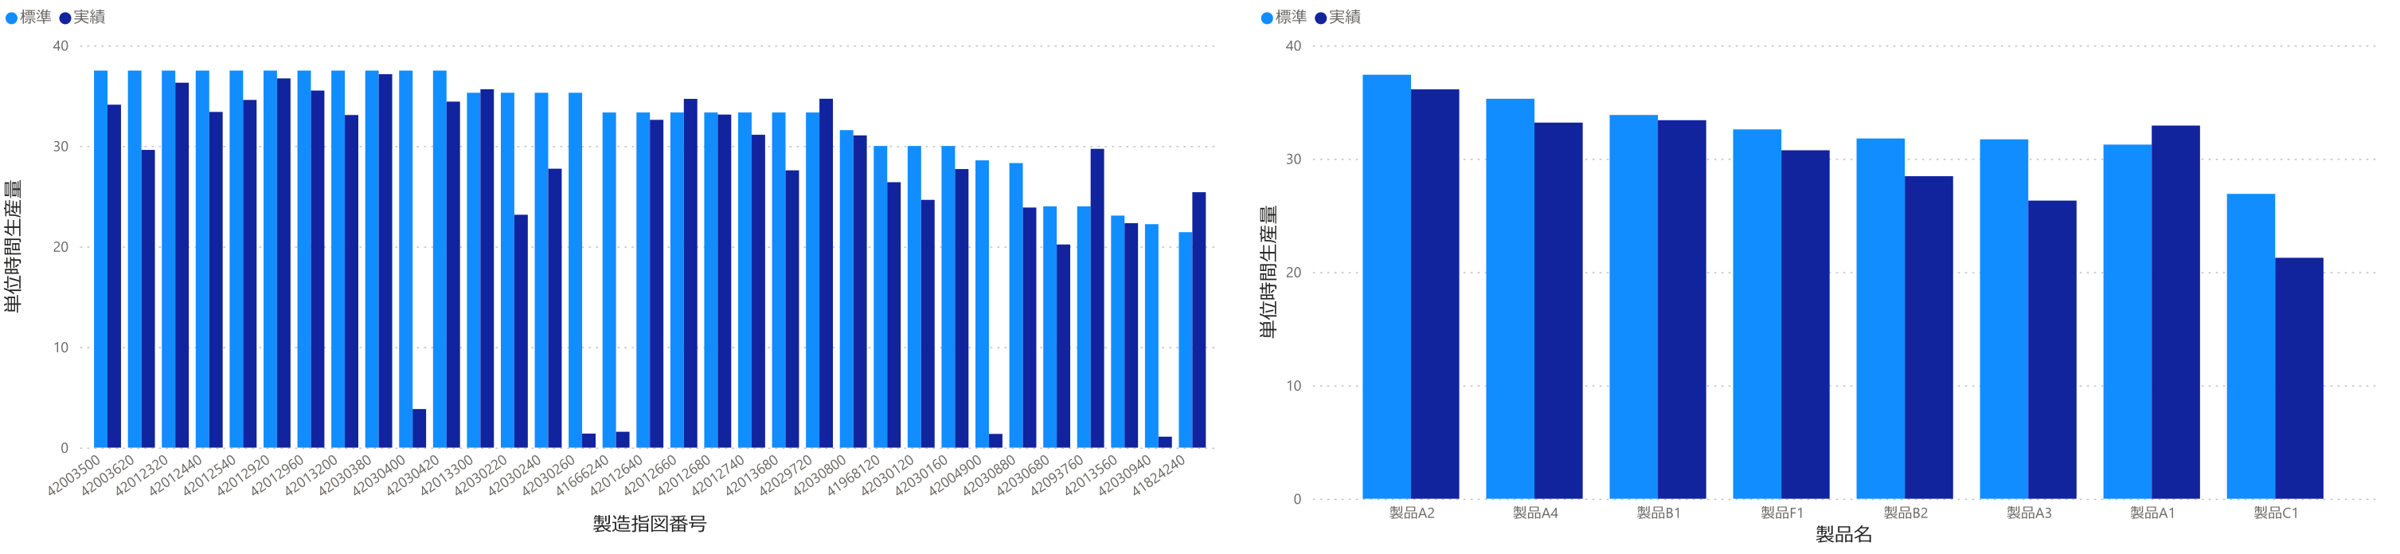
8.Comparison of actual results with standard production capacity
Production efficiency is measured by comparing the production volume per unit time set for each line with the actual results. This makes it possible to identify areas where maintenance activities or review of standard times is required.
Summary: Going beyond visualization to achieve data-driven Kaizen
"Visualization" of the manufacturing site is the starting point of Kaizen. However, if visualization alone is the end, essential improvements will not be achieved. By utilizing DSF Cyclone, equipment data, production instructions, quality data, etc. can be normalized based on visualized data, enabling detailed analysis while overlooking the entire site.
As a result, you can go beyond simply improving your equipment to optimize your production plans, reduce defects, and promote consistent improvement activities aimed at improving the efficiency of your entire manufacturing process. With AI technology and automation in mind, the future of the workplace is expanding even further. DSF Cyclone will bring innovation to your production site.