- Semiconductor BusinessHOME
- Products and Services of Macnica,Inc.
-
technical information

-
Events and Seminars
- Handling Manufacturer
- Support
- Inquiry
- Click here to purchase products
- Semiconductor business e-mail magazine registration
![]()
![]() Narrow down by specifying conditions
Narrow down by specifying conditions
現在2161件がヒットしています。check

This is an updated version of the old title "DS-5 Utilization Techniques - Tips for Setting Breakpoints".
Arm® Development Studio for Intel® SoC FPGA Edition (Arm® DS ) has been changed to Arm® DS is the successor to DS-5, and usability does not change significantly. Most of the content in this series of articles can be applied to both Arm® DS / DS-5, but where there are differences, we have updated them to that effect.
***
This article provides supplementary information on how to use Arm® DS / DS-5, which can be used as a software integrated development environment for Intel® SoC FPGAs.
This time, I will introduce the types of "breakpoints" that are almost always used when debugging software, their differences, and how to actually use them. This article covers only the basics, so please refer to the Arm® DS / DS-5 manual for details on how to use the debugger.
Arm® Development Studio documentation page (Arm® Developer site)
DS-5 Documentation Page (Arm® Developer Site)
Arm® DS / DS-5 breakpoint function
Breakpoint type
There are generally two types of breakpoints: hardware (HW) breakpoints and software (SW) breakpoints. Arm® DS / DS-5 also has HW breakpoints and SW breakpoints. It is possible to separate the points.
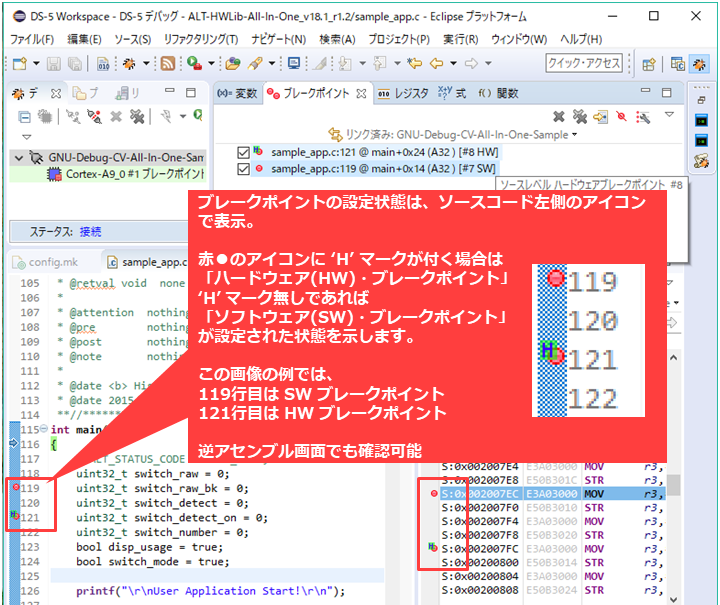
The icon shown in Figure 1 makes it possible to distinguish whether the currently set breakpoint is HW or SW. Alternatively, you can check it by displaying a dedicated screen (breakpoint view).
*For Arm® DS, the breakpoint view is not displayed on the standard screen layout. Add it from the menu "Window → Show View → Breakpoint" at the top of the Arm® DS screen.
How to specify breakpoints
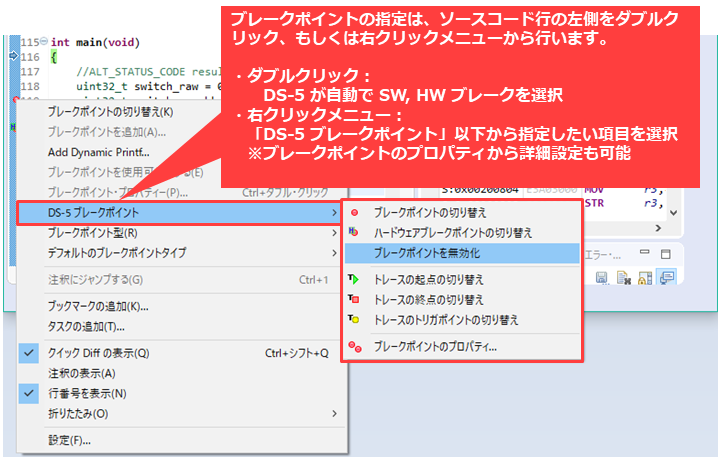
Figure 2 shows how to specify breakpoints. Basically, click the left side of the source code (or the left side of the disassemble screen). If you want to check and change the specified breakpoints all at once, we recommend using the breakpoint view in Figure 3.
*When setting a breakpoint from the right-click menu, the name of the menu differs between Arm® DS and DS-5. For Arm® DS, select the item you want to specify from below "DS Breakpoint".
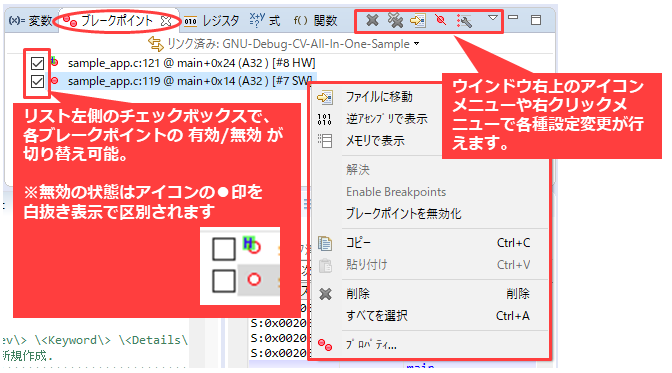
Among the operation menus in the Breakpoints view, "Disable Breakpoint" and "Go to File" are particularly useful and recommended.
"Disable breakpoints" can temporarily disable registered breakpoints simply by switching ON/OFF the check Box on the left side of the list. While disabled, the CPU does not break even if breakpoint processing is executed.
In addition, the "Go to file" menu allows you to display the relevant line of the source code registered as a breakpoint at once, which is useful when debugging complicated programs.
There are other useful functions, so please check them by actually operating the debugger. (You can also specify complex break conditions by changing breakpoint properties.)
Difference between HW break and SW break
The table below summarizes the differences and features of HW breaks and SW breaks.
| type | feature | Configurable number |
| Hardware break |
|
6 |
| SW break |
|
Unlimited |
The biggest difference between HW break and SW break is whether or not the program is rewritten.
SW breakpoints involve rewriting the program. Therefore, it cannot handle cases where the program is reloaded during debugging, or cases where the program memory around the breakpoint is destroyed due to a bug. In addition, it cannot be used in systems that cannot rewrite the program area, such as the memory protection function and direct execution of programs on Flash (XIP).
HW breakpoints do not involve rewriting the program, so there are no restrictions like SW breakpoints.
HW breakpoints are functionally better, but there is an upper limit to the number of breakpoints that can be registered. Therefore, when there are many breakpoints to be registered, both SW break and HW break are used.
Examples of using breakpoints
Below are two examples of useful ways to use breakpoints.
Use case 1: Capture the moment an exception occurs
Setting breakpoints on interrupt vectors in preparation for the occurrence of abnormal exception interrupts such as resets and aborts is extremely useful when investigating where problems occur.
As a result of abnormal software operation, read/write access to an illegal address may occur and an exception interrupt such as a data abort may occur. You can catch the moment when an exception occurs.
By also using the trace function introduced in the article below, you can go back and check the processing that the software performed immediately before the exception occurred.
Reference: Arm DS Utilization Techniques - How to use the trace function
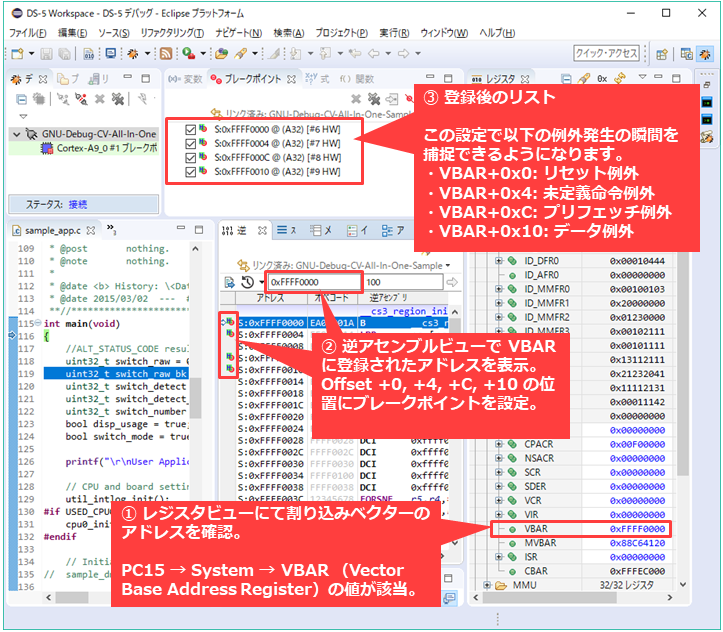
Figure 4 shows how to set a breakpoint on an interrupt vector.
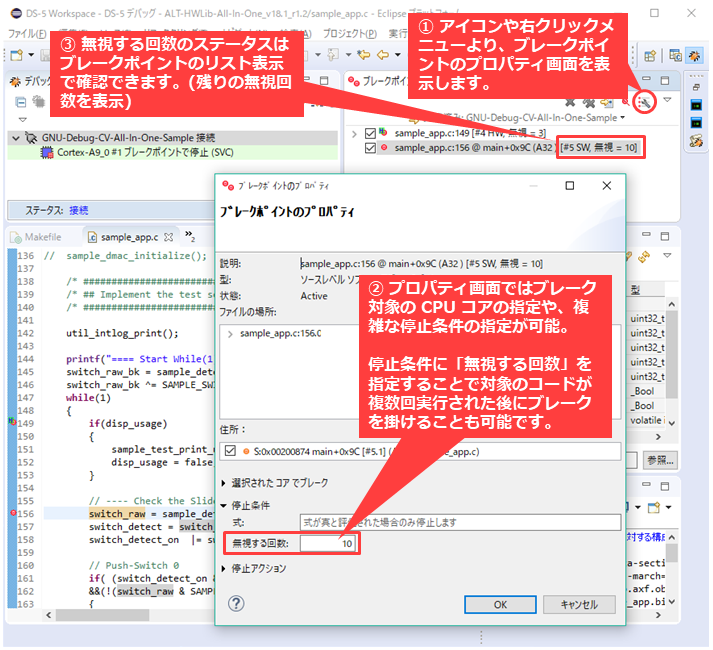
Use case 2: Specifying break conditions
The breakpoint function of Arm® DS/DS-5 allows you to set a break condition in addition to breaking unconditionally when the code at the specified location is executed.
For example, it is useful when you want to debug behavior after a process has been executed 100 times. Specifically, if 99 is specified for the "Ignore times" of the breakpoint stop condition, the break will occur at the 100th time.
It is also possible to create complex conditions by giving conditional expressions other than the number of times, so we recommend that you try each setting once.
Figure 5 shows how to specify break conditions.
In this article, we have introduced how to use the breakpoint function. Breakpoints themselves are a common function of a debugger, but Arm® DS / DS-5 has many useful functions such as specifying complex break conditions. We hope that these functions can be used to improve the efficiency of software verification work and defect investigations.
Click here for recommended articles/materials
List of articles on Arm DS utilization
SoC FPGA related articles and resources
Intel® FPGA SoC FPGA
Intel® FPGA Development Flow/FPGA Top Page
Click here for recommended FAQ
Click here for recommended seminars/workshops
Intel® SoC FPGA Seminar in a Box: Master SoC FPGA design flow at your desk