- 半導体事業HOME
- マクニカの製品・サービス
-
技術情報

-
イベント・セミナー
- 取扱メーカー
- サポート
- お問い合わせ
- 製品購入はこちら
- 半導体事業のメルマガ登録
![]()
![]() 条件を指定して絞り込む
条件を指定して絞り込む
現在2183件がヒットしています。check

『クロストーク入門』 では、クロストークは近端クロストークと遠端クロストークの 2 種類があると述べました。まず、最初に近端クロストークについて見てみましょう。
ドライバの駆動能力が大きいと、ドライバ出力の立ち上がりの最初の振幅は大きくなります。近端クロストークは、おおまかにいえば、この加害者のドライバの最初の振幅に比例します。この振幅は、『ダンピング抵抗の値ってどのように決めるの?』 の図2 の遠端の最初の振幅(青線)の半分です。
例えば、特性インピーダンスが 50 Ω で、ドライバの駆動能力が 8 mA のとき遠端の最初の振幅は 1.2 となるので、ドライバの振幅は1.2 ÷ 2 = 0.6 となります(脚注1)。
ドライバの駆動能力を 16 mA とすると、最初の振幅は 1.5、したがって、近端のドライバの振幅は 1.5 ÷ 2 = 0.75 となります。0.75 と 0.6 とは 1.25 倍違うので、16 mA ドライバのときの近端クロストークの量は 8 mA ドライバのときより 25 % 増加することが分かります。
『ダンピング抵抗の値ってどのように決めるの?』 の図2 のオーバシュートは、x (特性インピーダンスを加味したドライバの駆動能力)に対して単調に増加するので、近端クロストークを抑えるためにはドライバの駆動能力を低くする必要があります。
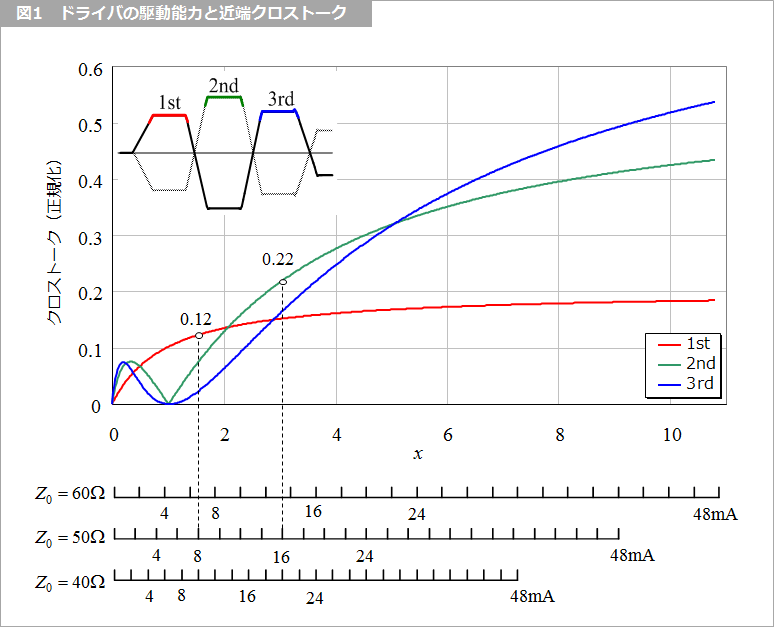
図1 は『ダンピング抵抗の値ってどのように決めるの?』 の図2 と同様に、横軸に特性インピーダンスを加味したドライバの駆動能力 x をとり、クロストークの最初のピーク、2番目のピークおよび 3番目のピークの振幅を示したものです(脚注1)。
x が小さいうちは最初のピークが優勢で、x が大きくなるにしたがい、ピークの最大値は 2番目、3番目に移ることが分かります。特性インピーダンスが 50 Ω のとき、ドライバの駆動能力が 8 mA のときはクロストークは最初のピークが最大で 0.12 ですが、16 mA では 2番目のピークが最大で 0.22 となって 8 mA のときの 1.8 倍にも増加します。ピークの最大値が 2番目や 3番目に移ると x に対する傾斜が大きくなるので、2番目に移る手前、すなわち x は 2 以下に抑えるとクロストークに対して有利になることが分かります。
オーバシュートを 20 % に抑える条件は、x = 1.5 だったので、オーバシュートによる跳ね返り対策は近端クロストーク対策にもなります。一般の信号に乗るクロストークなどのノイズは、クロックのタイミングを避けると、極端にいえば、いくら大きくても構いません。クロストークのピークの最大値が 1番目の場合には、次のクロックまで余裕があることが多く、2番目、3番目と後ろに移ると、次のクロックに近づくことを意味しますので、高速動作に対して不利になります。
したがって、ドライバの駆動能力が大きくなると、近端クロストークのピーク値が大きくなるだけではなくて、そのピークの最大値がより後ろに移り、次のクロックのタイミングと重なる可能性が高くなるという面もあわせて考えておく必要があります。
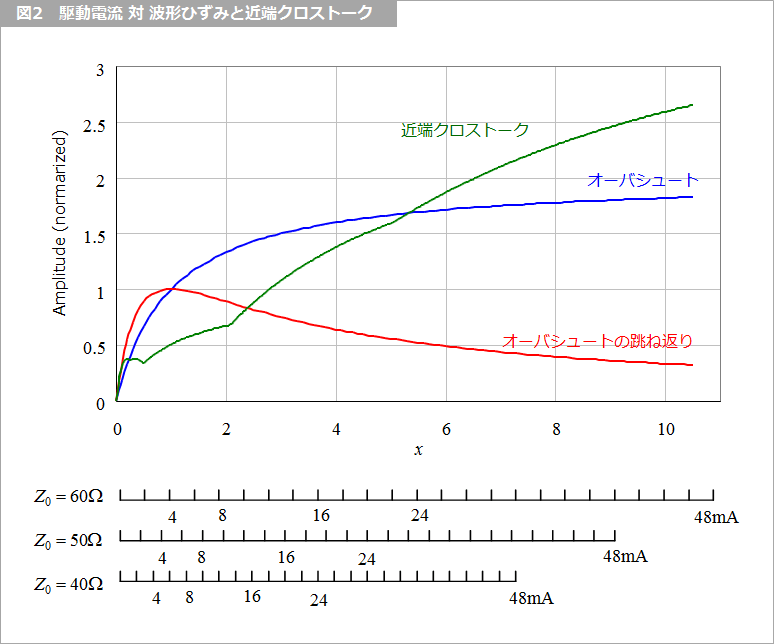
図2は、図1のピークの最大値(包絡線)と、『ダンピング抵抗の値ってどのように決めるの?』 の図2 とを重ねて示したものです。
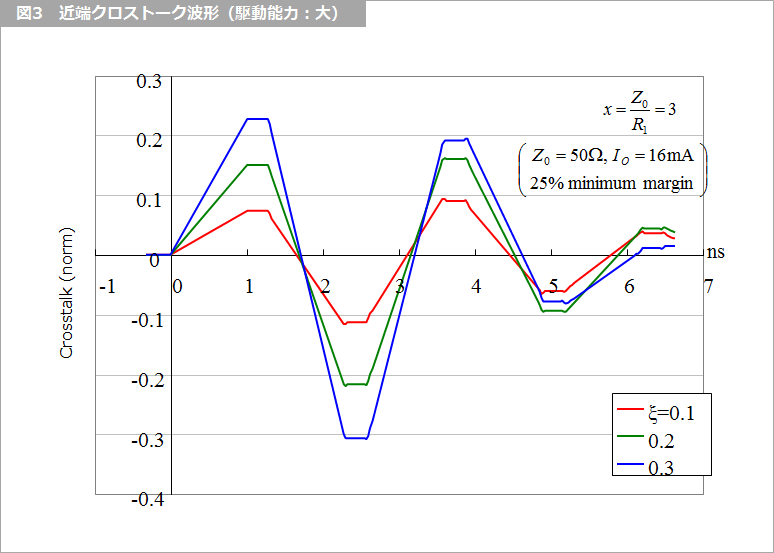
図3 はドライバの駆動能力が大きいときの近端クロストーク波形を示します。1番目のピーク値よりも 2番目のほうが大きいことが分かります。
同図で、ξ (ギリシャ文字小文字のクサイ)というパラメータが初めて登場しましたが、これは基礎クロストーク係数(脚注2)と言われるもので、これが大きいほどクロストークも大きくなります。ξ = 0.1 はクロストークがやや小さい線路で、ξ = 0.3 はやや大きい線路と考えればよいでしょう。
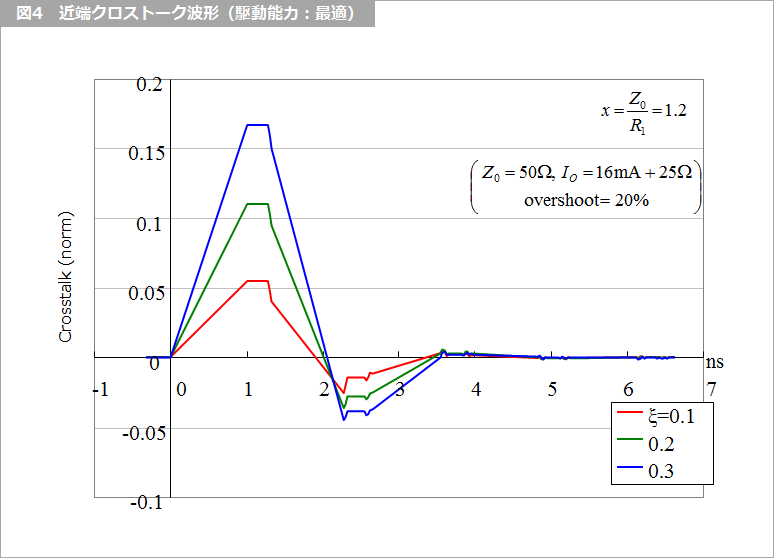
図4 はドライバのオーバシュートを 20 % に抑えた場合の近端クロストークを示します。伝送波形自体もオーバシュートの跳ね返りがほとんどなく(『ダンピング抵抗の値ってどのように決めるの?』 参照)、図に示したように、クロストークは最初の 1つの山だけで終わっています。伝送波形がきれいなときにはクロストークも抑制されていることが分かります。
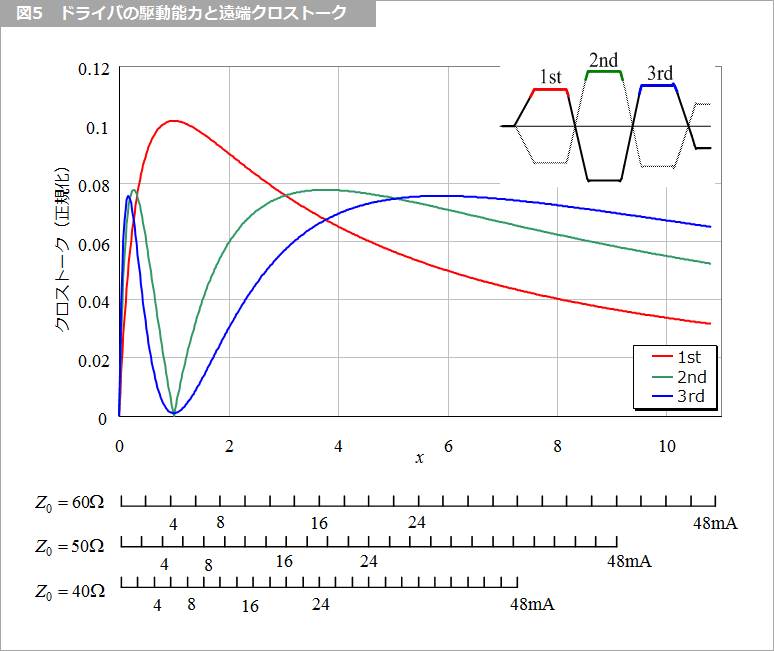
次に遠端クロストークについても図1 の近端クロストークと同様に、図5 にドライバの駆動能力に対してプロットしてみます。遠端クロストークの場合には、加害者のドライバの駆動能力が小さいと 1番目が大きく、大きく選ぶと 2番目と 3番目が増加する、といった具合に、近端クロストークのようには駆動能力に対する最適値が見つかりません。また、遠端クロストークは、前回述べたように加害者と被害者とを分けて離す場合にも全ての線間を離す必要があります。遠端クロストークはこのように単純な解決方法が見い出せないので厄介です。
脚注1
ここでの振幅は 1 に正規化しているので、3.3 V 系なら 3.3 倍します。ドライバの振幅が 0.6 とは、3.3 V 系では、0.6 × 3.3 = 1.98 V です。
脚注2
基礎クロストーク係数は、2 つの線路の容量的結合と誘導的結合との平均値として求められます。容量的結合とは線路間の静電容量と自身のグラウンドに対する静電容量との比で、誘導的結合とは線路間の相互インダクタンスと自身の自己インダクタンスとの比で表されます。
碓井有三のスペシャリストコラムとは?
基礎の基礎といったレベルから入って、いまさら聞けないようなテーマや初心者向けのテーマ、さらには少し高級なレベルまでを含め、できる限り分かりやすく噛み砕いて述べている連載コラムです。
もしかしたら、他にも気になるテーマがあるかも知れませんよ!