- Semiconductor BusinessHOME
- Products and Services of Macnica,Inc.
-
technical information

-
Events and Seminars
- Handling Manufacturer
- Support
- Inquiry
- Click here to purchase products
- Semiconductor business e-mail magazine registration
![]()
![]() Narrow down by specifying conditions
Narrow down by specifying conditions
現在2161件がヒットしています。check

This is an updated version of the old title "DS-5 Utilization Technique - Connect to a Running Target".
Arm® Development Studio for Intel® SoC FPGA Edition (Arm® DS ) has been changed to Arm® DS is the successor to DS-5, and usability does not change significantly. Most of the content in this series of articles can be applied to both Arm® DS / DS-5, but where there are differences, we have updated them to that effect.
***
This article provides supplementary information on how to use Arm® DS / DS-5, which can be used as a software integrated development environment for Intel® SoC FPGAs.
This time, I will introduce how to connect (attach) Arm® DS / DS-5 to the running target environment later. This method does not download the debug target software from Arm® DS / DS-5, so if a problem occurs in the target environment of autonomous boot from SD card or Flash ROM, the state of the software at the time of failure is helpful in verifying
Note that this article only describes how to set up the debugger connection. For debugging work after connection and how to use the debugger, refer to the Arm® DS / DS-5 manual.
Arm® Development Studio documentation page (Arm® Developer site)
DS-5™ Documentation Page (Arm® Developer Site)
debug configuration
When using Arm® DS / DS-5 only with attachment (connection), select "connection only" in the run control option of the debugger tab of the debug configuration (debug configuration). Basically, you can attach only with this selection. In addition, if you want to display the source code associated with the running program on the debugger, additional settings are required.
Figures 1 to 3 below show examples of actual debug configuration settings. (The setting for Cyclone® V SoC Preloader is used as an example.)
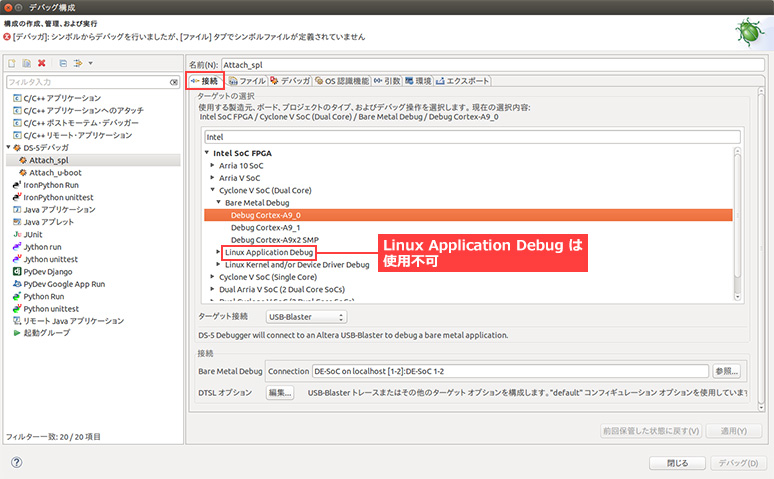
connection tab
The connection settings are the same as the normal debugging procedure of downloading and running software from the debugger. Linux® Application Debug is disabled due to Ethernet (RSE) connection, not JTAG.
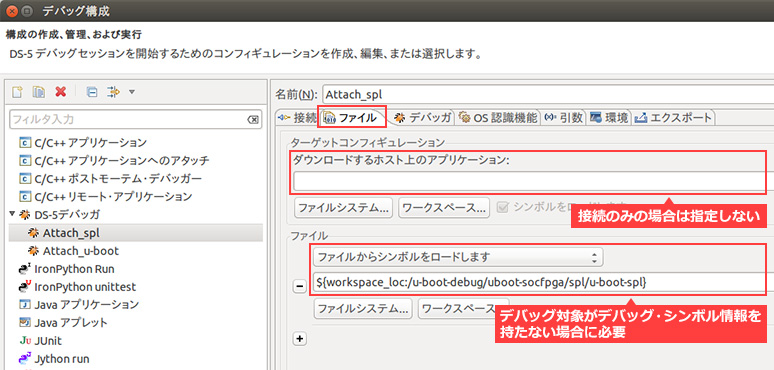
File tab
For connection only, do not specify the download target. This is necessary when the debug target does not have debug symbol information, such as binarized software. Specify the application before binarization (optional) if you want to debug while referring to the symbol information of functions, variables, etc., associating with the source code.
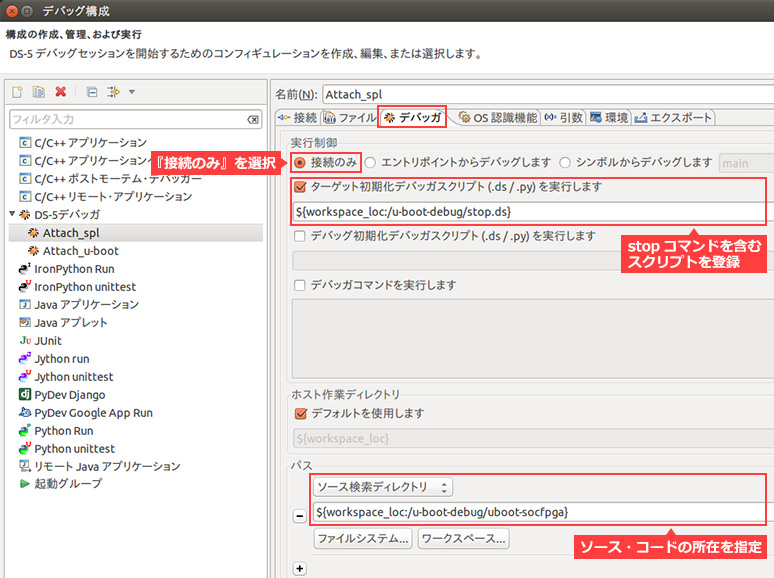
Debugger tab
Select "Connect Only".
Register a script containing a stop command (Optional) If you specify to load symbols on the Files tab, you must stop the program before it fails to load the symbols. Specify the location of the source code (optional) Necessary for associating the execution instruction with the source code.
Example script with stop command
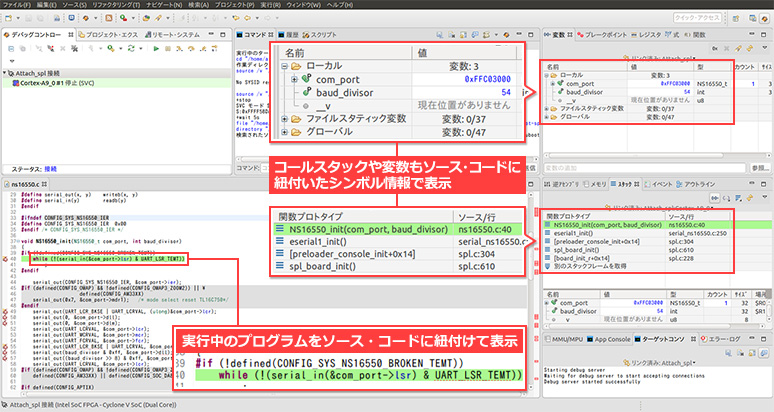
Image of starting debugging and completing connection
After that, just start debugging with the debug configuration in the setting example.
Figure 4 shows the screen when the connection is complete. The source code associated with the running program is displayed, and symbolic debugging at the source code level can be performed.
Call stacks and variables are also displayed with symbol information associated with the source code.
Click here for recommended articles/materials
List of articles on Arm DS utilization
SoC FPGA related articles and resources
Intel® FPGA SoC FPGA
Intel® FPGA Development Flow/FPGA Top Page