- コネクティビティ事業 HOME
- サービス・
ソリューション -
イベント・
セミナー
-
事例・コラム・
ブログ
- お問い合わせ
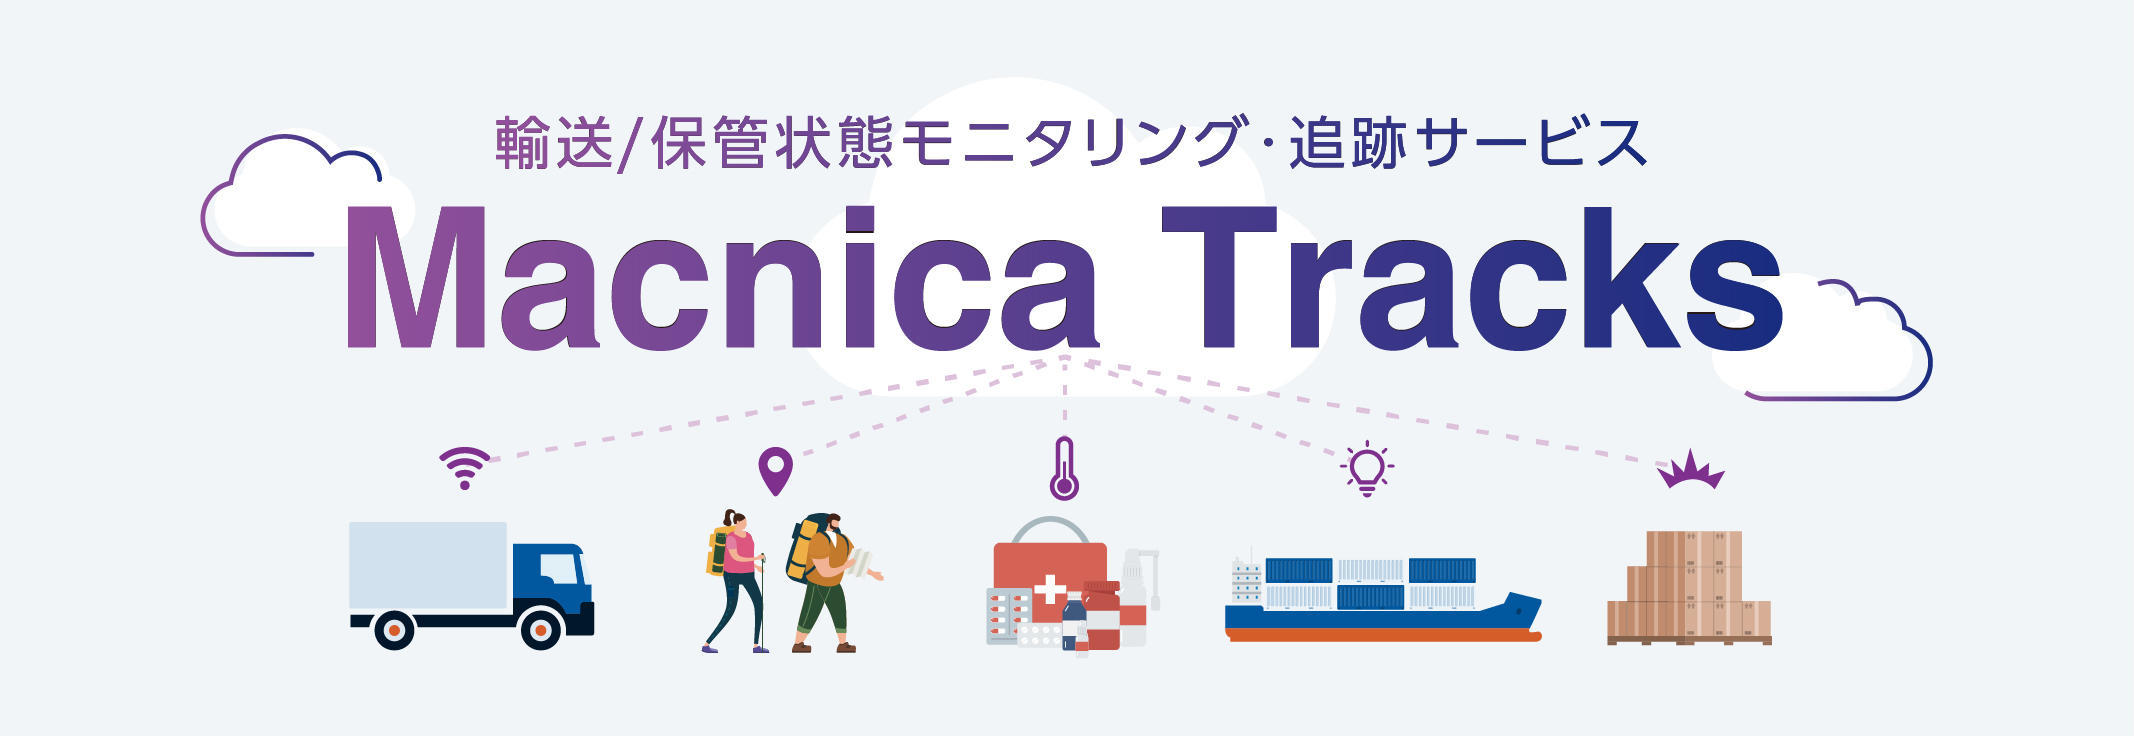
輸送・保管時の品質管理が求められる分野において、モノの状態をモニタリング! 簡単導入できるソリューション
Macnica Tracks®はモニタリング端末で取得した位置情報やセンサー情報を可視化し、簡単に管理できるマクニカのクラウドサービスです。
発送地から目的地までの状況を可視化することで、商品の遅延や温度変化による”腐敗のリスク”、”落下”や”衝撃”、”改ざん”、”置き忘れ”、”盗難”などに対し、リアルタイムの対処が可能になります。
下記、Qualcomm® の QTS110を使って、移動する荷物の位置情報や状態監視をダッシュボードでリアルタイムにモニタリングする様子をご覧いただけます。
Macnica Tracks®の主な機能

情報の可視化
ダッシュボード上では、温度・湿度・気圧・照度・傾斜データをグラフで確認できます。
また、マップ上では位置マークが表示され、移動経路が分かります。
カーソルを位置マークに合わせれば、その地点でのセンサー情報と取得日時を見ることもできます。

配送状況可視化・到着予測機能
配送工程におけるポイント地点を登録すると、位置情報から配送工程の内どのステップにいるのか出荷ステータスを割り出し、目的地に到着した時点でメール通知します。
また、配送状況から目的地への到着時間を予測する機能も備わっています。

柔軟なアカウント権限
お客様のテナント配下にアカウントを複数作成することができます。
アクセス権限等はアカウント毎にテナント管理者(=お客様)が設定変更することが可能です。

監査証跡対応
本クラウドサービスではユーザーが設定等を新規作成・変更・削除した履歴を記録します。
4段階のアラート通知設定機能
温度・湿度・気圧・照度に関して、アラート閾値を4段階(上限/下限アラート・上限/下限ワーニング)で設定可能です。
このアラート機能を活用すれば、異常が起こる前段階を検知してトラブルを未然に防ぐこともできます。

API連携
APIに対応しているので、お客様がお使いのシステムにデータを取り込むことも可能です。
ダッシュボード
ダッシュボード上では、温度・湿度・気圧・照度・衝撃データをグラフで確認できます。また、マップ上では位置マークが表示され、どのような経路を通ってモニタリング端末が移動したのか表示されます。カーソルを位置マークに合わせれば、その地点でのセンサー情報も見ることができます。
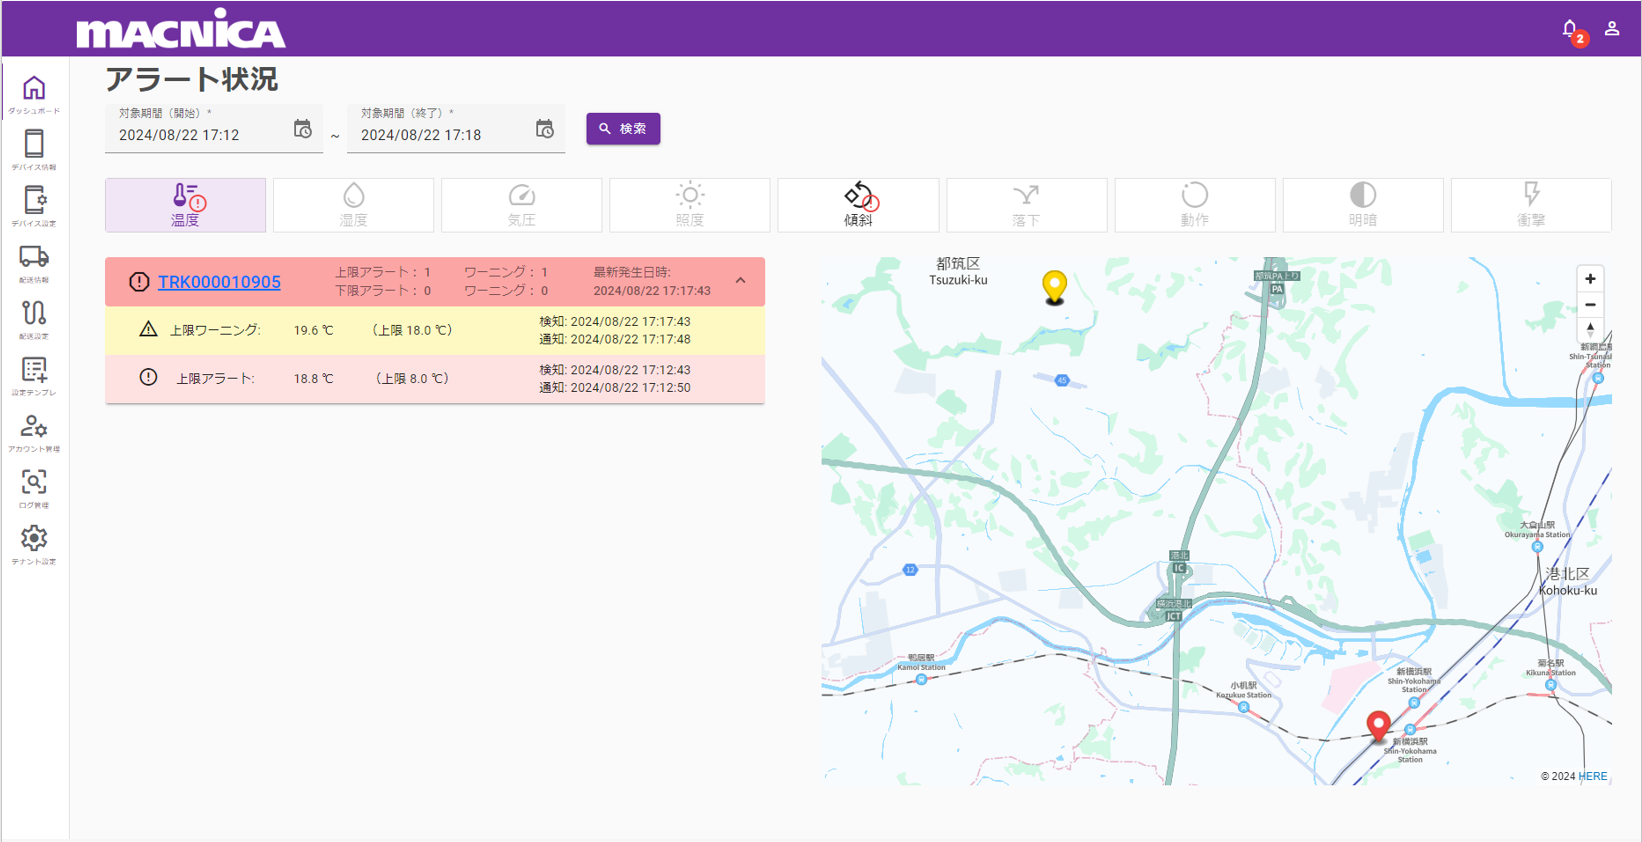
図2(例)アラート状況
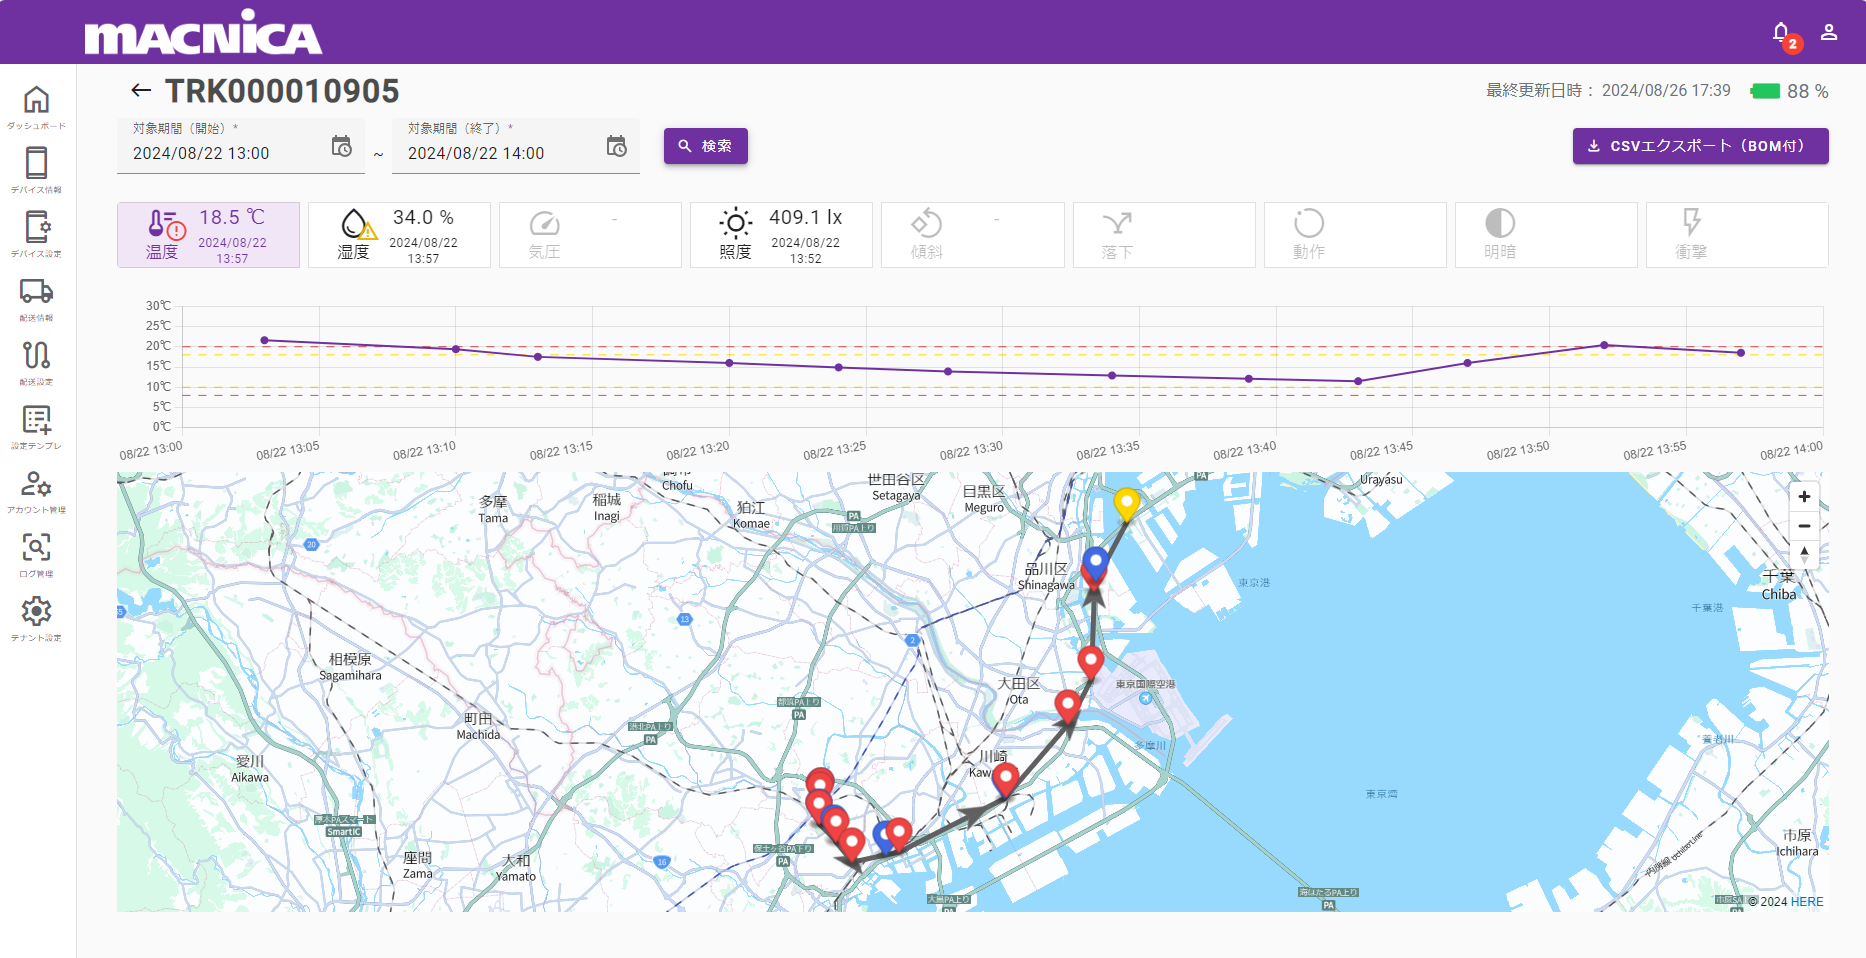
図3(例)位置情報と各種グラフ
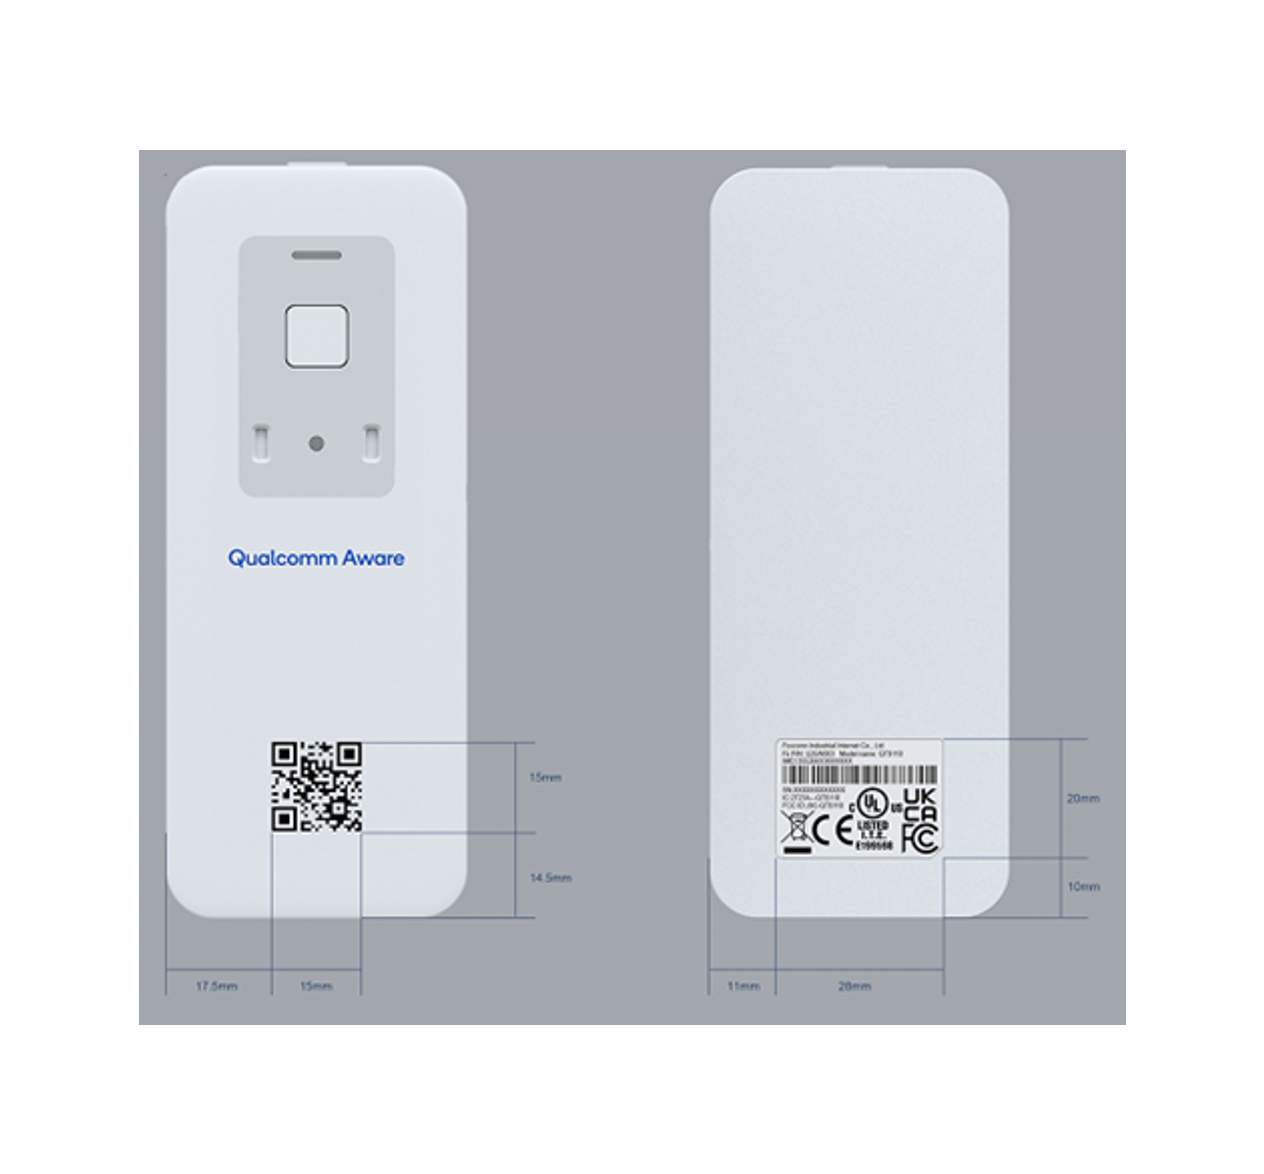
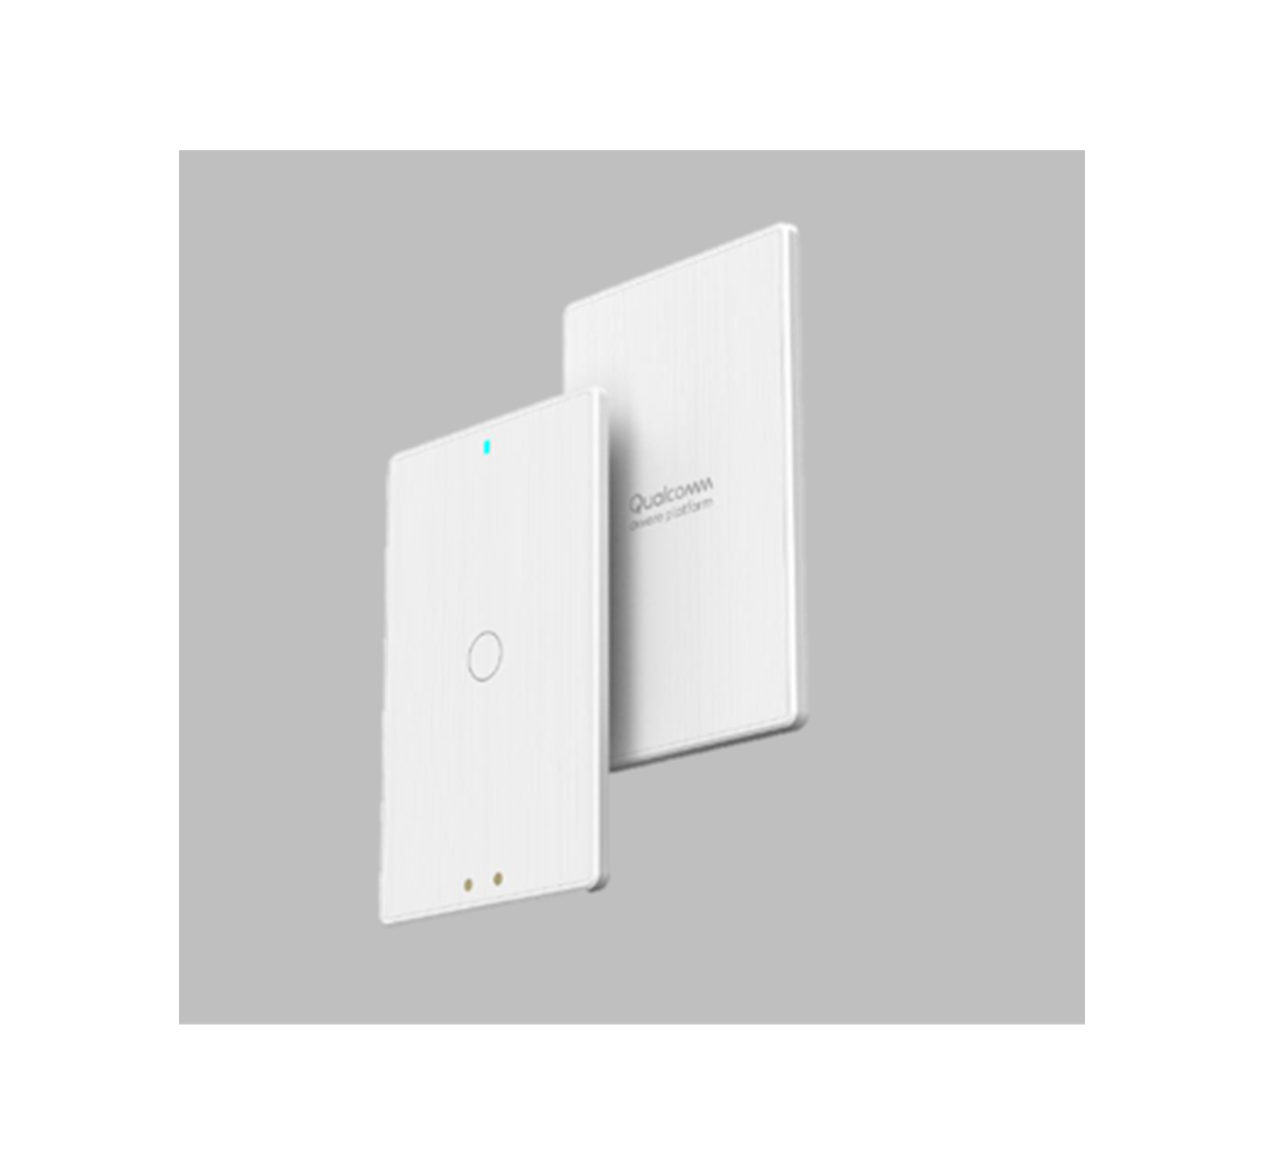
「モニタリング端末」製品ラインナップ
モニタリング端末はQualcomm社のQTSシリーズ(QTS110,QTS112)をラインナップに持ち、この端末で得た各種情報はLTE通信で、Qualcomm Aware Platformを経由しマクニカが所有するクラウドに集約され、お客様はマクニカ専用ダッシュボードから閲覧・管理することができます。
資料ダウンロード
本システム (輸送/保管状態モニタリング・追跡サービス - Macnica Tracks®/ QTS110 / QTS112)に関する資料を
ダウンロードいただけます。
よくあるご質問(FAQ)
お問い合わせ / お見積もり
Macnica Tracks®に関するお問い合わせは、以下ボタンよりご用命ください。
運用コストに関しましても、端末料金並びに月額料金の設定を非常に導入しやすい価格に設定させていただいておりますので、まずはお見積りをご用命ください。
メーカー情報Topへ
メーカー情報Topページへ戻りたい方は以下をクリックください。