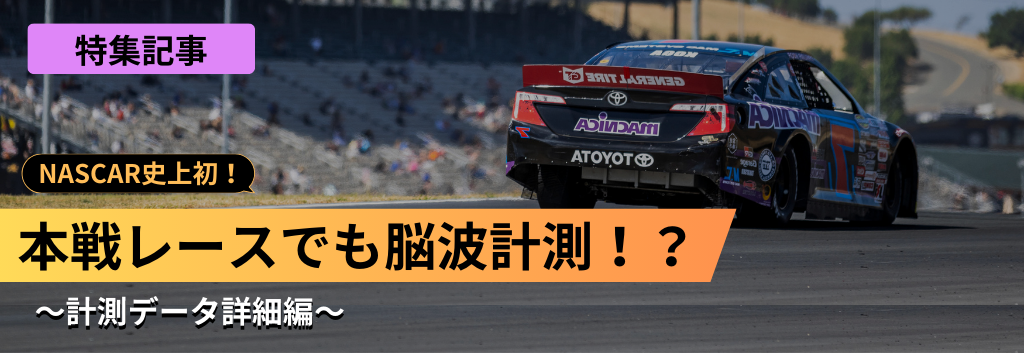
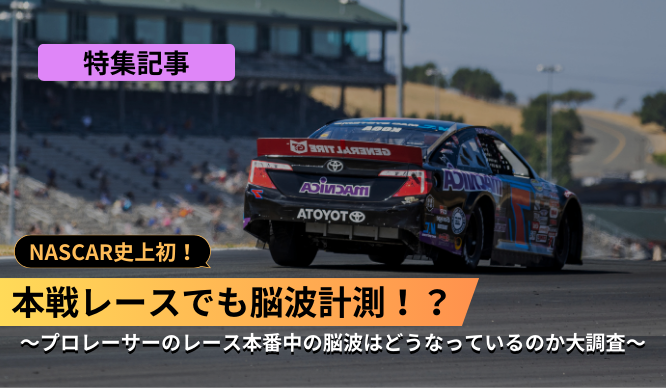
NASCAR史上初!本戦レースでも脳波計測!?~計測データ詳細編~
2024年6月7日にカルフォルニア州のソノマにて開催されたNASCAR Westシリーズ(https://www.arcaracing.com/arca-menards-series-west/)General Tire200てに、運転中のレーサーの脳波を計測してきた結果の記事になります。
本記事では、脳波データの詳細をお伝えします。

NASCAR史上初!本戦レースでも脳波計測!?~プロレーサーのレース本番中の脳波はどうなっているのか大調査~の記事で、レースのレポートをさせていただいておりますので、合わせてご覧ください。
脳波の計測結果
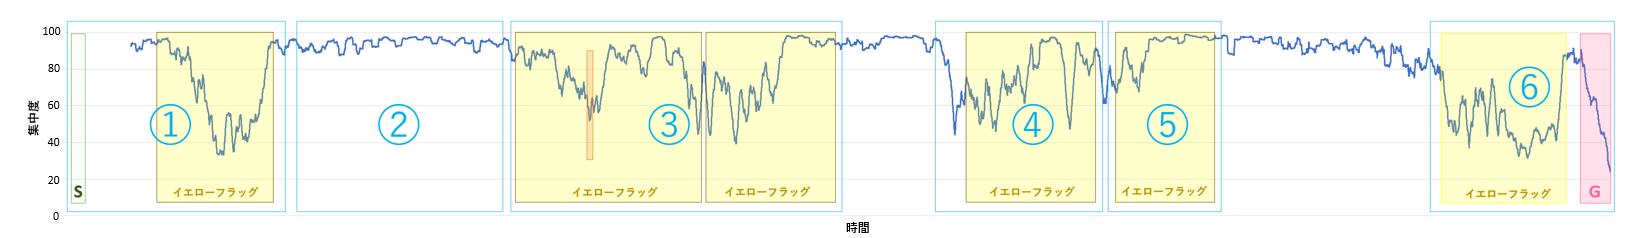
SONOMAでのレース本選中に取得した古賀選手の脳波から集中力をスコア化しました。
後日レース映像と古賀選手の記憶を照らし合わせたところ、下記結果が確認されました。
結果
- 高速でLapを重ねている時は、高い集中力が維持される傾向がありました。
- イエローフラッグが発生し、先導するセーフティカーの後ろを低速走行している時は集中力が低下し、イエローフラッグが解除されるタイミングで再スタートに向け集中力が上昇して行く傾向を見ることが出来ました。
以下、各ポイント①~⑥の詳細
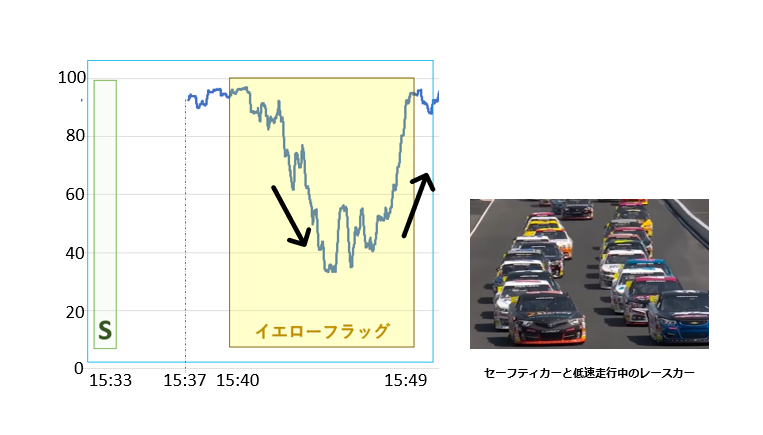
①ローリングスタート(15:33)直後、最初のイエローフラッグ(15:37~15:49)
レース開始直後(15:40)、Turn4付近のレーストラック上に#42の車両のサスペンション部品の落下によるイエローフラッグが発生しました。
この際先導するセーフティカーの後ろを低速走行している間、集中力の低下が見られました。
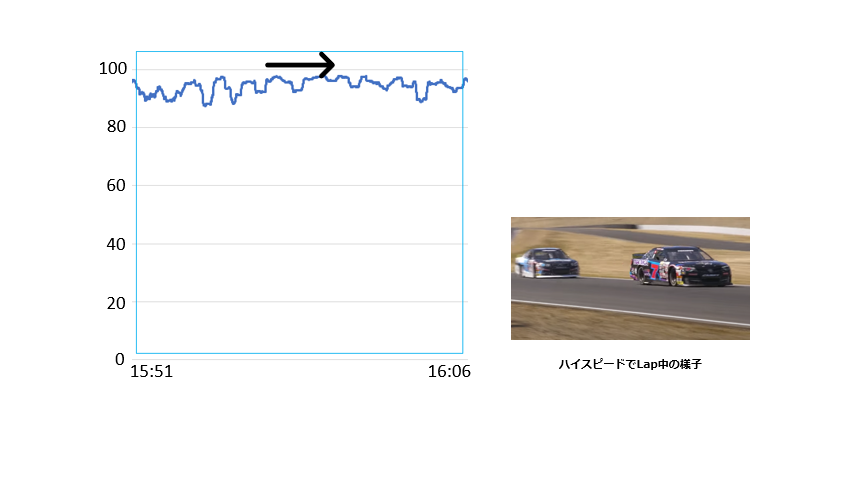
②通常走行している時間帯(15:51-16:06)
ハイスピードでLapを重ねている間は、高い集中力を維持していました。
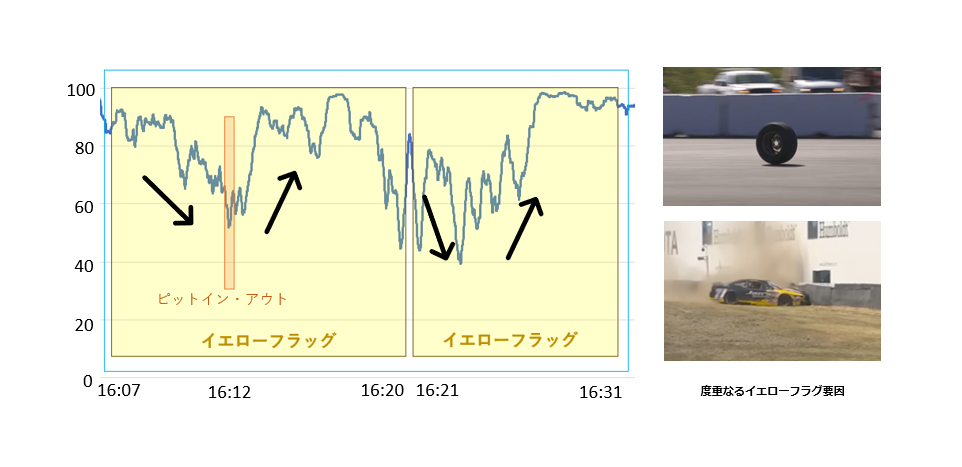
③度重なるイエローフラッグ(16:07~15:31)
16:07にTurn10でスピンした#71の車両がグラベルにコースアウトし、そのまま壁に追突するというアクシデントによりイエローフラッグが発生しました。
この際ギアオイルをまき散らしながらピットに戻っている様子を見て、イエローフラッグ解除までに時間がかかると判断した古賀選手はタイヤ交換を決断しました。
ここの集中力スコアを見るとピットインにむけスコアが低下し、ピットアウト後に再度上昇しているのが見て取れます。
16:20に約13分間のイエローフラッグが解除されたと思った矢先、1分後の16:21には別の#15車両のタイヤが外れ、Turn7のレーストラック上を転がるというアクシデントが発生し再度イエローフラッグが発生しました。
ここでは集中力が再び低下したのちに再上昇しているのが見て取れます。
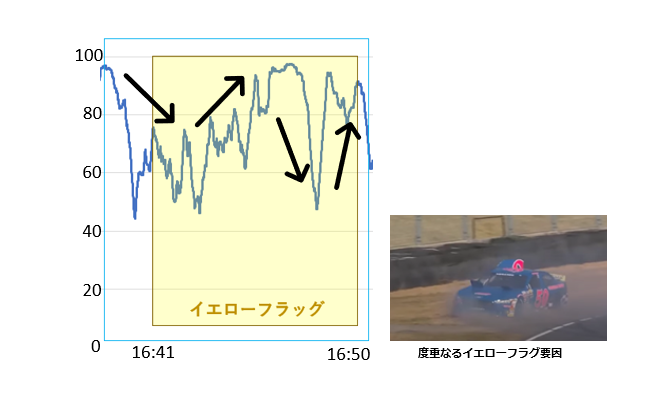
④4度目のイエローフラッグ(16:41~16:50)
Turn8で#32車両とインを取り合った#50車両がコースアウトし、そのまま壁に激突する事により本日4度目のイエローフラッグが発生しました。
途中Turn1の上り坂を登れなくなった#4車両のレッカー作業などもあり、約9分後の16:50にイエローフラッグが解除されるまで集中力は上下を繰り返しています。
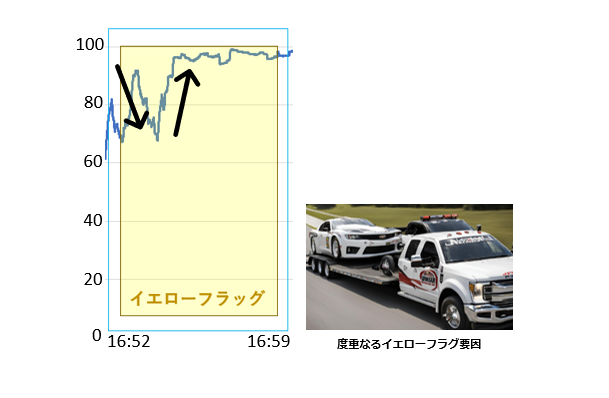
⑤5度目のイエローフラッグ(16:41~16:50)
#80車両がTurn7で制動不能となりセーフティークルーが回収しに行くというアクシデントが起こり、本日5度目のイエローフラッグが発生しました。
イエローフラッグ中に一度集中力が下がり、途中からはまた再上昇するという様子が分かります。
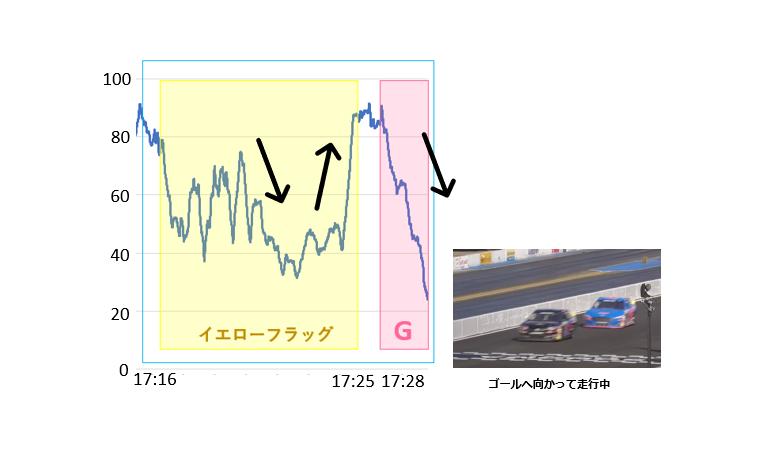
⑥最後のイエローフラッグ~ゴール(17:16~17:28)
#50車両のコースアウトによりイエローフラッグが発生しました。
約9分後の17:25にイエローフラッグ解除されると低下していた集中力が向上し、その後古賀選手の車両故障などトラブルを経てゴール。
ゴールに向かっていくにつれ集中力が下がっていく様子が見て取れました。
まとめ
弊社のチャレンジングなプロジェクトの一つであるNASCARレース中の古賀選手の脳波測定を行った結果、想定以上のデータを取ることが出来ました。
関係者全員が驚かされ、古賀選手自身も感覚と照らし合わせて結果の辻褄が合うことに驚き、更なるデータ活用に期待を寄せています。
今回の測定は実験成功の一歩と言えますが、得た学びを活かして更なるデータ取得と分析に向けて進んでいきたいと考えております。
無料デモンストレーション

脳波をベースにした「客観的なコンテンツ評価」とは?
脳波ベースにした人間の無意識下の感情、認知状態を可視化してみたい
不明なことが多いかと思いますので、まずは脳波を測定してどんなものか体験してみませんか?
実際に測定後、今までの私たちの活動でのAIの活用事例を交えながら、よりお客様の現場で脳波を使ったAIを活用していけるように
ご提案から、実装、運用までサポートさせていただきます。
資料ダウンロード
カタログ、ホワイトペーパーなどブレインテック関連の情報を記載しておりますので、詳細を知りたい方はこちらから資料をダウンロードしてください。
お問い合わせ
本記事に関してご質問などありましたら、以下よりお問い合わせください。
 最新情報
最新情報 導入事例
導入事例 ブログ
ブログ 資料一覧
資料一覧