product
Application for evaluation machine
Network visualization for white Box switches using SolarWinds

Introduction
In this article, we will explain how to efficiently monitor and manage a network using white Box switches using a representative commercial tool, SolarWinds.
This time, with the cooperation of Jupiter Technology Co., Ltd. (hereinafter referred to as Jupiter Technology), we built a SolarWinds verification environment and verified the operation of the white Box switch with the network OSs OcNOS and SONiC. This article covers the details of the verification of operation in combination with OcNOS.
Examples of visualizations on the SolarWinds dashboard include monitoring of traffic flow, resource status, and communication paths for white Box switches.
We touched on OcNOS in the fourth article, and visualization using Open Source Software (OSS) tools in the ninth and tenth articles, so be sure to check those out as well.
We have other articles related to Open Networking, so please check out the article that interests you from the list below.
Testing with Edgecore AS7326-56X and OcNOS
In the network visualization environment introduced here, we used Edgecore's AS7326-56X as a white Box switch and IP Infusion's OcNOS as the network OS.
As shown in the configuration diagram below, a set of tools necessary to achieve visualization has been installed on the Windows server.
Operators connect to the SolarWinds web console via a web browser such as Google Chrome. The Windows server periodically sends and receives data (such as SNMP messages) to and from the white Box switch, which is then stored in a database.
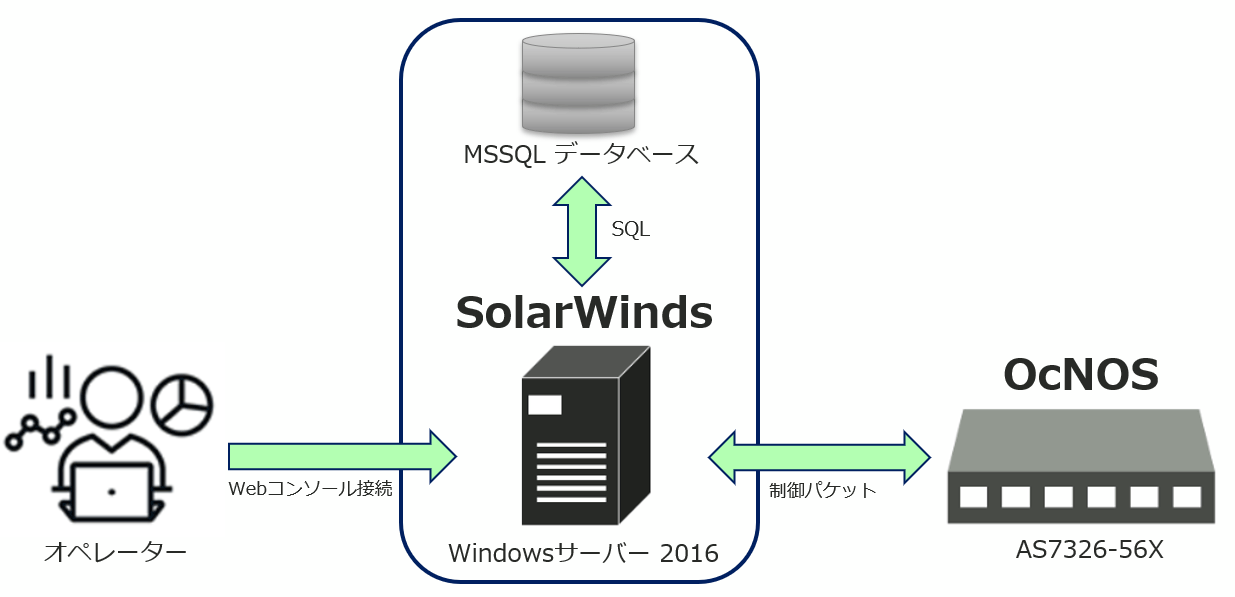
Figure 1: Verification environment
SolarWinds, the go-to tool for network monitoring
Developed by SolarWinds, Inc. in the United States, this is a commercial tool that enables centralized network monitoring and configuration management.
SolarWinds has a wide range of products including traffic analysis, network configuration management, and network performance/alive monitoring, and is easy to use and has a proven track record of being introduced in many locations around the world. It supports network equipment from multiple vendors, so it will work with white Box switches without any problems as long as they meet the functional requirements.
On the SolarWinds dashboard menu screen, functions (modules) are divided into three major categories as shown below.
Network Performance Monitor (NPM): It includes the resource status of CPU and memory usage of the equipment, the status of various interfaces, the monitoring function of the communication path, etc.
Network Configuration Manager (NCM): Contains functions that operate as a controller, such as changing device settings, regular backup of configuration, and updating firmware.
NetFlow Traffic Analyzer (NTA): Includes equipment traffic flow visualization, alert function, and data report generation.
Please take a look at the technical blog created by Jupiter Technology for information on changing the settings of the white Box switch using NCM and backing up the configuration.
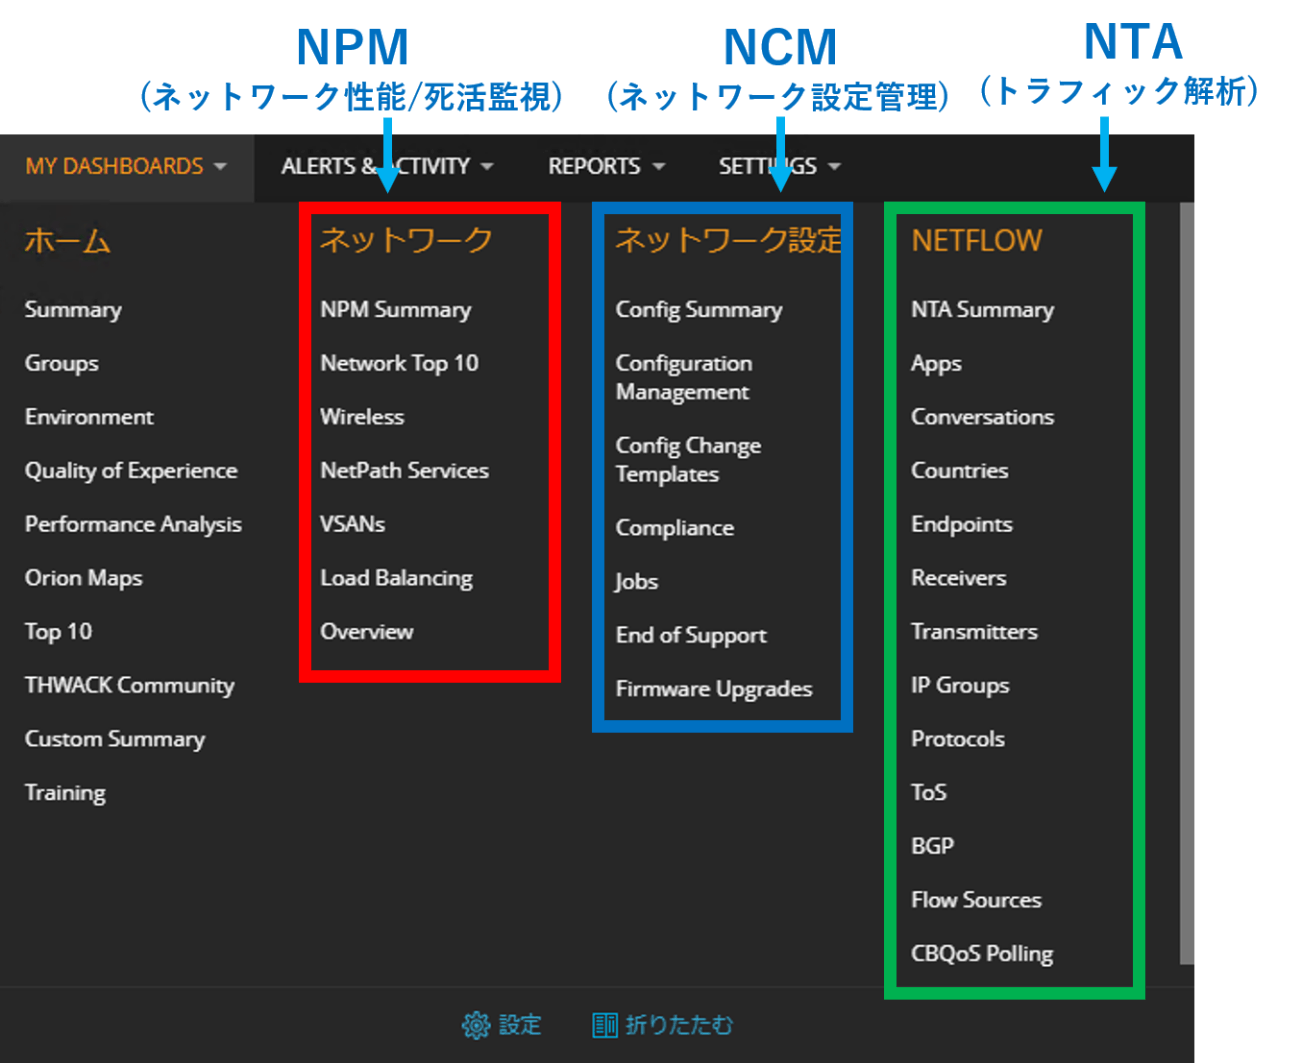
Figure 2: SolarWinds menu screen
Configuring SNMP/sFlow on OcNOS
Here are some examples of white Box switch settings required for network visualization. In order to visualize the traffic flow and resource status of the device, it is necessary to set the SNMP and sFlow agent functions in OcNOS as follows.
[SNMP] #configure terminal /* コンフィグレーションモードに移行 */ (config)#snmp-server view all .1 included vrf management /* SNMP サーバーからアクセス可能なデータの範囲を設定 */ (config)#snmp-server community test vrf managementt /* SNMP コミュニティ名の設定 */ (config)#snmp-server host 192.168.0.235 traps version 2c public udp-port 162 vrf management /* SNMP サーバーの設定 */ (config)#snmp-server enable snmp vrf management /* SNMP エージェントを有効化 */[sFlow] #configure terminal /* コンフィグレーションモードに移行 */ (config)#feature sflow /* システムで sFlow エージェントを有効化 */ (config)#sflow collector 192.168.0.235 port 6343 receiver-time-out 0 max-datagram-size 512 /* sFlow コレクターの設定 */ (config)#interface ce50 /* インターフェースコンフィグレーションモードに移行 */ (config-if)#sflow poll-interval 5 /* sFlow カウンターのポーリング間隔を設定 */ (config-if)#sflow sampling-rate 1024 direction ingress max-header-size 200 /* sFlow サンプリング周期を設定 */ (config-if)#sflow enable /* 該当インターフェースでsFlow エージェント機能を有効化 */SolarWinds Dashboard Results Visualization
This section introduces an example of dashboard visualization of data obtained from white Box switches using the SNMP and sFlow protocols.
This article mainly shows examples of visualizing traffic flow and resource status, but all data that can be obtained via the SNMP protocol can be visualized on the dashboard. It has a mechanism for visualizing the status within the network in real time, and even if there are multiple white Box switches, it is possible to view the operating status, traffic volume, operating time, etc. of each in an integrated manner.
SolarWinds also has the ability to periodically discover devices within the network based on the inventory you create and automatically add them to the monitoring targets, simplifying setup.
equipment traffic flow
The traffic handled by white Box switches varies greatly depending on the time of day and usage.
SolarWinds allows you to closely monitor the traffic flow per interface and the bandwidth used by each application, making it essential for optimizing network bandwidth.
In addition to real-time monitoring, you can also understand trends during peak hours and seasonal fluctuations by analyzing accumulated history. In areas where traffic bias is observed, you can adjust switch settings and redesign network routes.
In this example, the traffic volume of each interface sent and received by the white Box switch is visualized in real time in chronological order.
You can switch the display content of the dashboard by filtering using the following conditions:
・Packet protocol specification
・Specification of device and interface
・Specify the period
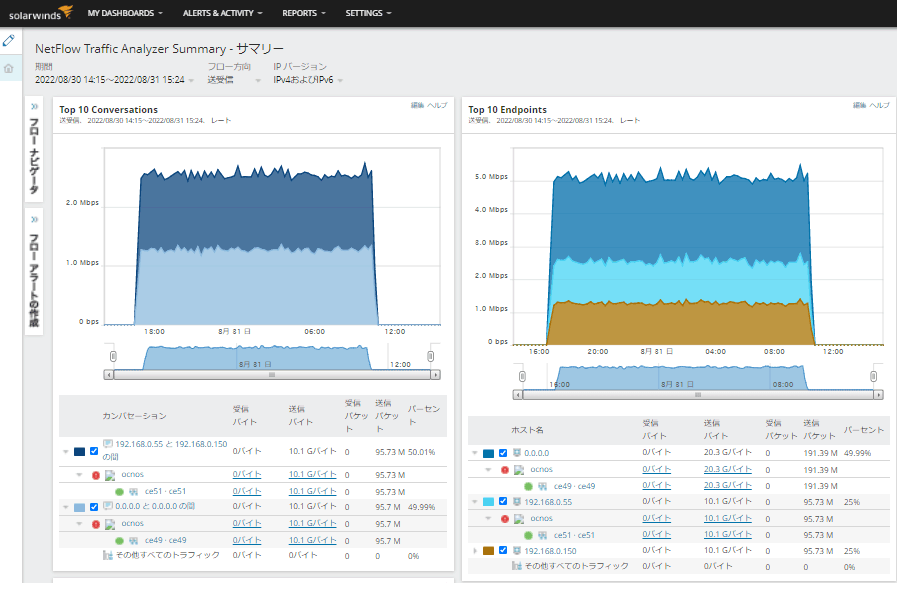
Figure 3: Equipment traffic flow status
Device resource status
To keep white Box switches running stably for a long period of time, it is also necessary to pay attention to the status of hardware resources such as CPU, memory, and temperature. SolarWinds periodically obtains this information via SNMP and API and consolidates and displays it on the dashboard.
Disk Usage
SolarWinds can also monitor disk usage for white Box switches. In the example below, the disk usage currently being used by OcNOS is displayed in a graphical ranking format.
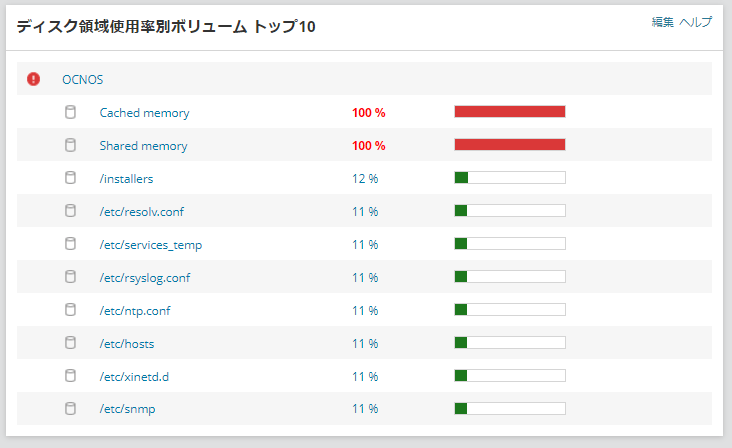
Figure 4: Disk utilization
Interface Status
The interface status of white Box switches can be collectively monitored using the dashboard below. Each monitored device is displayed as a node, and the display mark changes according to the interface status. The image in Figure 6 below shows the detailed status of the Loopback (LO) interface.
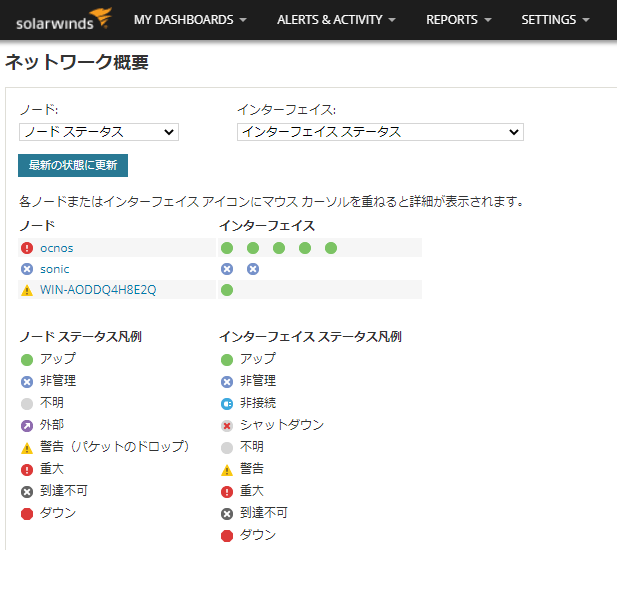
Figure 5: Device interface status
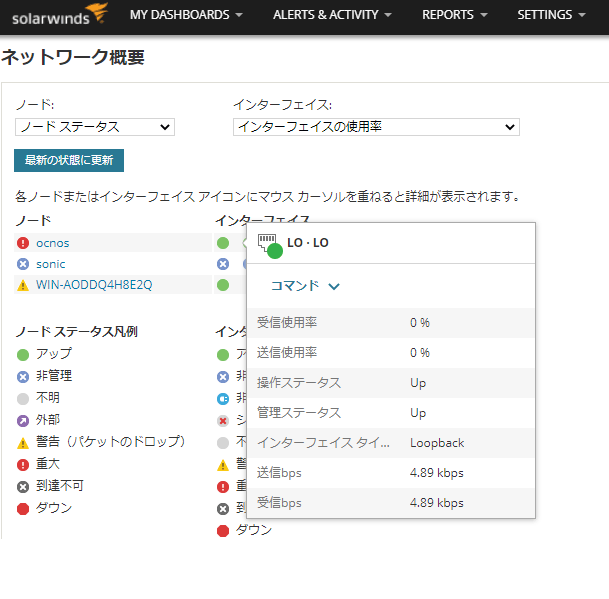
Figure 6: Loopback interface state
Communication path
You can monitor communication paths using a function called NetPath. Since you can see the status and link state of each node at a glance, you can quickly identify which segment is affected when a failure occurs. In addition, by referring to past communication logs, it becomes easier to take measures to prevent the problem from recurring.
The example diagram below shows the communication path from the Windows server running SolarWinds to the Google server (www.google.com). The detailed information on the path is displayed, which is useful for troubleshooting when delays in communication occur.
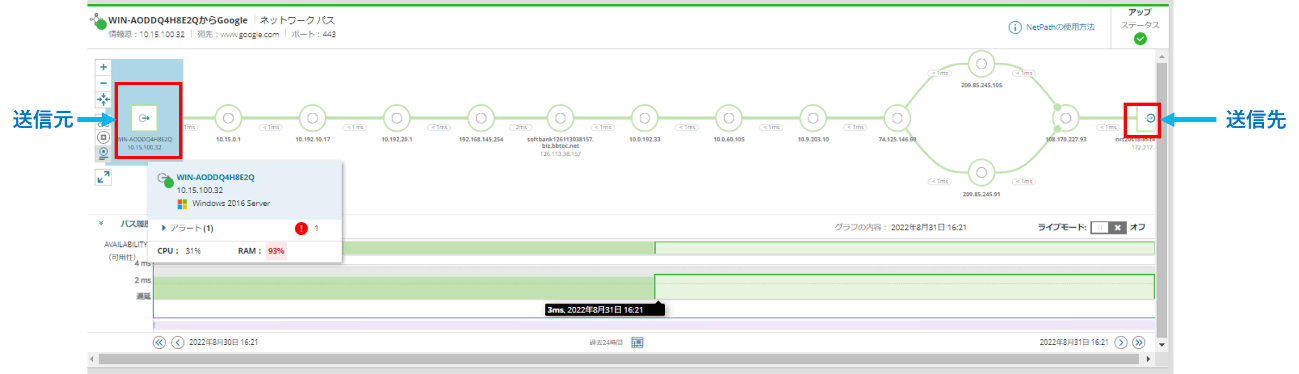
Figure 7: Communication path between servers
This concludes the explanation of the network visualization environment for white-Box switches using SolarWinds.Article 5ecSONiC andIt has been confirmed that the same content works with the OSS version of SONiC.
At the end
Macnica provides a service that remotely provides an environment where you can experience open networking and conduct tests and verifications.
With this service, you can verify the operability of the network OS and perform tests that combine network OSes from various manufacturers, white Box switches, and optical transceivers.
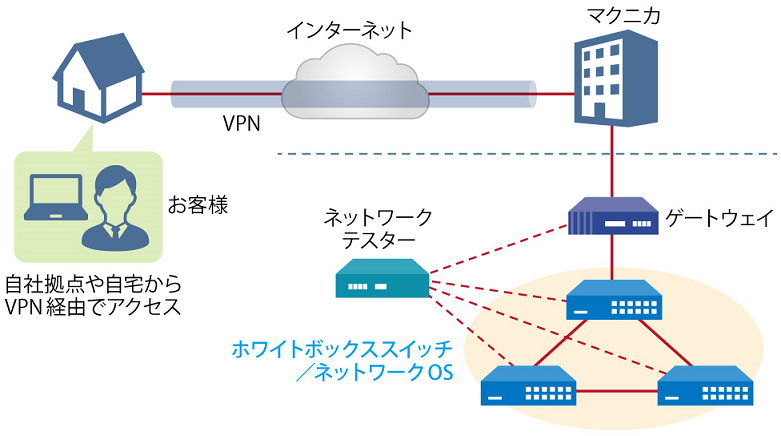
Image of remote verification service
It is a service that allows you to easily verify open networking, and the basic configuration is free of charge.
You can check the downloadable materials for available network OS and white Box switches, specific use cases, and how to apply. The materials can be downloaded from the URL listed in the information email by answering the questionnaire from the "Macnica Network OS Remote Verification Service" below.
These people are using the remote verification service.

Here are some testimonials from people who have actually used the service.
Furukawa Network Solution Co., Ltd.
“Recently, the number of remote service environments is increasing, but I was impressed with the ease of access to the evaluation equipment.
The materials you provided were easy to understand, and we were able to proceed smoothly with the intended verification. ”
Related information


Click here for list of materials

In addition to introducing products handled by Macnica,
We publish materials related to open networking, such as BGP cross network automatic construction files and network operation test evaluation reports.
Click here for details
Product Page Top
Edgecore Networks
We continue to be a pioneer in open networking by developing and selling products related to OpenNetworking/white Box switches.

Aviz Networks
We are pioneers of SONiC, an open source network operating system, providing observability, configuration automation tools and support from a team of SONiC experts.

IP Infusion
As a market leader among open networking providers, we provide reliable network solutions to over 600 customers, including carriers, service providers, and data centers.
Inquiry/Document request
In charge of Macnica Edgecore Networks
- TEL:045-470-9831
- E-mail:projectmonstar@macnica.co.jp
Weekdays: 9:00-17:00