
Introduction
This article introduces how to visualize SNMP (Simple Network Management Protocol) data using the Open Source Software (OSS) Grafana dashboard.
In the 9th article, I touched on the visualization of SNMP data using OSS, using SONiC as an example. I touched on OcNOS in the 4th article, so be sure to check that out as well.
Since OSS tools are used, there is no cost, and as long as you have a server running the tools and network devices to be monitored, you can view SNMP data that used to be viewed as text as a diagram.
There are other articles related to Open Networking, so please see the articles that interest you from the "List of articles" below.
What is SNMP?
First, I will explain the overview of SNMP for visualization.
SNMP is an application layer protocol for monitoring and controlling communication devices such as servers and switches via a network.
It consists of an SNMP manager on the managing side and an SNMP agent on the managed side as shown below, and exchanges information such as the number of discarded packets. The SNMP manager uses UDP Port = 162 and the SNMP agent uses UDP Port = 161.
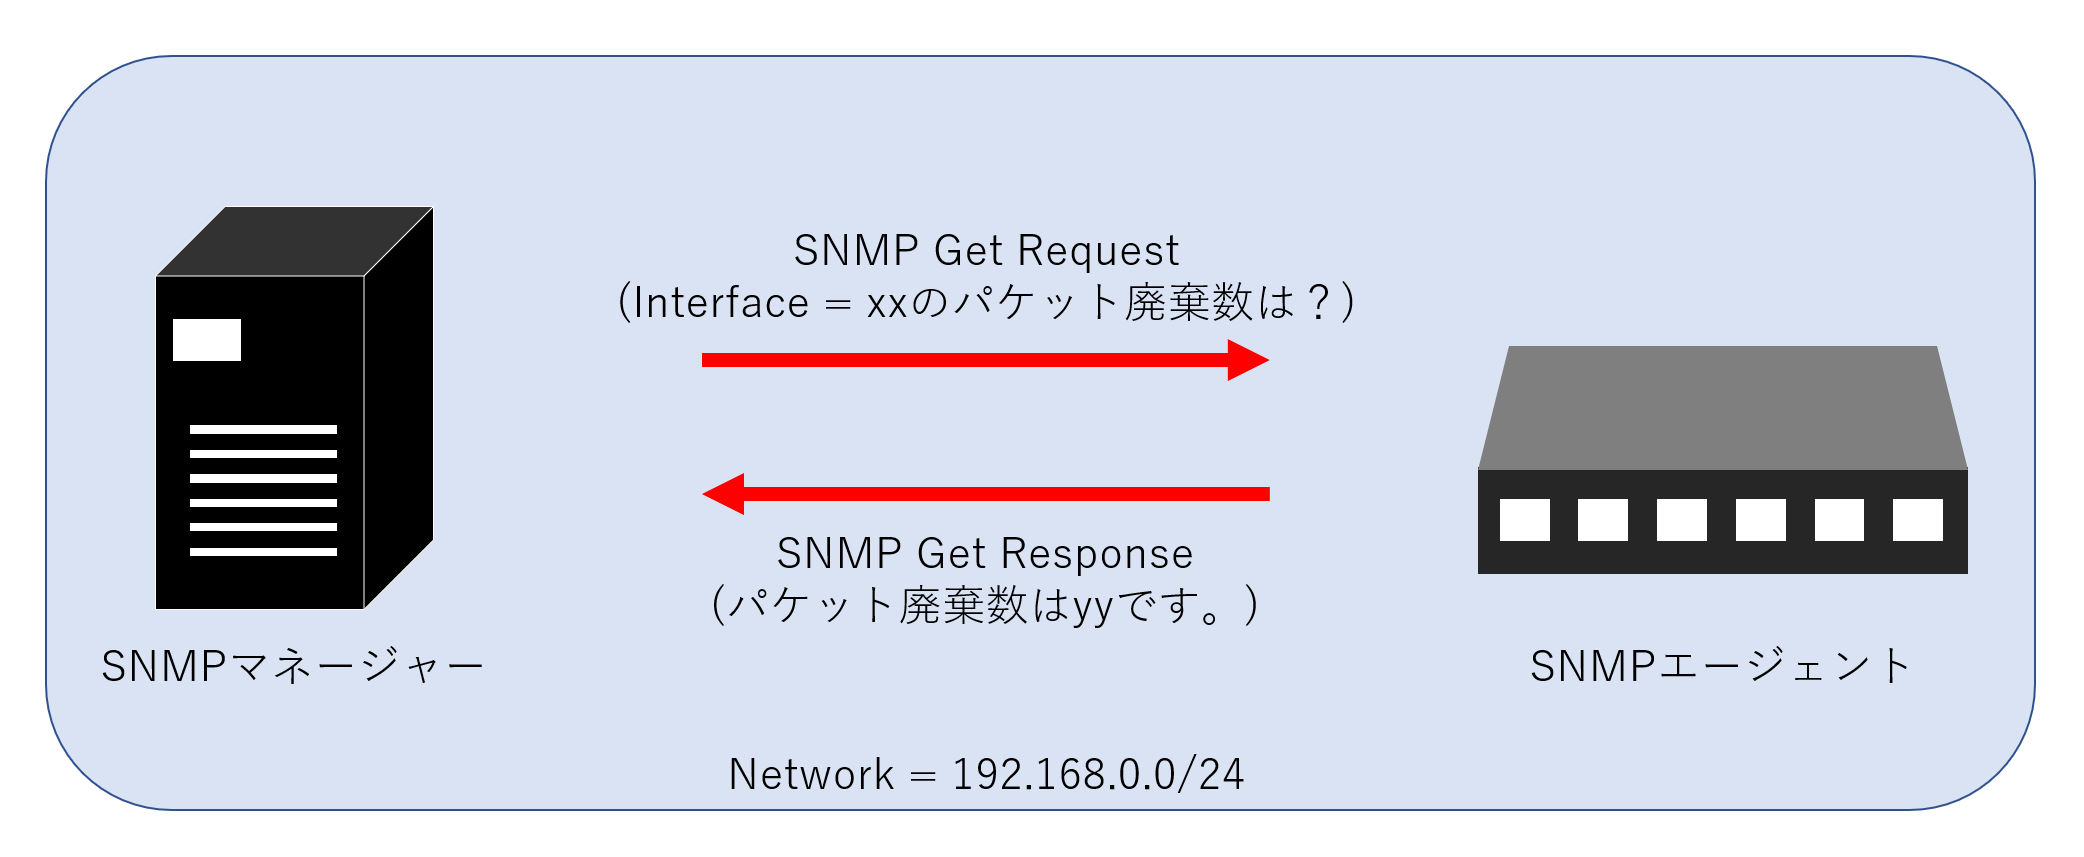
SNMP operation image diagram
What are MIBs?
Next, we will explain the MIB (Management Information Base) used to exchange information with SNMP.
MIB refers to a collection of device information held by the SNMP agent. This MIB includes information such as the number of packets received and the number of packets discarded, and by exchanging the MIB, it is possible to check the interface usage status, etc.
Additionally, the MIB has a tree structure. The information in the MIB is called an object and is assigned an OID (Object ID).
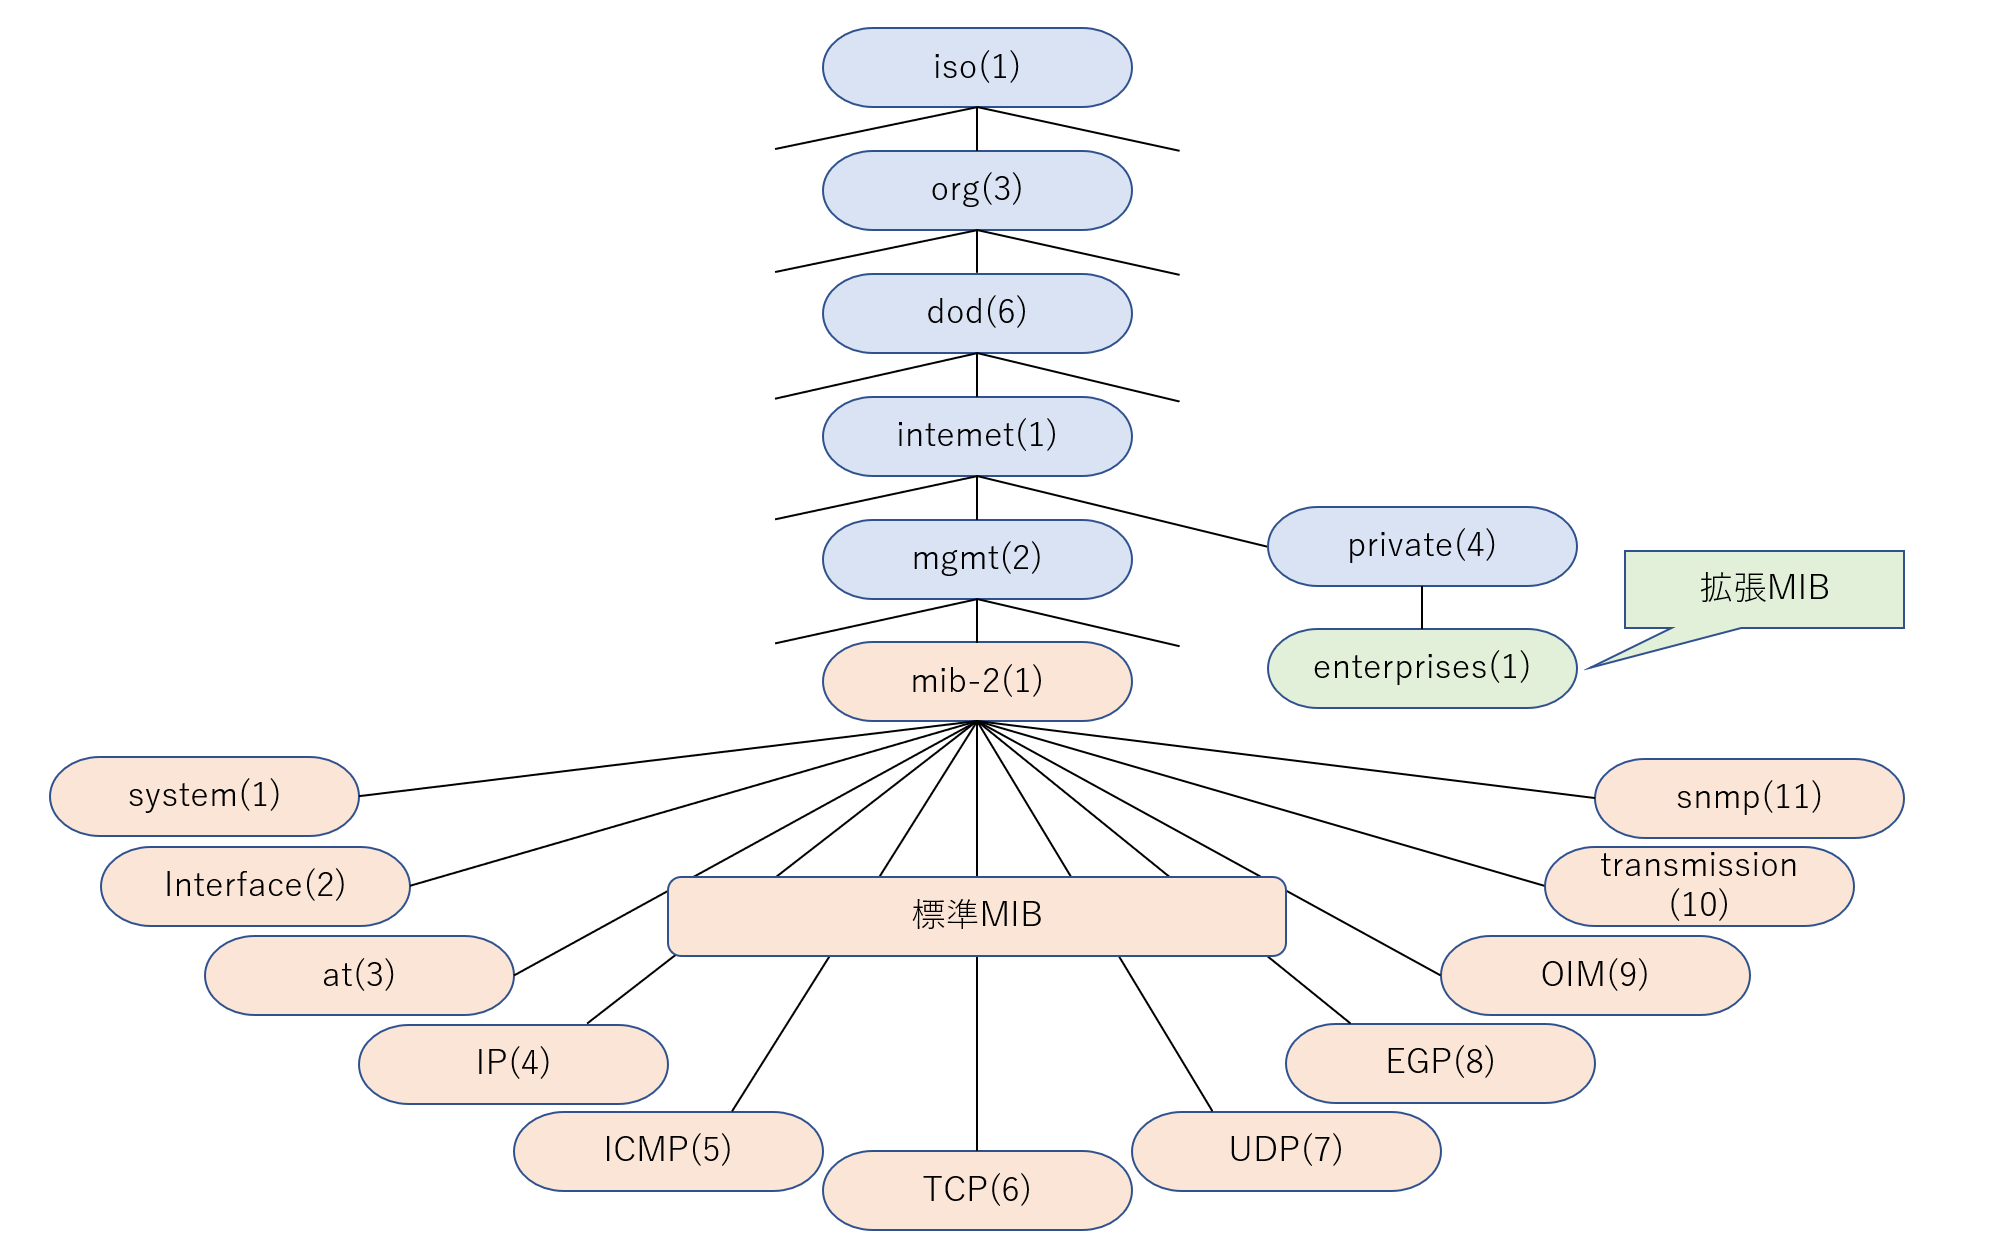
MIB tree structure diagram
For example, each object is assigned an OID as shown below.
| object | OIDs | explanation |
| SysName | 1.3.6.1.2.1.1.5 | Device host name |
| interface | 1.3.6.1.2.1.2 | Various information such as interface status and traffic |
| if In Octets | 1.3.6.1.2.1.2.2.1.10 | Total number of bytes received by each Interface |
Settings for various OSS tools
Next, we will explain the settings of the OSS tools used to visualize the SNMP data, using the simple network configuration diagram below as an example.
For an overview of various tools, please refer to the 9th article.
This time, I will introduce the setting for acquiring MIB information from the white Box switch using telegraf and saving it to influxDB. Also, for Grafana, we will introduce the procedure for logging in with a browser.
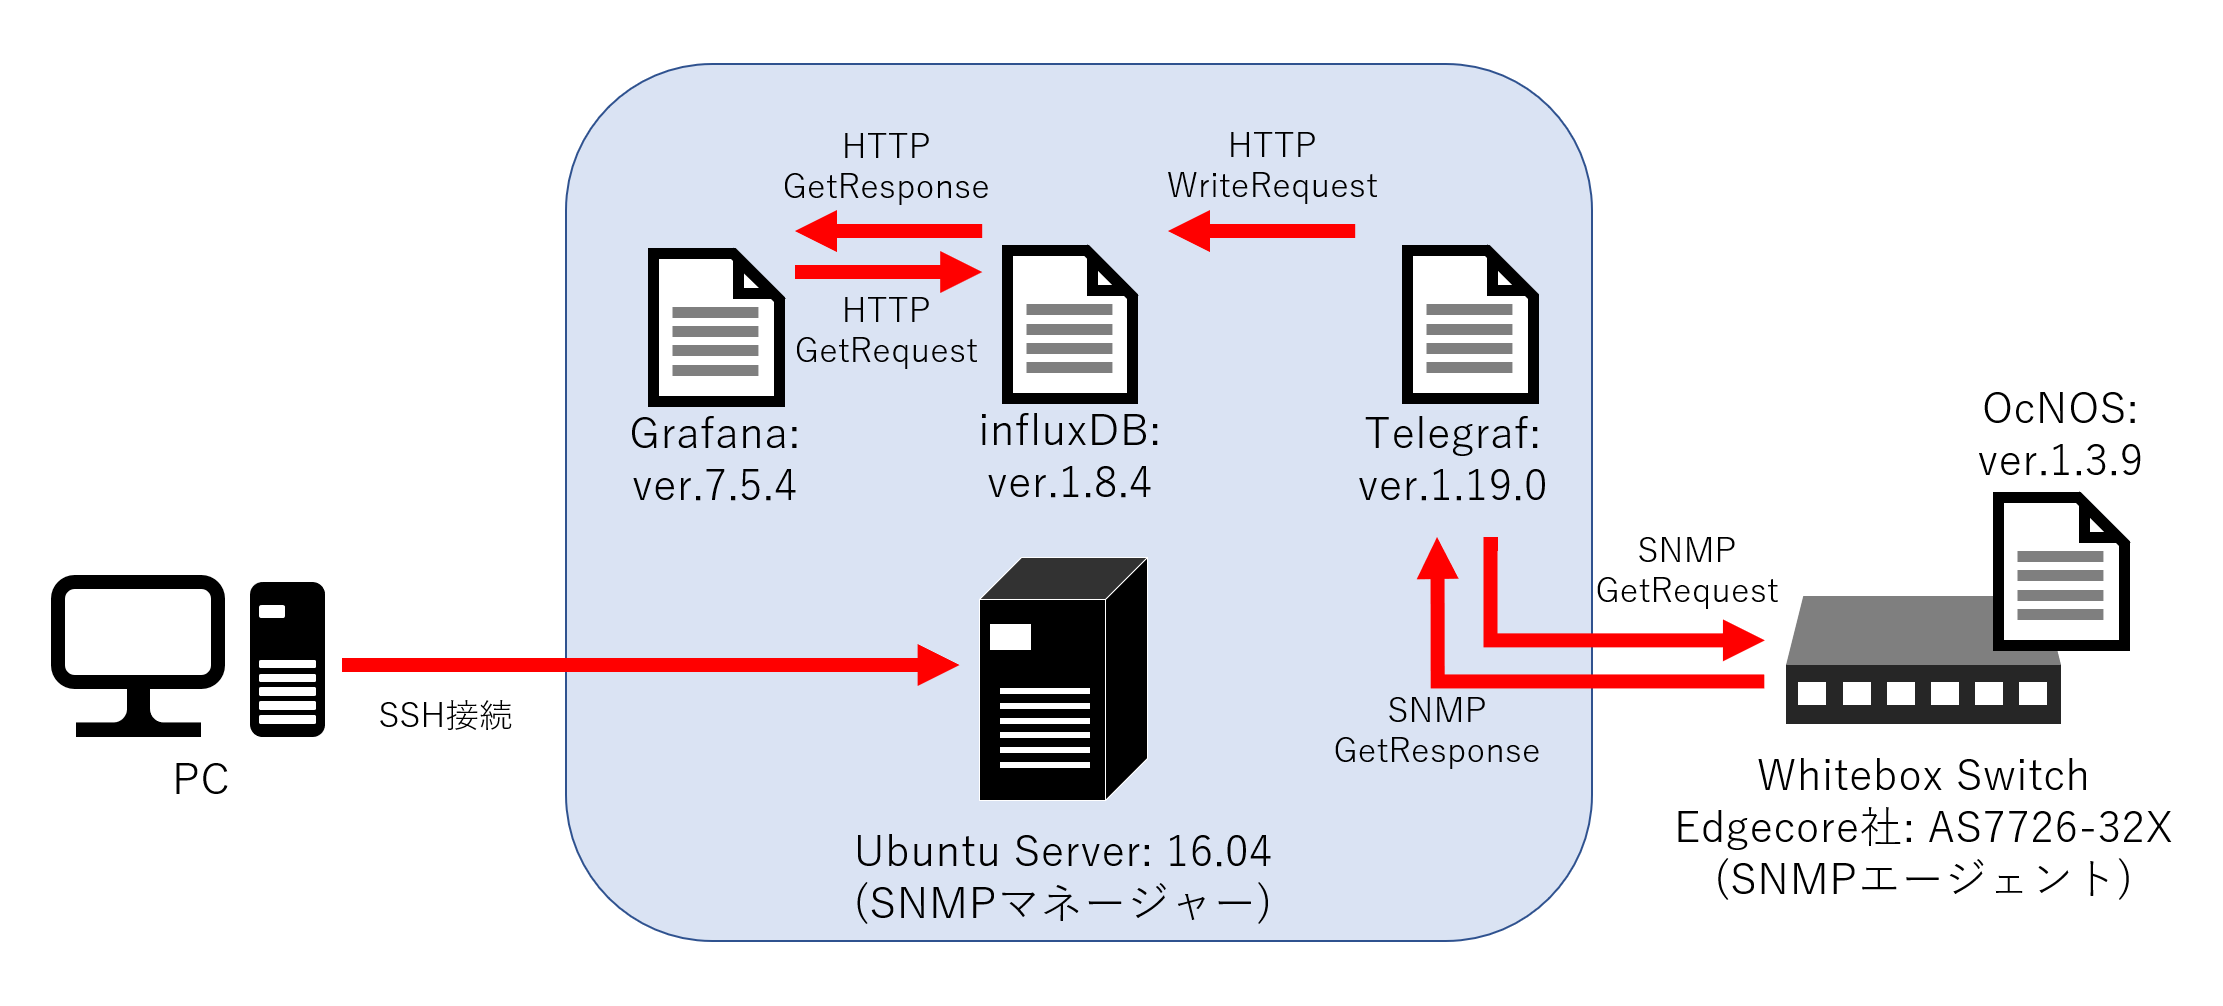
Simple network diagram
Edit telegraf configuration file
Edit the telegraf configuration file (telegraf.conf) with the following command to get SNMP MIB information from the whitebox Box. If the settings are reflected correctly, the MIB information of the whitebox Box will be acquired by telegraf and saved in i nfluxDB.
$ sudo vi /etc/telegraf/telegraf.conf
* The image below is an example of editing telegraf.conf. Agent is a white Box switch that outputs MIB information. Various setting items are as follows.
interval: Interval for collecting Agent data (MIB information)

Agent data collectioninterval
url: influxDB url for output
database: Tool used for influxDB (telegraf)
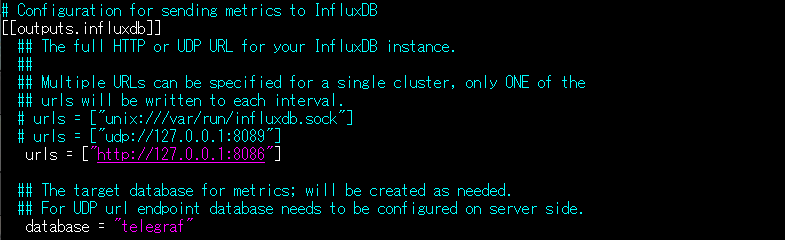
Destination i nfluxDB
agents: IP of target device for data collection
timeout: Time to wait for a response after issuing a data collection request
version: SNMP version
agent_host_tag: the tag used to refer to the data host
community: SNMP community name for which you want to obtain data
retries: number of times to try retries
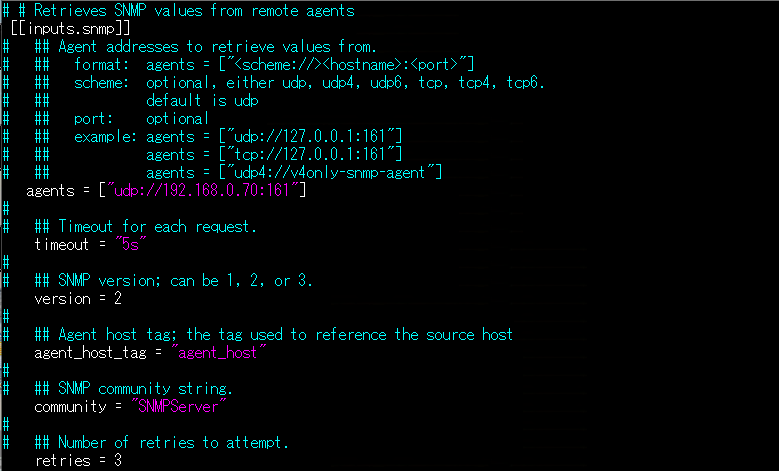
SNMP related settings– Agent IP, Timeout time, etc.
name: MIB object name
oid: OID of SNMP (this time set by name instead of number)
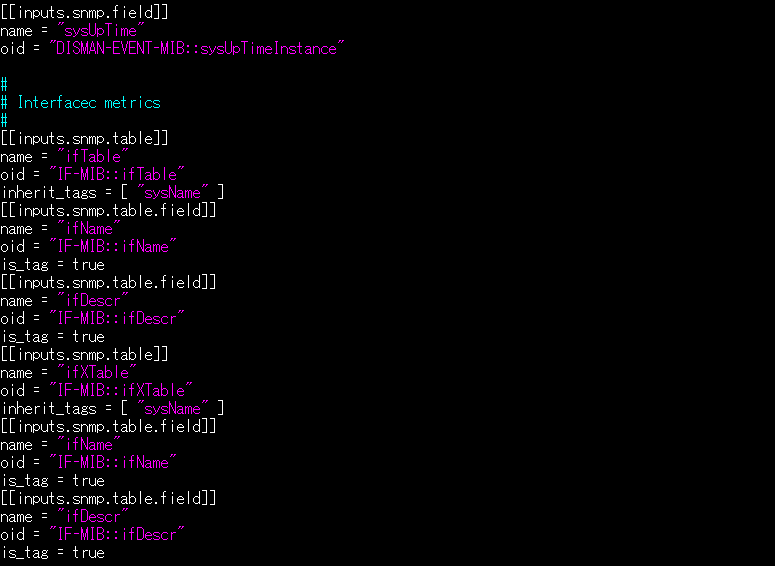
MIB information to retrieve–standard / extended MIB, etc.
service_address: UDP port number
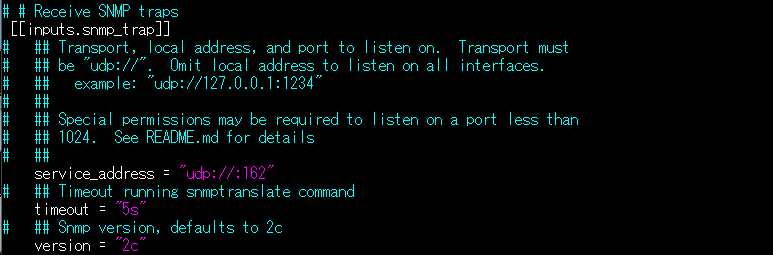
SNMP Trap settings– UDP Port, Timeout, SNMP ver., etc.
Start telegraf, influxDB and Grafana
Start various OSS tools on the Ubuntu server.
$ sudo systemctl daemon-reload
$ sudo systemctl start influxdb.service
$ sudo telegraf --config /etc/telegraf/telegraf.conf &
$ sudo systemctl start grafana-server.service
Check access to influxDB
Access http://192.168.0.80:8086 on the web to check if you can access influxDB.
* Since the version used this time does not support GUI, it is displayed as 404 page not found. (Access itself is successful.)
Check access to Grafana
Check whether you can access Grafana by accessing http://192.168.0.80:3000 on the web in the same way as influxDB.
For the first access, use the User and Password below.
User: admin
Password: admin
*When you log in, you will be asked to change your password.
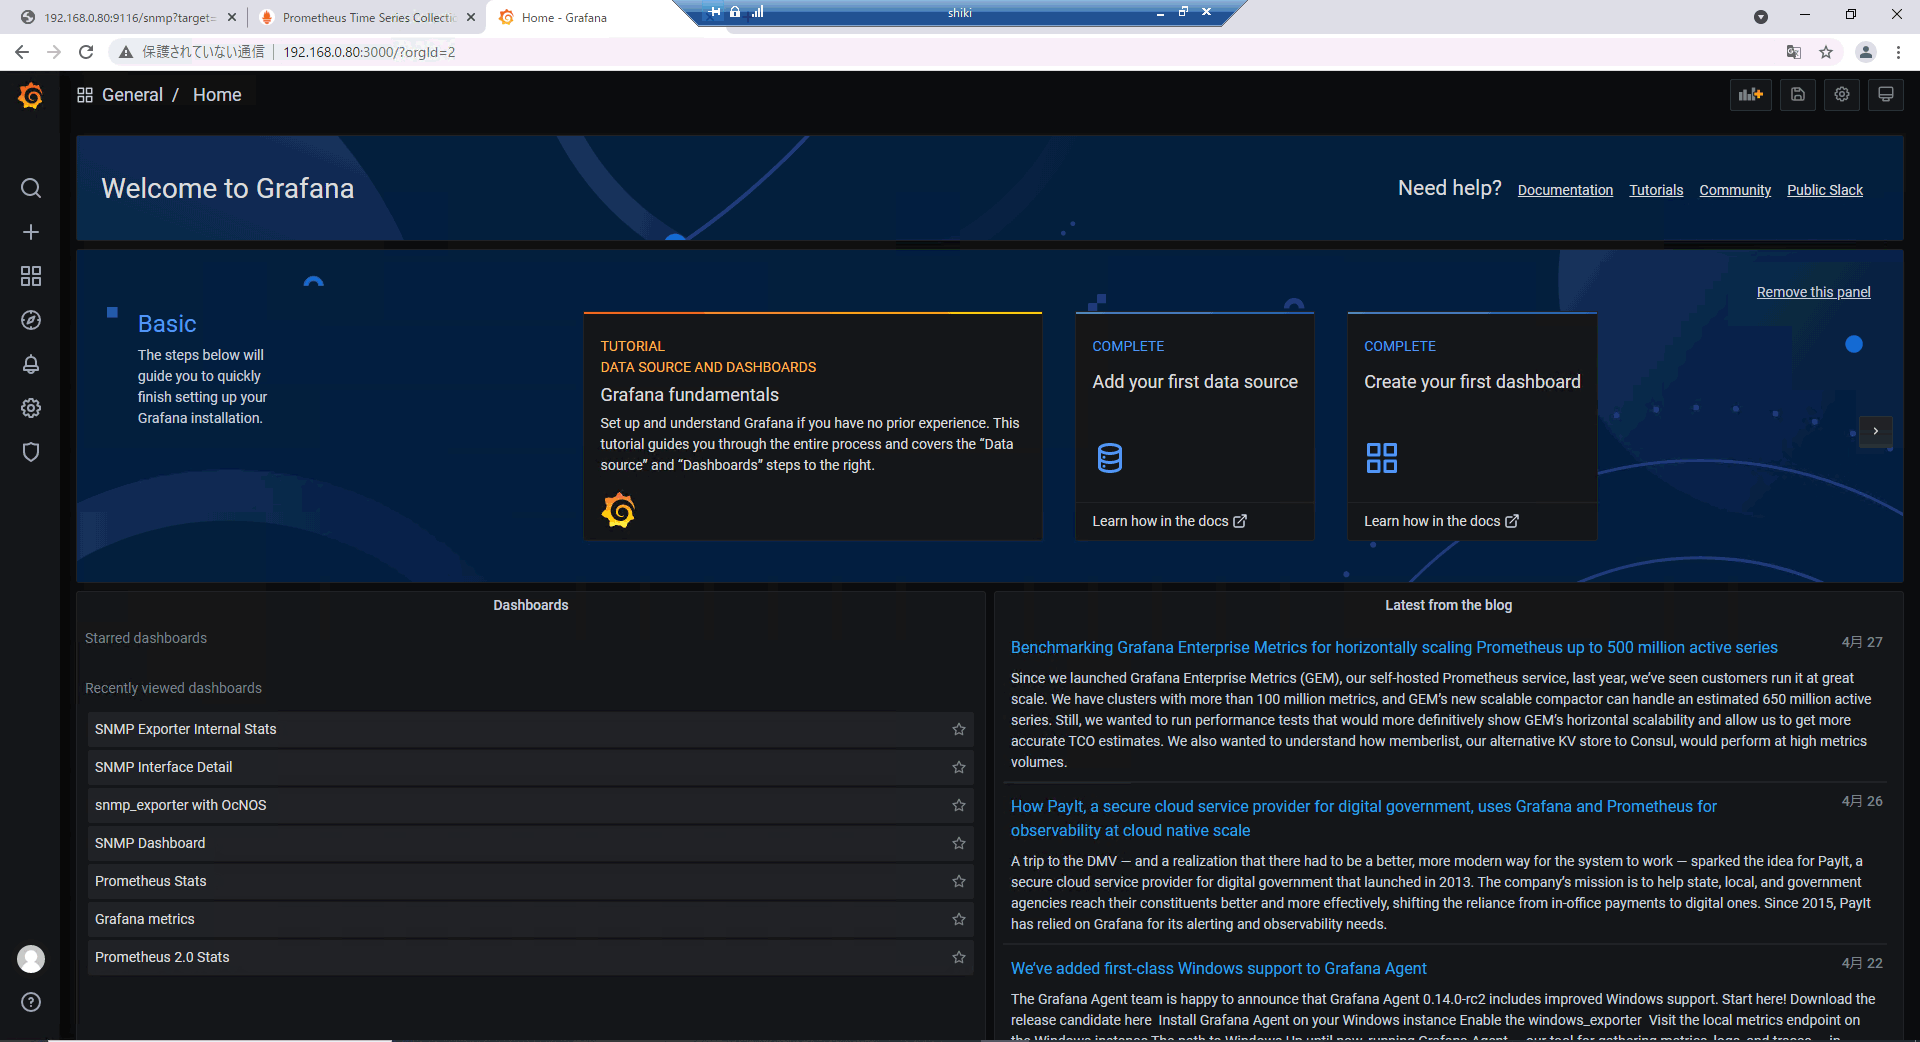
Grafana home screen
Grafana dashboard visualization example
Grafana By setting up a dashboard using the create dashboard method, it is possible to display various information about the switch, such as:
The following information is included in the display contents of the visualization example below.
・Switch activation time
・Interface link information and connection information
・Fan speed
・ CPU load information such as temperature and usage rate
・All traffic that passed through the interface or specific packets (Unicast packets, etc.) only traffic information
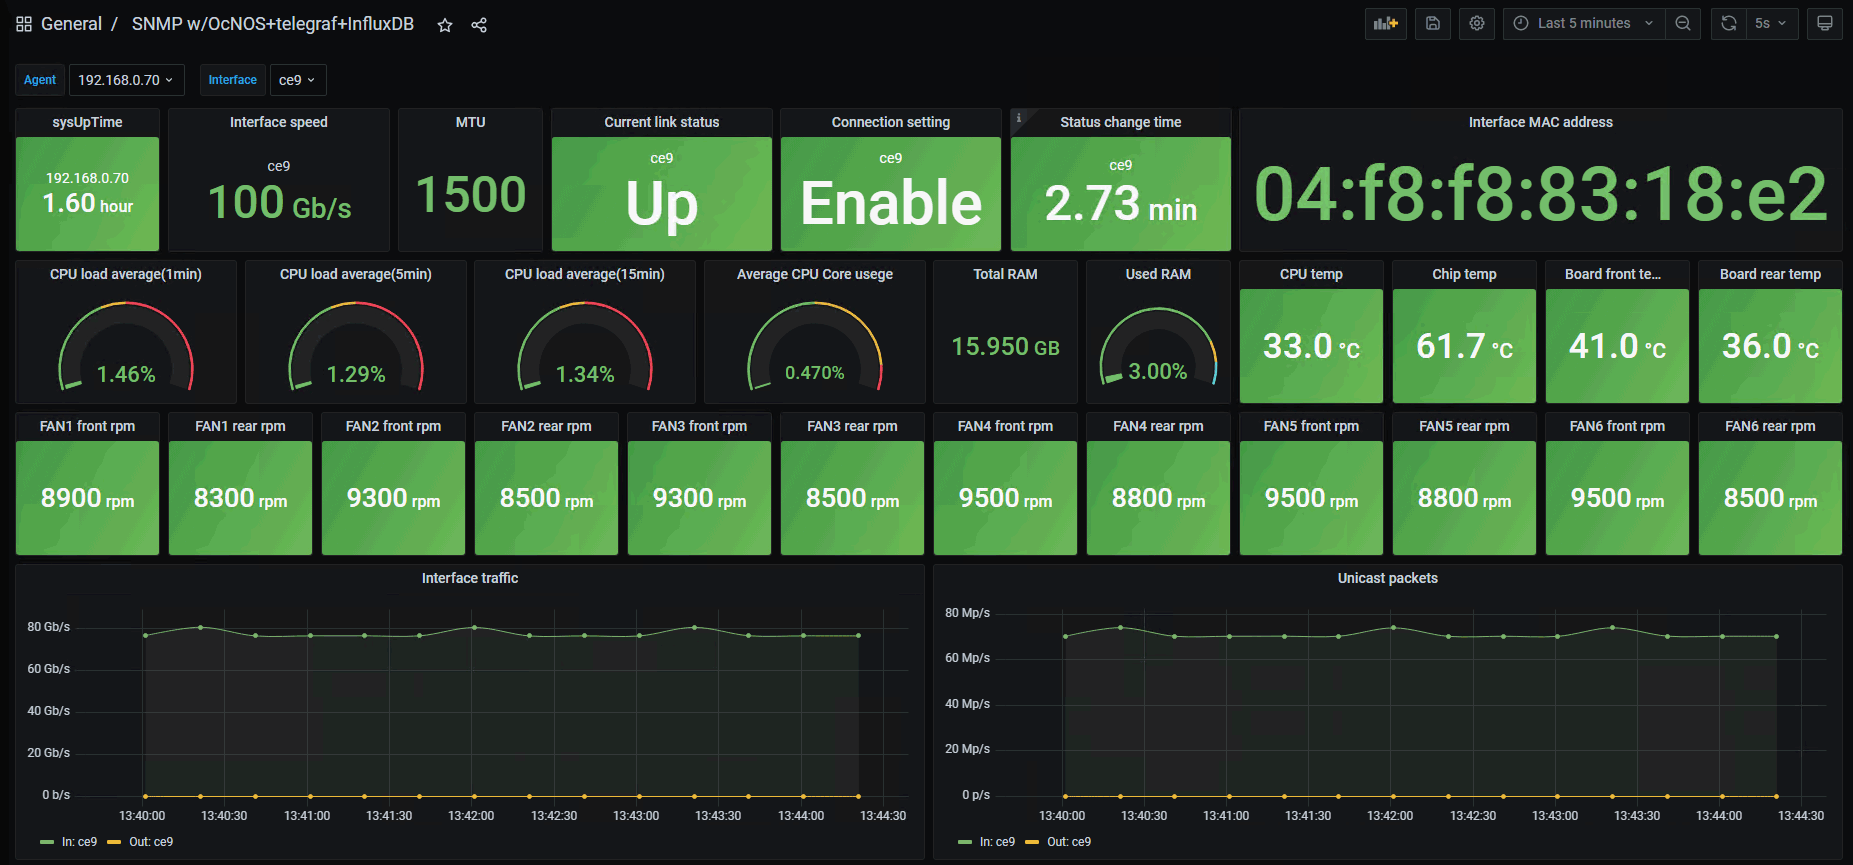
Dashboard visualization example
The above is an example of settings for obtaining MIB information of a white Box switch using SNMP and visualization of the Grafana dashboard.
In Part 11, I will introduce how to create a Grafana dashboard.
At the end
Macnica provides a service that remotely provides an environment where you can experience open networking and conduct tests and verifications.
This service allows us to verify the operability of network OSes and perform tests that combine network OSes from various manufacturers, white Box switches, and optical transceivers.
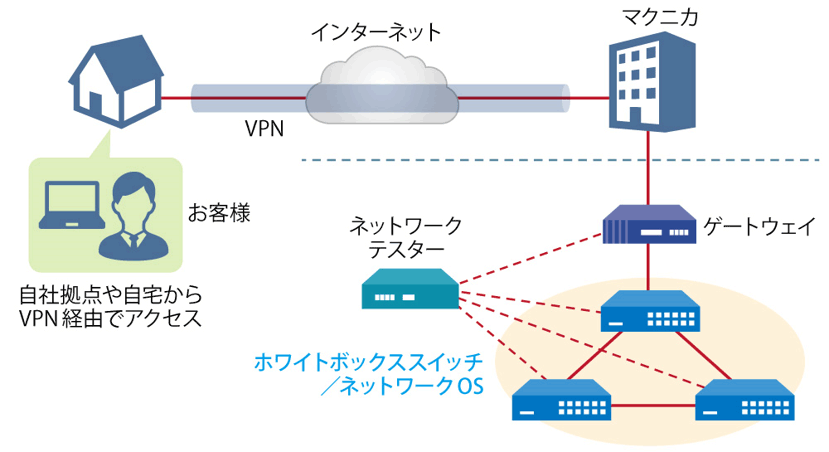
Remote verification service image diagram
It is a service that allows you to easily verify open networking, and the basic configuration is free of charge.
You can check the downloadable materials for available network OS and white Box switches, specific use cases, and how to apply. The materials can be downloaded from the URL listed in the information email by answering the questionnaire from the "Macnica Network OS Remote Verification Service" below.
These people are using the remote verification service.

Here are some testimonials from people who have actually used the service.
Furukawa Network Solution Co., Ltd.
“Recently, the number of remote service environments is increasing, but I was impressed with the ease of access to the evaluation equipment.
The materials you provided were easy to understand, and we were able to proceed smoothly with the intended verification. ”
Related information
![[Part 4] Automated construction of a white Box switch that even beginners can do and its setting method ~ZTP x OcNOS~ Thumbnail image](/business/network/columns/2521d974b3239d035fb88a308650f70e.png)
![[Part 9] SNMP visualization of white Box switches using SONiC - Grafana x InfluxDB - Thumbnail image](/business/network/columns/84d7a7525020782725001d27311eddde_1.png)
![[11th] Thumbnail image of how to create a network visualization dashboard using Grafana for beginners](/business/network/columns/071625e009bd21fc48547707c0326d8a_1.png)
Click here for list of materials
In addition to introducing products handled by Macnica,
We publish materials related to open networking, such as BGP cross network automatic construction files and network operation test evaluation reports.
Click here for details
Product Page Top
Edgecore Networks
We continue to be a pioneer in open networking by developing and selling products related to OpenNetworking/white Box switches.
DELTA ELECTRONICS
We have many achievements in various fields such as networks, IoT, and electronic components.
CGS Tower Networks
We provide a network packet broker (NPB) that utilizes state-of-the-art general-purpose hardware.
Inquiry
今回ご紹介したOSSを活用したSNMPデータの可視化方法についてデモを行うことも可能です。また、OSSではなく有償ツールのご用意も御座います。
If you have any questions regarding this article, please contact us below.
Macnica
In charge of OpenNetwork
Contact us by phone:
045-470-9831
Email us:
projectmonstar@macnica.co.jp