In this tech blog, I aim to share the following information:
Why is it hard to understand the human brain
What are some of the neuroscience-related research efforts in NeurIPS 2020
Background
The brain is a very complex organ that acts as the control system of our body. It can process a large amount of information in such a short time. It even inspired many modern AI methods that we know now due to its seamless ability to learn and adapt to new environments. While the brain is a fascinating organ, it is also a challenge to fully understand. There are different methods to measure brain activity (e.g. fMRI, EEG). Understanding these data can help to differentiate various mental states of humans and also detect patterns of neurological disorders. However, analyzing these data is difficult due to the noise and variance of brain signals and information from different people.
Currently, there are many efforts in AI and neuroscience that attempt to decode the brain. In this blog, let’s look at some of the research papers from one of the top machine learning and computational neuroscience conference, Neural Information Processing Systems (NeurIPS).
NeurIPS is one of the most prestigious AI conferences. This year, the conference was held virtually from Dec 6thto Dec 12th. They feature peer-reviewed novel AI and computational neuroscience researches.
Interesting Papers about Neuroscience in NeurIPS2020
For this tech blog, we picked out 3 computational neuroscience papers that we found interesting.
Converting complicated brain activity data into higher-level abstractions
As mentioned before, analyzing brain activity data such as fMRI is difficult due to noise and person-to-person variation of the data. To solve this problem, Rieck et al. (2020) proposed a non-parametric framework that transforms fMRI data into topological representations. Using their framework, the authors were able to discover age-related clusters and trends in people's fMRI data. From fMRI images over a time range, they transformed it into persistence diagrams that are higher-level abstractions of the original data.
Results
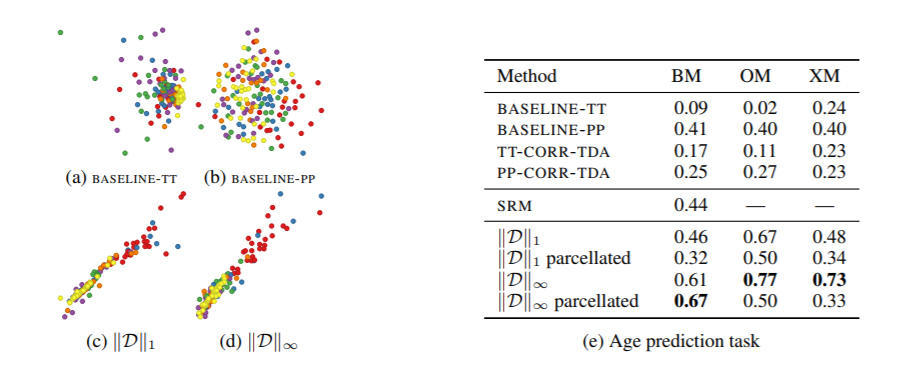
■Baseline Comparison To demonstrate the novelty of their methods, the authors used the persistence diagrams that were generated using their method to predict the age of the participants.
出典:Uncovering the Topology of Time-Varying fMRI Data using Cubical Persistence キャプション:Figure 3: An embedding of the distances for different baselines and topological summaries, based on the whole brain mask. https://arxiv.org/pdf/2006.07882.pdf
When compared to different baseline methods which showed no clustering for the different age groups, their method showed a distinction between children (yellow) and adults (red). For qualitative evaluation, they trained ridge regression models using different types of data. The model trained with data using the authors’ methods performed significantly better when compared to baseline methods.
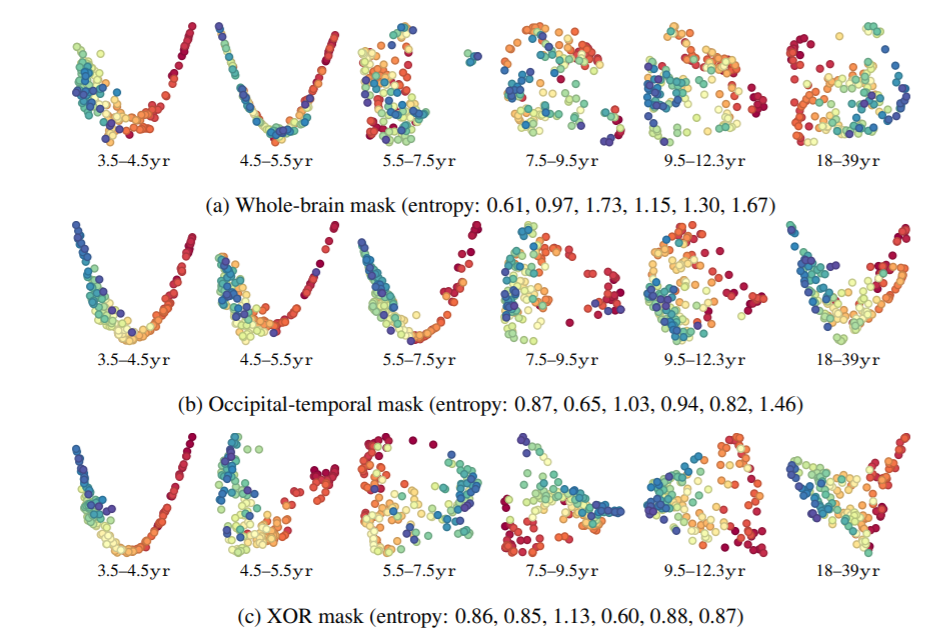
■Brain State Trajectory Analysis The authors also investigated brain state analysis using data generated from their method. They analyzed the fMRI records of participants watching the movie ‘Partly Cloudy’. Their results are down below.
出典:Uncovering the Topology of Time-Varying fMRI Data using Cubical Persistence キャプション:Figure 4: Cohort brain state trajectories for different brain masks, embedded using PHATE https://arxiv.org/pdf/2006.07882.pdf
From their analysis, the author noticed linear brain state trajectories for the younger subjects. The authors suggest that complex brain trajectories in the XOR mask mean that the participants are connecting the movie in their memory. For more information, here’s the link for the full paper:
Overall, the authors showed promising results on where their framework can be used. In the future, other neurological state analysis, like studying data patterns of people with mental illnesses, can be explored.
Transforming brain activity data into perceived images
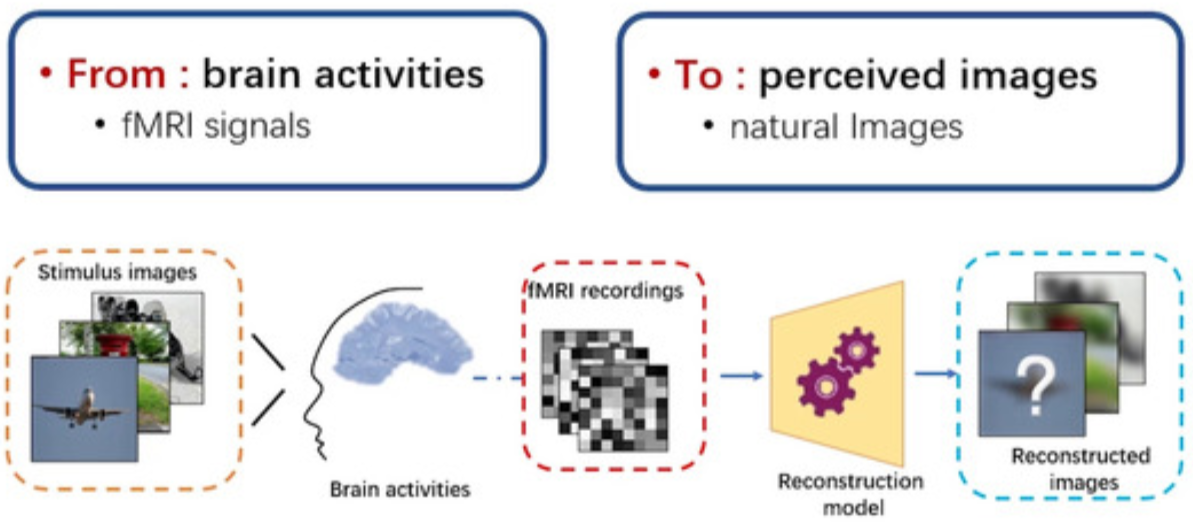
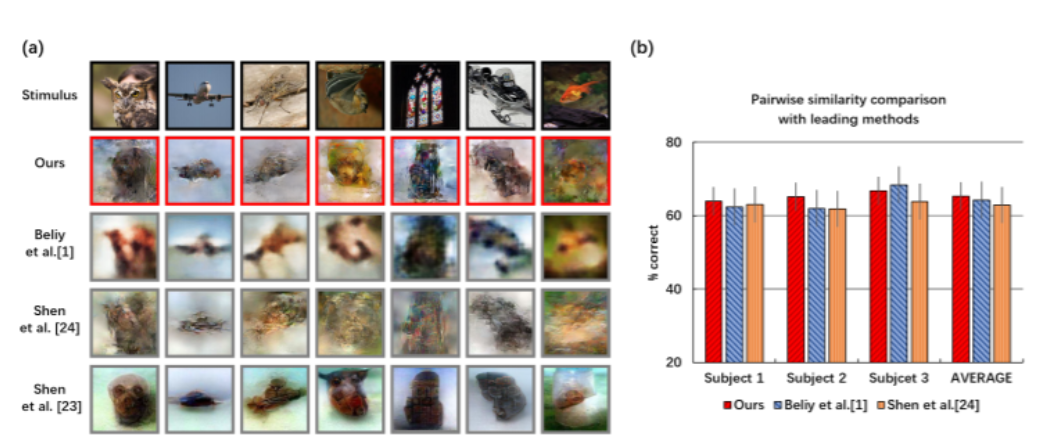
Visual encoding of the brain is very complex and not fully understood yet. Despite that challenge, Fang et al. (2020) of Zhejiang University proposes a method to reconstruct perceived images from brain activity data. One potential of being able to output perceived images from brain activity data is that it will advance brain-reading technology. This will also help us understand more how the brain processes visual stimuli.
To decode the perceived images from fMRI signals, the authors designed a framework that has 3 main parts: semantic decoder, shape decoder, and image generator. The semantic decoder and shape decoder extracts categorical information and perceived image shape from fMRI data. These information are then given to a generative adversarial network (GAN) that reconstructs the image.
This research is a promising development on brain-reading. Amazingly, they were able to capture the general colors and shapes of the objects. While brain-reading technology poses risks of invasion of privacy, it will also greatly advance our knowledge of Neuroscience.
Predicting neural response to sensory stimuli
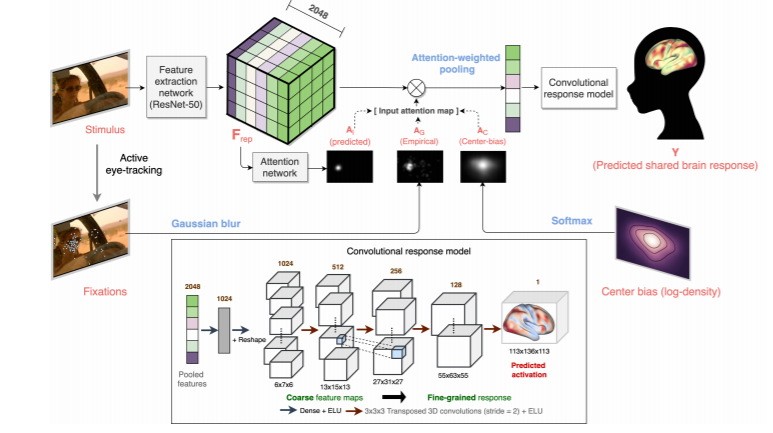
While the other papers try to decode brain responses, this next paper does the opposite. Khosla et al. (2020) wants to predict the resulting response of the brain when it is given sensory stimuli. They integrated gaze information as an attention mask in order to get better results. Analyzing the relationship between neural activity and sensory stimulation will pave the way to the development of different novel therapies. Neural encoding can be used to know what stimuli is needed to evoke the desired brain response.
To predict brain response, they created the above framework. Their framework is composed of two main parts: a representation module that extracts important information from raw stimuli, and a response model that that predicts neural response from the feature space. The representation module makes use of gaze information to have a better representation of the stimulus.
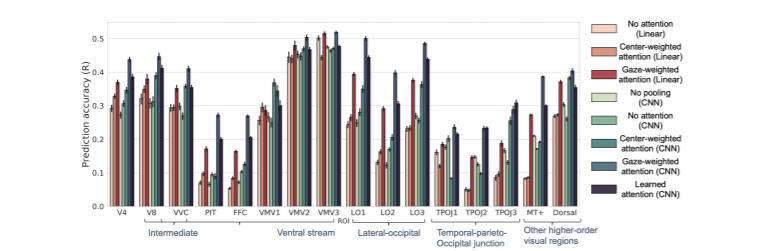
In their results, it showed that using gaze information to gauge human attention resulted in more accurate neural predictions. To remove the need for gaze information during inference, the authors also built an attention model that was trained to predict gaze information from stimuli. It also performed better than some of the other methods. For more information, here’s the link for the full paper:
The development of neural encoding models could pave the way for many brain-machine interfaces and a deeper understanding of how our brain processes information.
Summary
Did that pique your interest in neuroscience? In this tech blog, we were able to list interesting computation neuroscience papers from NeurIPS. You may check out other papers in NeurIPS 2020. The brain is a wonderful but complex organ. Using AI, we can untangle this complexity. Are you interested in how AI can be used in Neuroscience or any other field? If yes, feel free to contact Macnica's AI expert organization, AI Research & Innovation Hub!
>Rieck, Bastian, Tristan Yates, Christian Bock, Karsten Borgwardt, Guy Wolf, Nicholas Turk-Browne, and Smita Krishnaswamy., "Uncovering the topology of time-varying fMRI data using cubical persistence." , Figure 3: An embedding of the distances for different baselines and topological summaries, based on the whole-brain mask (BM); colour-coding refers to the age group of participants., Figure 4: Cohort brain state trajectories for different brain masks, embedded using PHATE [39]. Annotations provide the age range of subjects in one cohort., arXiv:2006.07882v2, https://arxiv.org/pdf/2006.07882.pdf
>Tao Fang, Yu Qi, Gang Pan, “Reconstructing Perceptive Images from Brain Activity by Shape-Semantic GAN”, Figure 3: Image reconstruction performance comparison with other methods. (a) Images reconstructed by different methods. (b) Performance comparison with pairwise similarity., https://proceedings.neurips.cc/paper/2020/file/9813b270ed0288e7c0388f0fd4ec68f5-Paper.pdf
>Khosla, Meenakshi, Gia Ngo, Keith Jamison, Amy Kuceyeski, and Mert Sabuncu. "Neural encoding with visual attention." , Figure 1: Proposed method. A, Figure 3: Top: ROI-level analysis Mean correlation values across intermediate (V4), higher visual areas in the inferotemporal cortex and its neighborhood and other higher higher-level visual regions (Dorsal, MT+) as described in the HCP MMP parcellation [19]. Error bars represent 95% confidence intervals around mean estimates computed using bootstrap sampling., arXiv:2010.00516v1, https://arxiv.org/pdf/2010.00516v1.pdf


 最新情報
最新情報 導入事例
導入事例 ブログ
ブログ 資料一覧
資料一覧