Products/Services
product
- Why choose Splunk
- Installation record
- price
- Splunk Enterprise Security
- Splunk Phantom (SOAR)
- Splunk ITSI (Next Generation IT Operations)
- Splunk Observability Cloud
- Splunk UBA
- Macnica CSIRT App Basic
- App for Splunk for Financial Institutions
- Splunk Analytics for Hadoop
- About Apps
- Splunk Edge Hub
- What is Splunk
service
- Dashboard/SPL Creation Pack [Implementation/Building Support]
- Version upgrade service [implementation and construction support]
- Smart Security Monitoring App [Original App/Service]
- Splunk × LANSCOPE Original App [Original App/Service]
- Security Monitoring App for Box [Original App/Service]
- Cloud Security Monitoring App [Original App/Service]
Specifications/Technical Information
Specifications/Technical Information
Evaluation machine application/FAQ
Application for evaluation machine
- FAQ
How to display all values in a graph displayed by timechart command
- release date
- 2017-09-01
- last updated
- 2024-01-29
- version
- Splunk Enterprise 9.1.2
- Overview
- This section explains how to display all items in the graph displayed by the timechart command.
- Change log
- 2018/08/02 Changed "limits" in limit option to "limit"
2017/06/01 First edition
- Reference information
- content
-
When displaying a graph in the Search App visualization, the following may occur.
- Even if the value is "NULL", it will be aggregated and displayed as one of the results.
- If there are many items to display, they are grouped into "OTHER" and displayed.
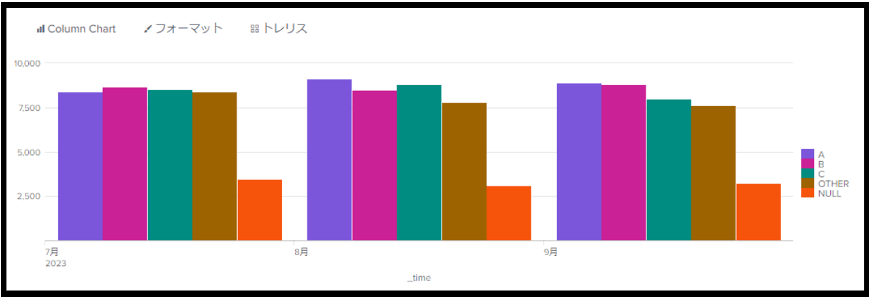 (Figure 1) When the graph displayed includes "NULL" or "OTHER"
In the above case, use the following options for the timechart command in the search query to hide "NULL" items and display all items included in "OTHER" in the legend. is possible.
- usenull option
Items for which the search result value is "NULL" are excluded from the graph display. To hide "NULL" items, use usenull=false in the search statement. - useother option
When there are many items to be displayed, the grouped items are displayed as "OTHER". If you use useother=false in the search statement, the combined "OTHER" items will be hidden. - limit option
This option limits the number of items displayed on the graph. You can display N items on the graph by including limit = N in the search statement. Use limit = 0 in your search statement if you want the graph to display all items in the search results.
If you use the above options and execute the search statement, it will be possible to hide "NULL" and display all items rounded to "OTHER" on the graph as shown below.
[Search statement execution example]
<検索対象> | timechart span=1month sum(value) by extracted_host usenull=false useother=false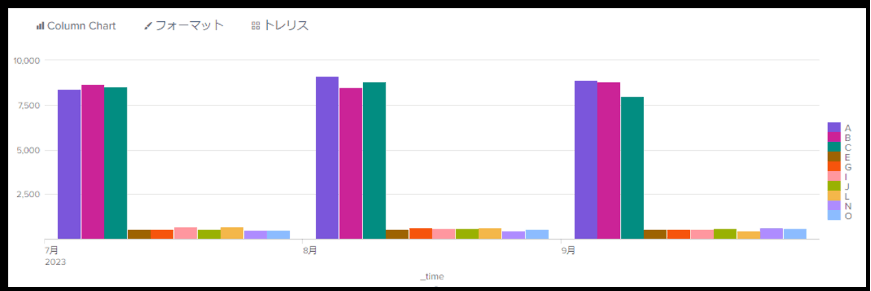 (Figure 2) Using the above options to not display "NULL" and to display all items included in "OTHER"
that's all
In charge of Macnica Splunk Co., Ltd.
- TEL:045-476-2010
- E-mail:splunk-sales@macnica.co.jp
Weekdays: 9:00-17:00