Splunk
スプランク
DX時代の巨大なシステム構築/サービス開発において注目が高まるクラウドネイティブへのアプローチ。
一方で、監視の仕組みも従来の手法から変革していく必要があります。
コンポーネントを気にすることなく開発速度を高めることが可能に。
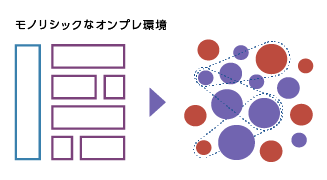
マイクロサービスによって設定変更を容易にする
スケーラブルな環境の実現
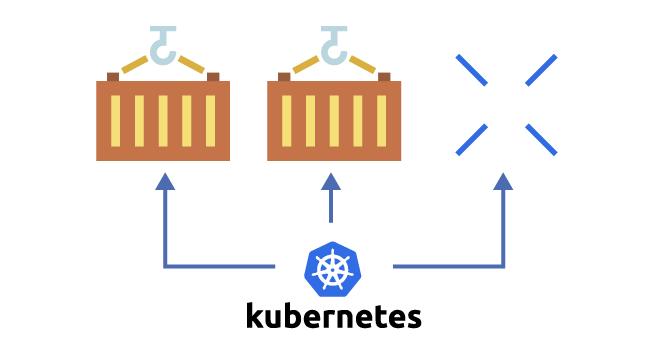
コンテナ/Kubernetes等による
自動化された柔軟な構成
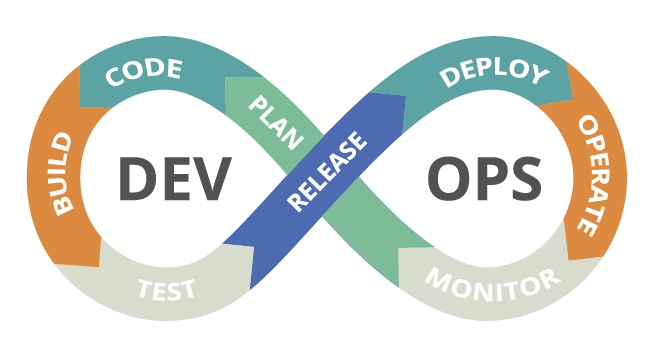
DevOps体制の実現による
開発サイクルの高速化

しかし、分散アーキテクチャの通信経路や相互依存関係を追跡することは困難
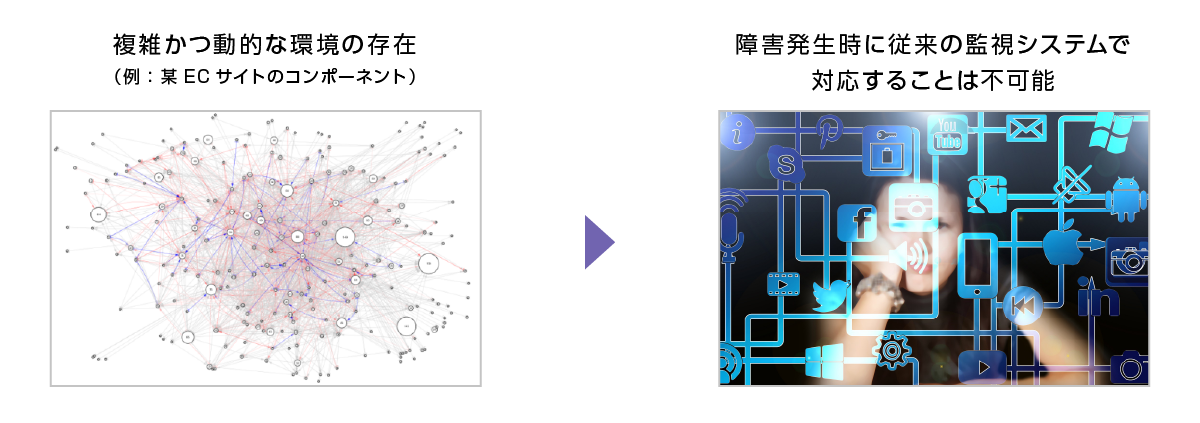
複雑かつ動的な環境においても
効率的な「監視」「問題の検出」「根本原因の追究」が可能に


Observability(オブザーバビリティ=可観測性)とは
Observe(観察する)とAbility(能力)を組み合わせた意味の単語で、システムで何が起こっているかを的確にとらえ、正確に対処ができるかを示すものです。
特徴1 データを相関づけることで複雑かつ動的な環境においても事象の把握が可能に
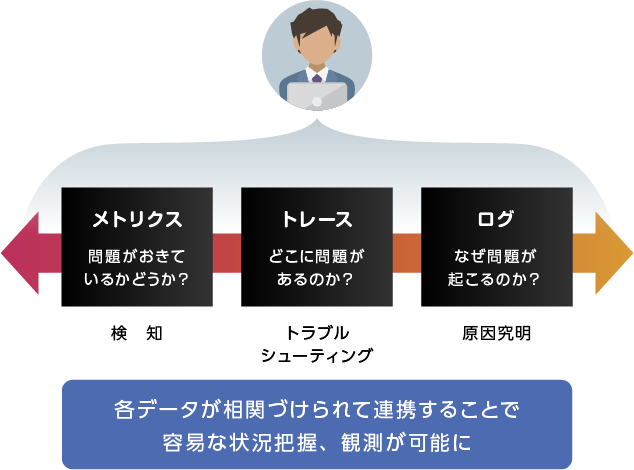
従来の運用監視ソリューションは、ノード単位で閾値を定めて、KPIが上限に達したらアラートを発砲し対処するという静的な環境をベースにしたものでした。
クラウドネイティブのような動的な環境においては、構成が変更されても即時判断を可能にする仕組みが求められているため、『Observability』の取り組みが必要不可欠になります。
Observabilityのソリューションは各種データ(ログ、メトリクス、トレース)を相関づけることで動的な環境においても容易な状況把握、観測を可能にします。
特徴2 わかりやすいUIにより、直感的な操作が可能に
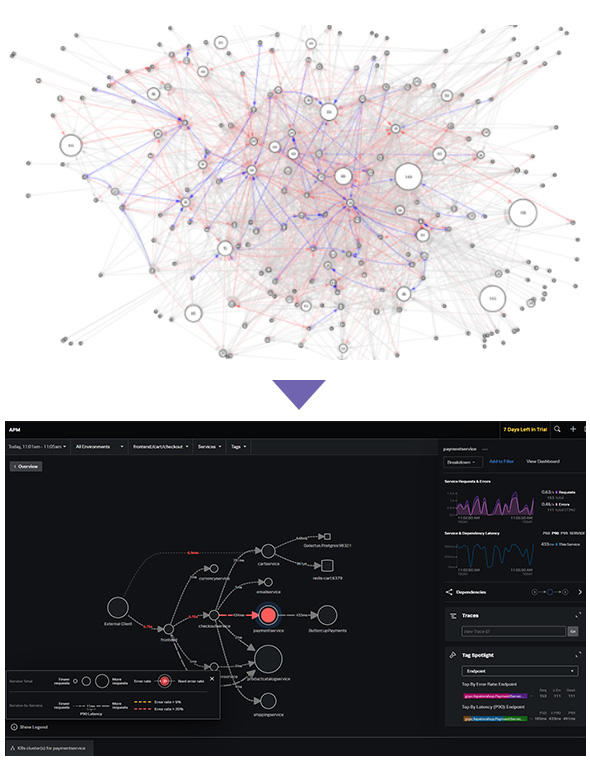
企業のシステムやサービスにおいてシステムダウンは大きな損失につながります。堅牢なクラウドネイティブな環境においても障害発生時の原因追及、迅速な復旧は重要な対応事項の1つです。
『Observability』の力によって、複雑なマイクロサービスアーキテクチャにおいても、自動でツリー構造化されたUIによって依存関係が明らかになり、迅速な障害特定を可能にします
特徴3 Digital Experience Monitoring
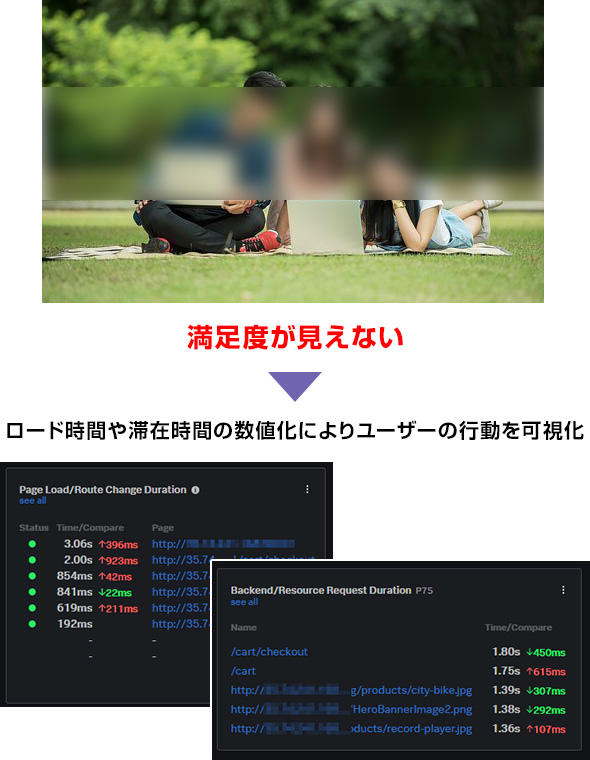
システムやサービス運用においてバックエンド側にあたるアプリケーションやインフラ環境の可視化も重要ですが、実際のユーザー側の行動やUI画面などフロントエンド側のシステムも監視することが重要です。
『Observability』は仕様変更や新規リリースがユーザー側に与える影響から普段のパフォーマンスまで監視することを可能にします。
Splunk Observability Cloud
フルスタックかつエンドツーエンドの観測を可能にする唯一の製品
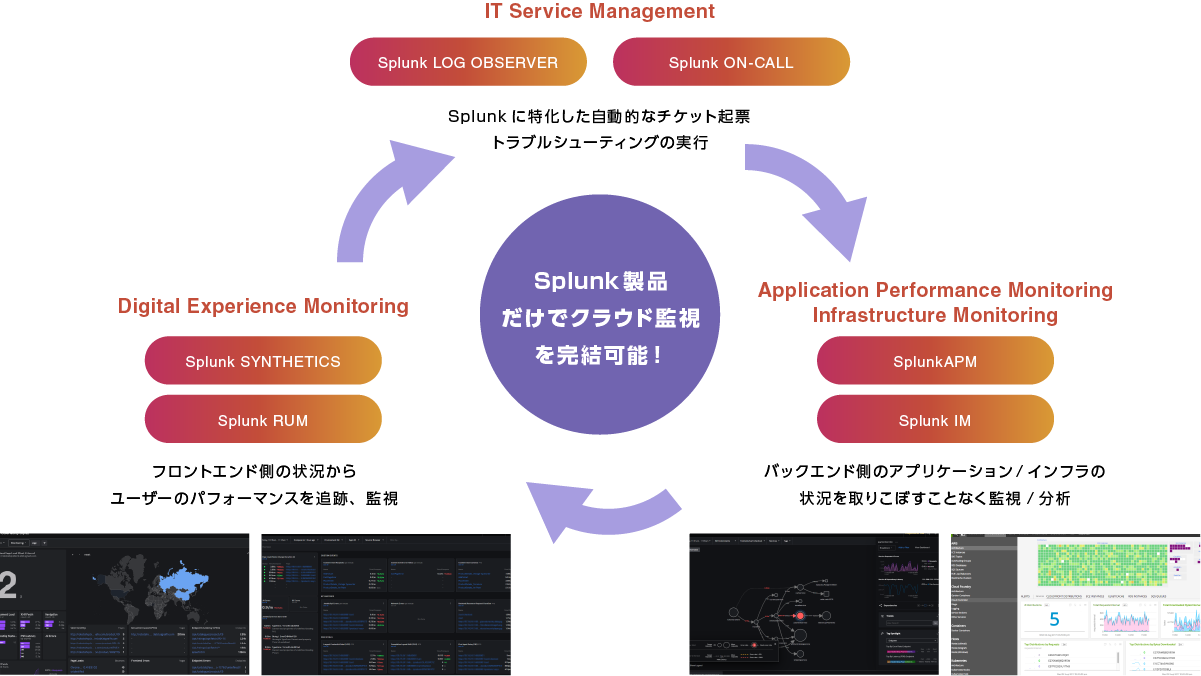
企業が直面する課題をすべて浮き彫りに
フロントエンドからバックエンドまでの全てを可視化
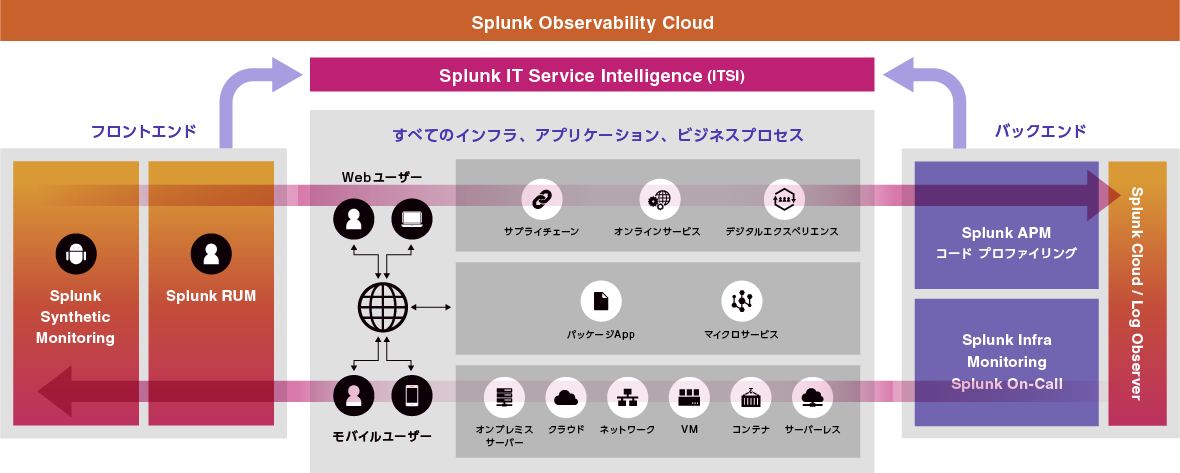
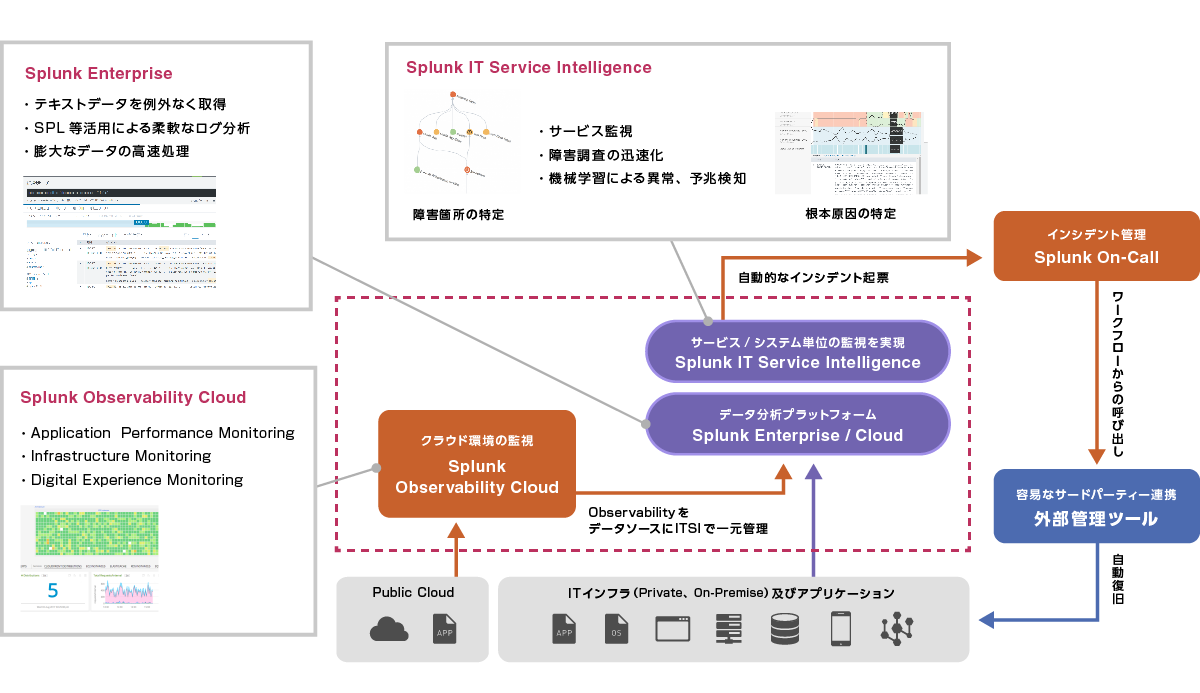
Splunkはオンプレ環境からクラウドネイティブまで包括的に監視することが可能
Splunkを核に、IT運用を高度化するソリューションを幅広くご提供いたします。
お問い合わせ・資料請求
株式会社マクニカ Splunk 担当
- TEL:045-476-2010
- E-mail:splunk-sales@macnica.co.jp
平日 9:00~17:00