product
- Why choose Splunk
- Installation record
- price
- Splunk Enterprise Security
- Splunk Phantom (SOAR)
- Splunk ITSI (Next Generation IT Operations)
- Splunk Observability Cloud
- Splunk UBA
- Macnica CSIRT App Basic
- App for Splunk for Financial Institutions
- Splunk Analytics for Hadoop
- About Apps
- Splunk Edge Hub
- What is Splunk
service
- Dashboard/SPL Creation Pack [Implementation/Building Support]
- Version upgrade service [implementation and construction support]
- Smart Security Monitoring App [Original App/Service]
- Splunk × LANSCOPE Original App [Original App/Service]
- Security Monitoring App for Box [Original App/Service]
- Cloud Security Monitoring App [Original App/Service]
- List of services
- Macnica Premium Support for Splunk (utilization support, version upgrade monitoring)
Specifications/Technical Information
Application for evaluation machine
- FAQ
Splunk
Splunk
Threat intelligence analysis dashboard
This dashboard automatically acquires open source threat lists and visualizes the results by comparing them with Splunk logs.
Internal Communication Threat Intelligence Matches Report
If there is a log that matches the threat information list in the internal log, the log list information that matches the number of matches is displayed.
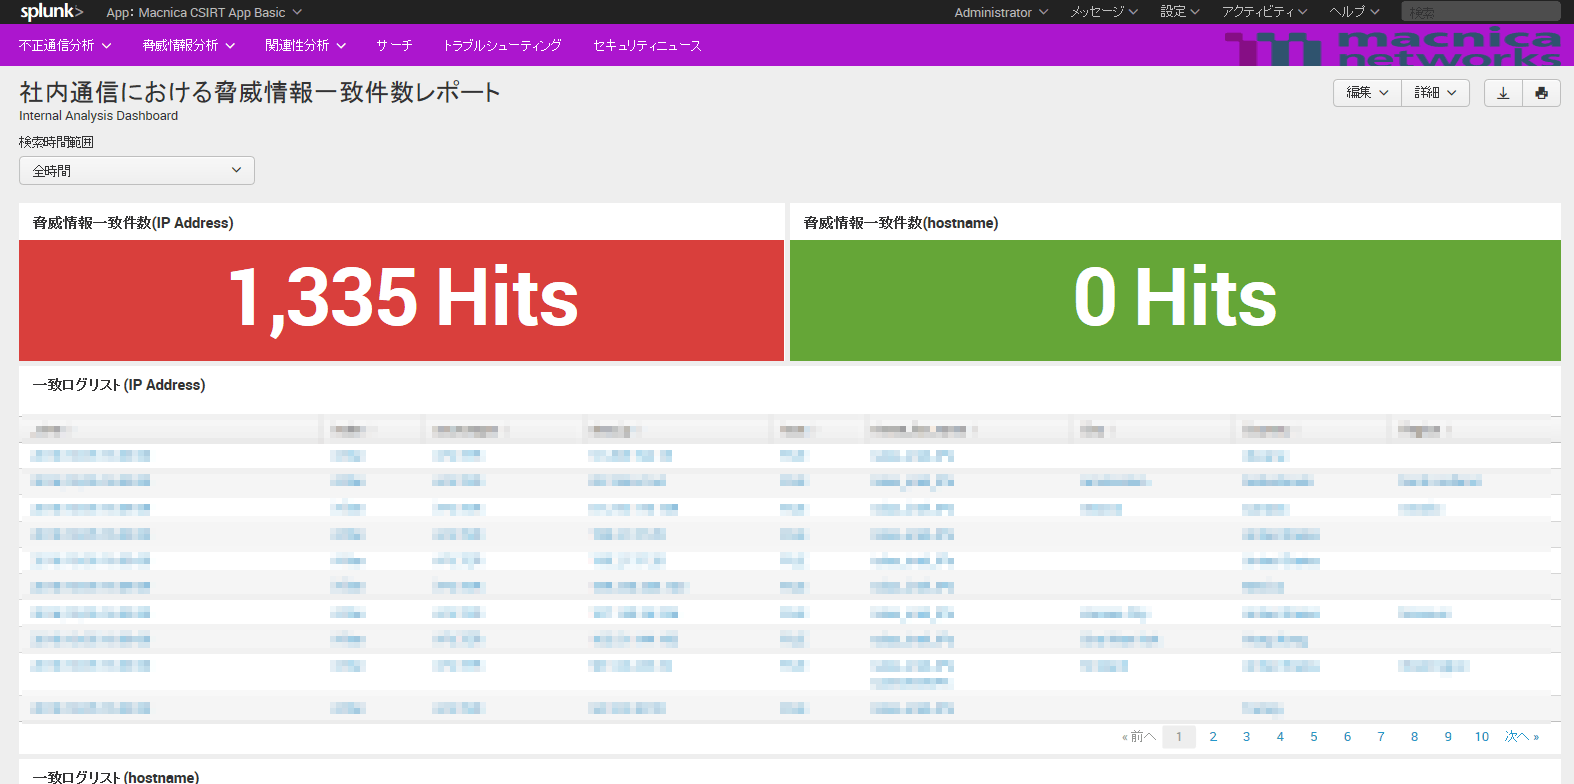
*For security reasons, the log information is mosaicked.
Threat information distribution map
Displays a list of TOP50 threat information lists and statistics by country
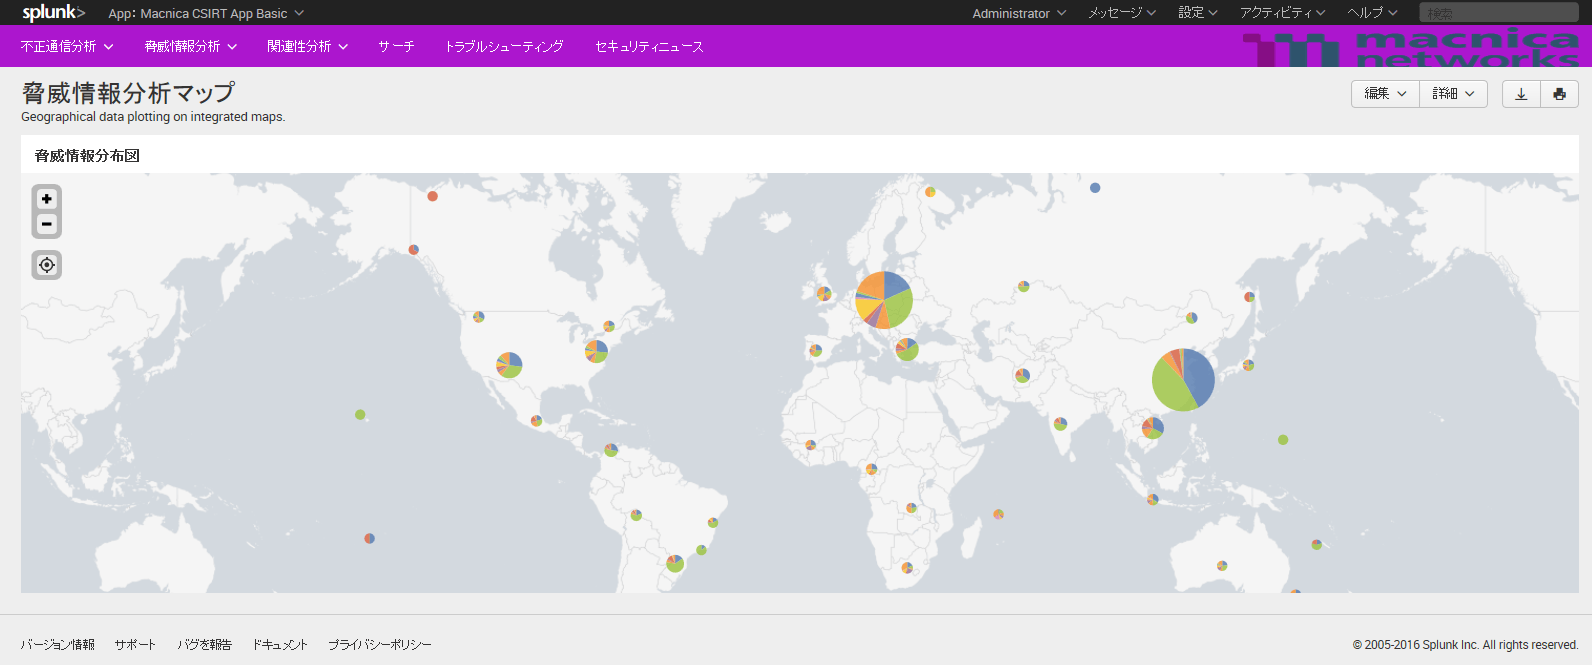
*This image is an image image using randomly generated sample data. It has nothing to do with the actual threat intelligence results.
Threat intelligence analysis report
Display the number of matches between the threat information list and Splunk's internal ingestion log
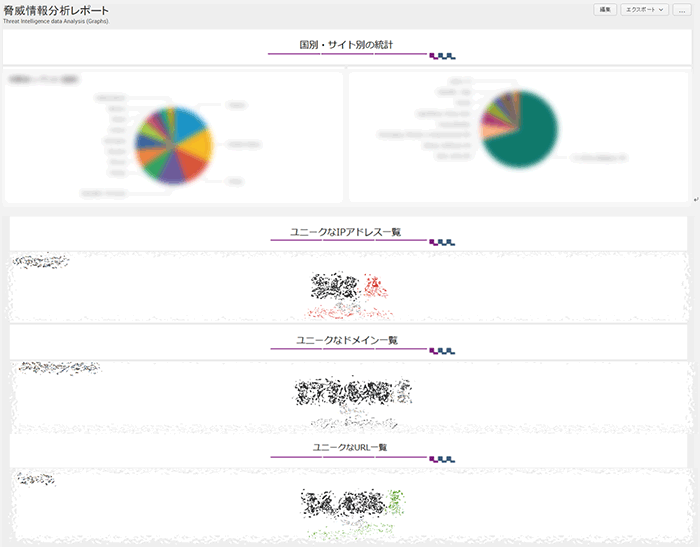
*For security reasons, the log information is mosaicked.
Threat intelligence analysis list
Display a list of regularly collected threat information and analysis information (by country, by collected site)
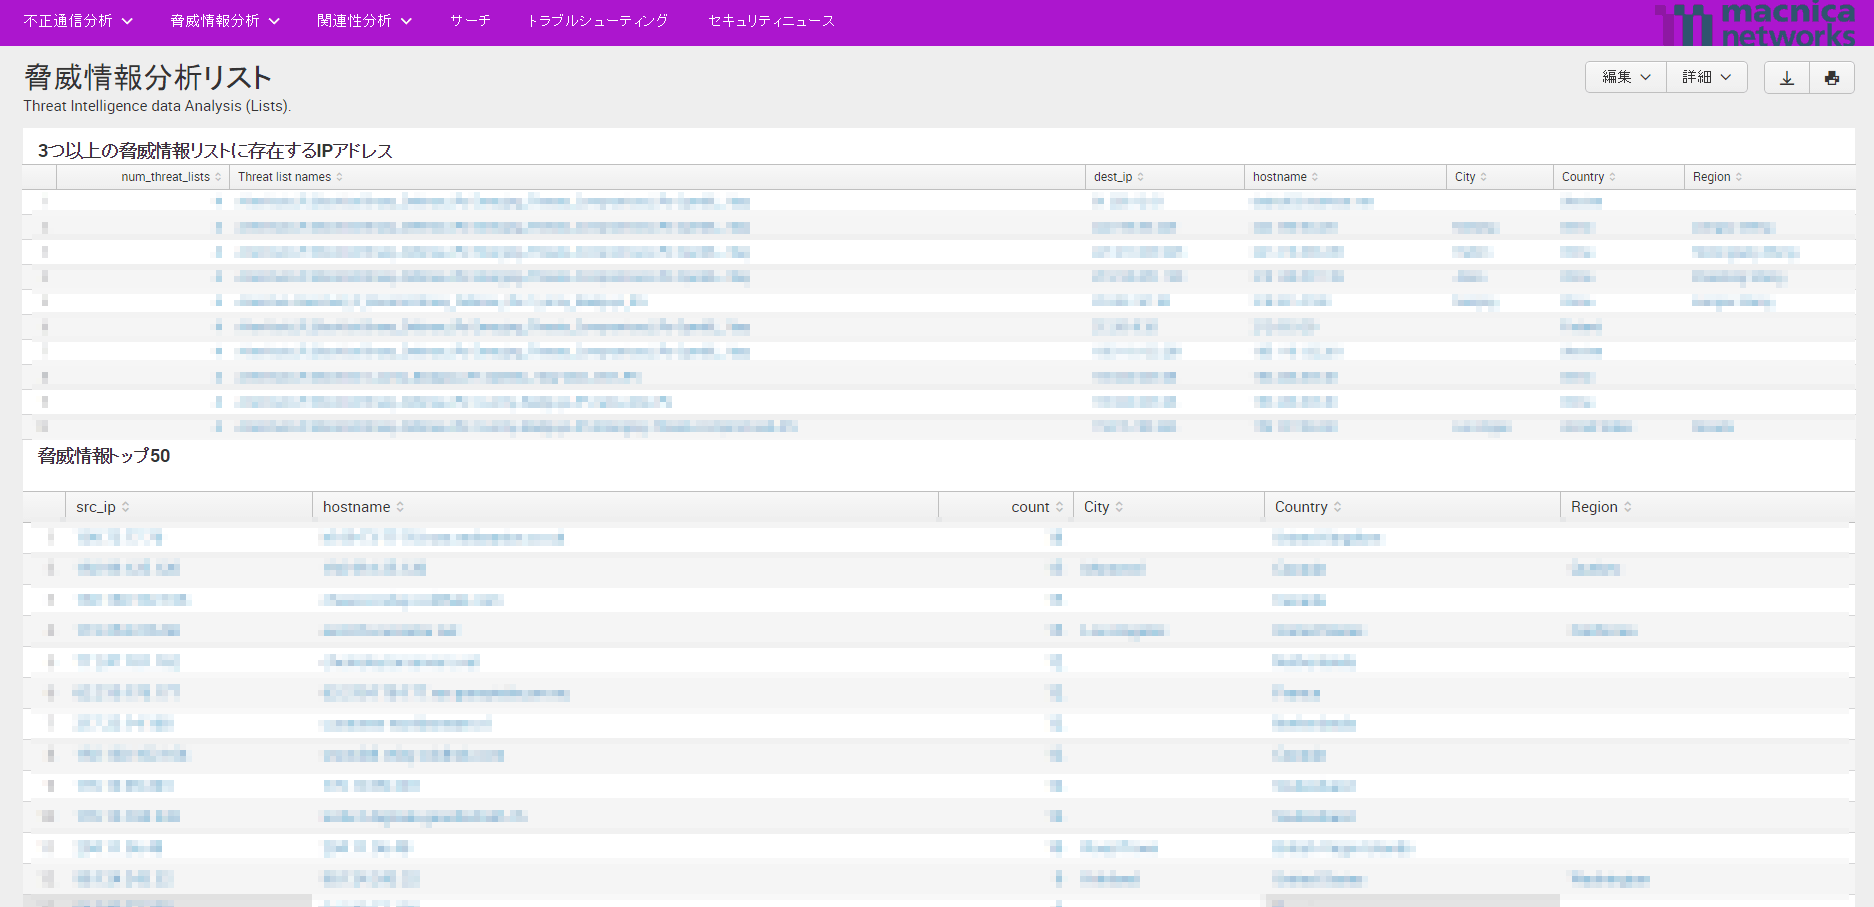
*Since this App uses Splunk's built-in location information, there is a possibility that the accuracy of the information may not be the latest. If you need to match with the latest information, you will need to obtain location information from a third party separately.
*For security reasons, the log information is mosaicked.
Fraud analysis dashboard
Fraud analysis dashboard
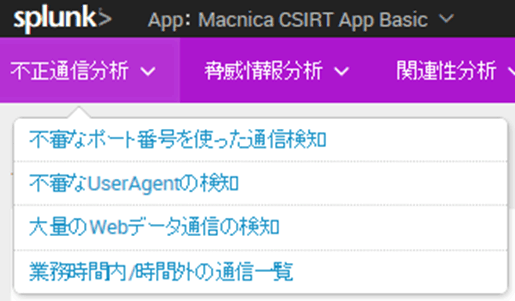
- Splunkでプロキシのログをセキュリティ観点で解析するための解析視点とそのご参考画面を複数提示しております。
- The analytical viewpoints and reference screens in this document are based on the published document "Log Utilization and Analysis Methods for Dealing with Advanced Cyberattacks" compiled by the JPCERT Coordination Center as a countermeasure against advanced cyberattacks. I'm here. https://www.jpcert.or.jp/research/apt-loganalysis.html
- The elements that must be included in the target log are:
- Client IP / HTTP Method / Destination Port Number / FQDN / User Agent / Received Bytes / Sent Bytes / Received Bytes
Fraud analysis dashboard
- Web proxy logs contain records of communications from PCs to websites, which may contain useful information for finding traces of cyberattacks. Analysis of proxy logs is one of the effective means for discovering and analyzing threats and considering countermeasures.
- To achieve the goal, the following conditions must be met
- Proxy logs can be properly stored and searched → Can be realized with Splunk standard functions
- Periodic confirmation of proxy logs and visualization of normal conditions are possible (visualization of abnormal conditions from fixed point observations). In addition, it is possible to grasp the contents (fields) to be viewed from the proxy log → Development is required with Splunk's report and dashboard functions
Analysis view example 1 (detection of communication using an unexpected port)
- Analysis point of view: Detect communication of CONNECT method using unexpected port
- Purpose: Check for unauthorized relay communication on an unexpected port using the CONNECT method
- Operational image: Monitor ports other than port numbers 80 and 443
- Check the in-house software in advance to avoid confusion as there is also software that uses dynamic port allocation in the customer's company.
- Is it funny then? If there is a port that is judged to be
Communication detection using suspicious port numbers
- List of suspicious HTTPS port numbers
- Show ports other than 443 using CONNECT method
- List of access destinations using suspicious HTTPS port numbers
- Displays the time, source IP, and communication destination of the port number clicked in the "Suspicious HTTPS port number list"
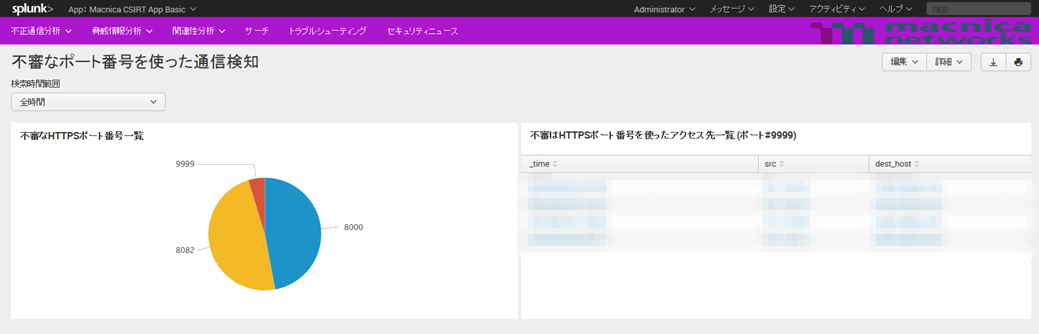
*For security reasons, the log information is mosaicked.
Proxy log analysis viewpoint example 2 (anomaly monitoring by fixed point observation)
- Purpose: Investigate unauthorized communications based on UserAgent, number of communications per hour, and web data traffic volume
- Operation image:
- Visualize UserAgent and observe fixed point
- Monitor for unexpected access outside business hours and investigate what users of that communication are using
- If there is a certain amount of communication even in the middle of the night, investigate what the user (or terminal/server) of that communication is using
- Monitor the amount of communication data for each access destination, and investigate communications that transfer large amounts of data to unexpected access destinations
Suspicious UserAgent Detection
- UserAgent list via Proxy
- Constantly checking UserAgents that pass through Proxy helps to identify unauthorized UserAgents.
- UserAgent with many/few users
- It is useful for understanding UserAgents that are usually used and UserAgents that are not usually used.
- Time chart of access destinations accessed by suspicious UserAgent
- Displaying UserAgent access destinations (time chart) is useful for investigating unauthorized access destinations.
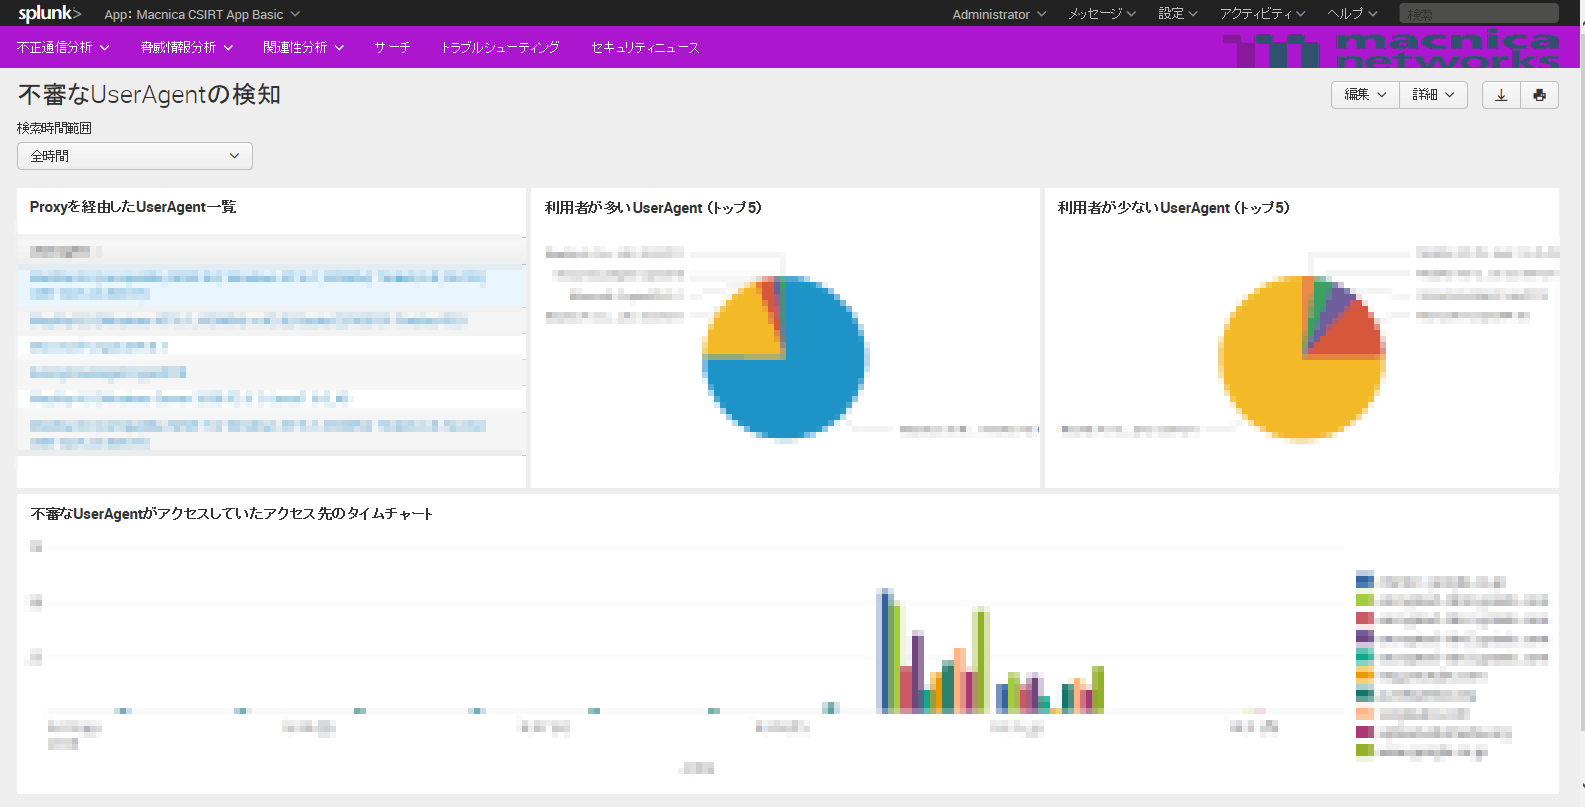
*For security reasons, the log information is mosaicked.
Detecting large amounts of web data traffic
- List of data volume statistics for each access destination
- Displays the number of bytes sent and received at the access destination in descending order of data volume.
- List of sources and data volume of suspicious access destinations
- View detailed information for suspicious recipients
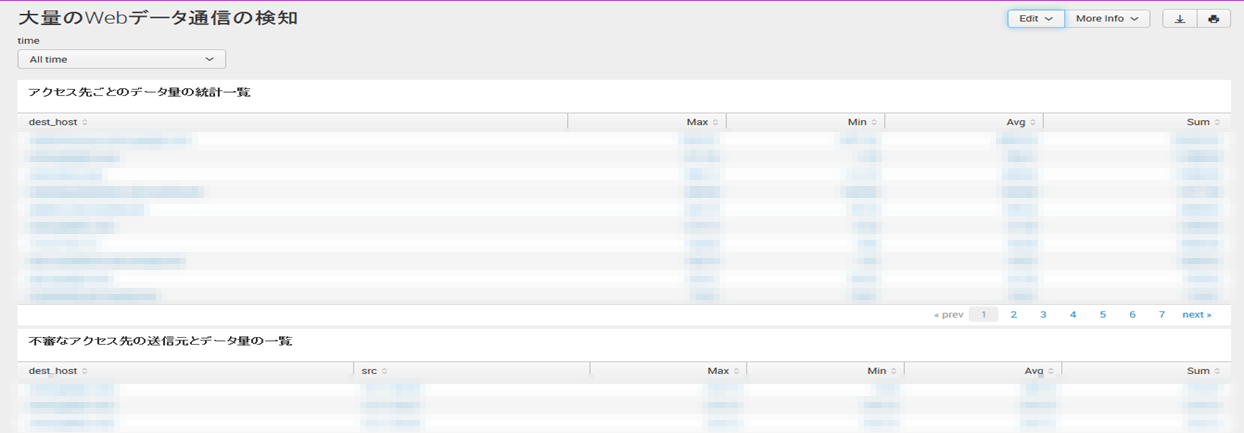
*For security reasons, the log information is mosaicked.
List of communications during business hours/outside hours
Display communication destinations for each domain by date (check if communication that cannot occur outside business hours occurs)
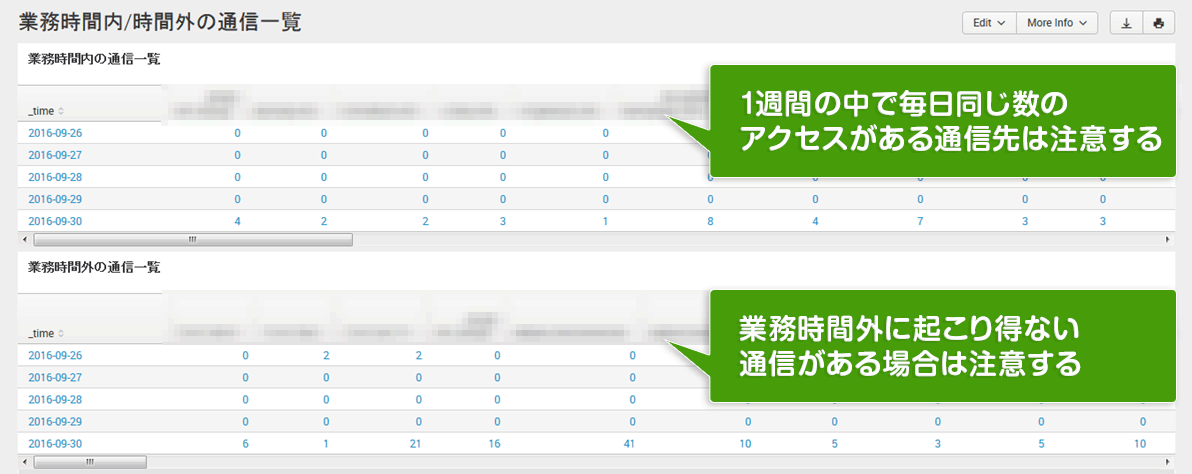
*For security reasons, the log information is mosaicked.

Weekdays: 9:00-17:00


Inquiry/Document request
In charge of Macnica Splunk Co., Ltd.
- TEL:045-476-2010
- E-mail:splunk-sales@macnica.co.jp
Weekdays: 9:00-17:00