product
- Why choose Splunk
- Installation record
- price
- Splunk Enterprise Security
- Splunk Phantom (SOAR)
- Splunk ITSI (Next Generation IT Operations)
- Splunk Observability Cloud
- Splunk UBA
- Macnica CSIRT App Basic
- App for Splunk for Financial Institutions
- Splunk Analytics for Hadoop
- About Apps
- Splunk Edge Hub
- What is Splunk
service
- Dashboard/SPL Creation Pack [Implementation/Building Support]
- Version upgrade service [implementation and construction support]
- Smart Security Monitoring App [Original App/Service]
- Splunk × LANSCOPE Original App [Original App/Service]
- Security Monitoring App for Box [Original App/Service]
- Cloud Security Monitoring App [Original App/Service]
Specifications/Technical Information
Application for evaluation machine
- FAQ
How to display numerical values in % on a pie chart
- release date
- 2018-06-18
- last updated
- 2018-06-18
- version
- Splunk Enterprise 6.4.1
- Overview
- Use the eval command or dashboard options to display % values on the pie chart.
- Reference information
-
- About the eval command
- About dashboard options
- content
-
If you want to display the values on the pie chart when viewing the search results in the visualization tab, you will need to construct the search statement to display the values after each value item.
(Search example)
index=_internal | top 5 component | eval percent=round(percent, 2) | eval component=component.", ".count.", ".percent."%"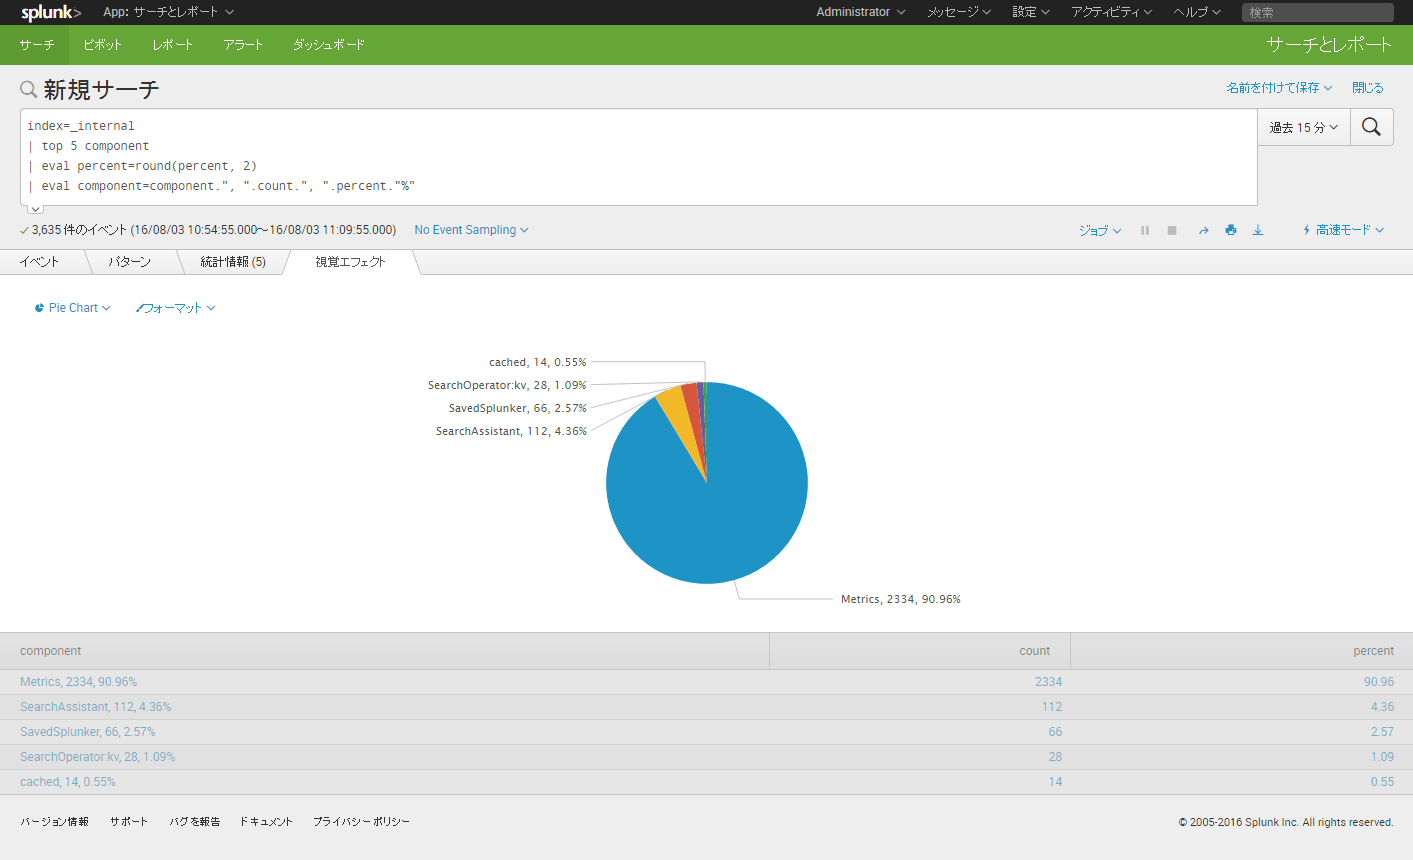
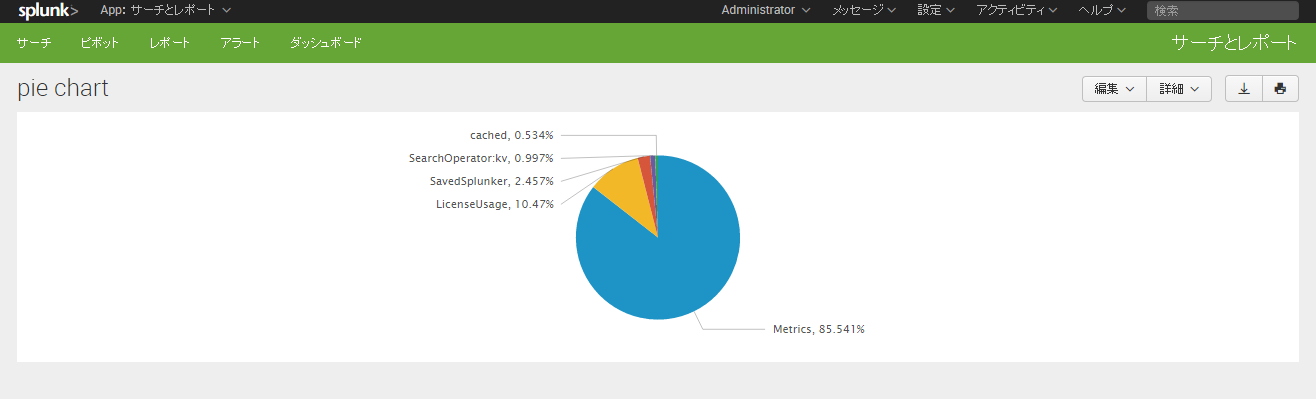
The following options for displaying % values are available on the dashboard:
<option name="charting.chart.showPercent">1</option>
By adding this to the xml, it is possible to display the % value on the pie chart.
Note that this method only displays values up to the third decimal place, so if you want to change the number of digits displayed, use the eval command's round function, etc., to display the value as shown above.
that's all
In charge of Macnica Splunk Co., Ltd.
- TEL:045-476-2010
- E-mail:splunk-sales@macnica.co.jp
Weekdays: 9:00-17:00