
Time series data analysis software Sigma
Sigma is time-series data analysis software developed by industrial equipment condition diagnosis experts who actually analyze sound and vibration data. Designed based on many years of experience in diagnosing time-series data, it manages a large amount of measurement data with a simple interface and enables detailed analysis such as confirmation of waveforms, frequency spectra, and feature values of each measurement data. .
Features of Sigma
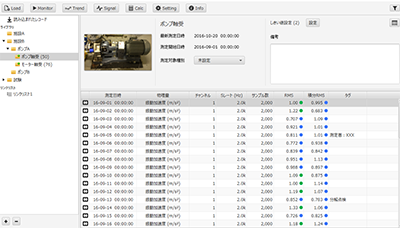
01 Intuitive data management
Measured data loaded into Sigma can be managed intuitively by using general file operations such as drag and drop using folders that can be created within the application.
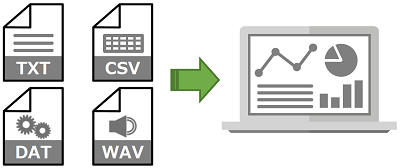
02 Flexible data loading function
Data in various formats measured by various equipment can be read. Furthermore, audio data in WAVE format can also be read. Each imported data is managed as a record.
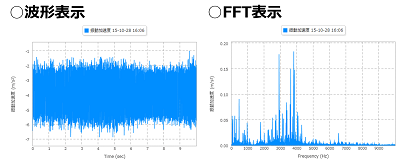
03 Signal display with easy operation
By double-clicking the record, you can display the waveform of the time-series data. In addition, the waveform can be expanded/reduced/translated by mouse operation, and the frequency spectrum can be switched with a single button.
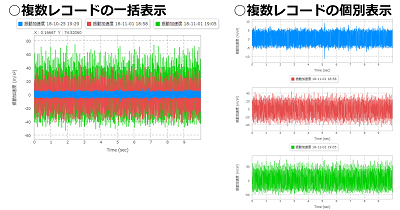
04Variety of signal display functions
In addition to being able to display multiple records in one graph area, you can also display them in separate graph areas on a single window. Detailed customization such as changing the drawing color is also possible.
05 Powerful signal processing functions
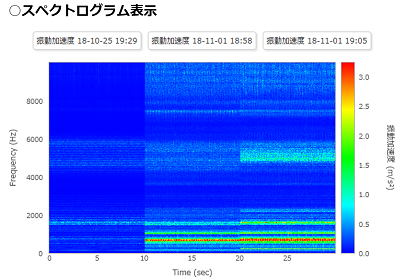
It is possible to perform advanced detailed analysis using various signal processing such as bandpass filter, envelope, and autocorrelation. You can also intuitively compare signals in the spectrogram.
06Feature value and trend display
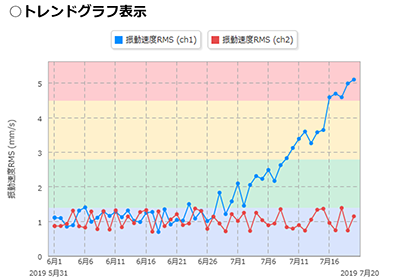
In addition to being able to calculate basic feature values such as RMS and average values, users can also define their own feature values with simple operations. In addition, it is possible to display trend graphs of feature values and judgment results based on threshold values.
Monitoring function
Sigma is compatible with Macnica 's data collection terminal (SENSPIDER), allowing real-time monitoring of equipment. Real-time monitoring is also possible with other loggers that can export data in text format such as CSV.
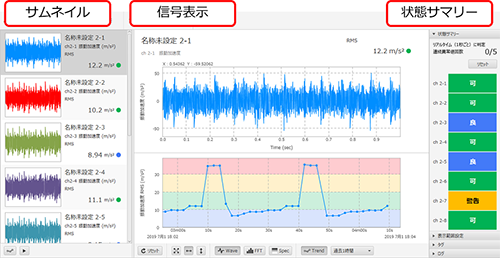
On the monitoring screen, you can check the signal waveform, FFT, and spectrogram in real time.
In addition, trend graphs of feature quantities such as RMS can be displayed, and changes in the status of the device being measured can be checked as a trend graph.
If a threshold is set, the judgment result is displayed in real time for each data measurement.
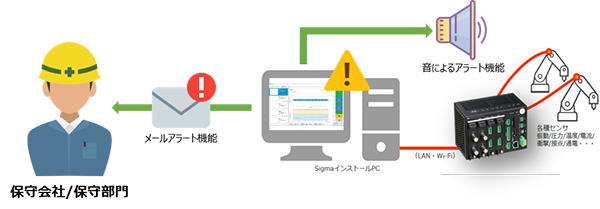
Configuration example of Sigma/SENSPIDER

AI module function
The Sigma AI module can evaluate the difference between the reference data set (normal data set) and the evaluation target data using machine learning.
By performing evaluations that take into account variations and correlations of the parameters that make up the reference data set, more advanced anomaly detection becomes possible compared to simple one-parameter threshold monitoring.

The left figure is an example when one sample has two parameters and there is a positive correlation between them.
The green ellipse is the contour line of the evaluation value of the MT method (how far away from the reference data set).
Since the contour line is an ellipse that reflects the correlation (angle) and variation of the two parameters, it can be determined that B is more abnormal than A.
Separate threshold monitoring for each parameter does not allow such an assessment.
Alert function
Sigma can set an alert function that can send an email notifying an abnormality to the administrator or notify an abnormality with a sound when the monitored data exceeds the threshold. Alert conditions can be customized by the user. This enables proactive maintenance.
Sigma use case
1. Utilization in factories ①
— Real-time monitoring of critical equipment —
Measured data loaded into Sigma can be managed intuitively by using general file operations such as drag and drop using folders that can be created within the application.

2. Utilization in factories ②
— Tradition of diagnostic technology —
When qualitatively diagnosing information such as vibrations, abnormal noises, and heat emitted by equipment using the five senses, the results are influenced by the skill of the person making the diagnosis. By measuring the information emitted by the device with a sensor and analyzing it with Sigma, it becomes possible to grasp the device status quantitatively.
3. Utilization in research and development
By logging the vibrations generated during the operation of the equipment with a data logger such as SENSPIDER and analyzing it with Sigma, it can be used to evaluate the operating state and durability of the product. By feeding back the analysis results to the product design and manufacturing process, it is possible to research and develop highly reliable products.

4. Utilization in quality control
In the inspection process before product shipment, you can immediately check the operating status by logging the data measured by various sensors such as vibration with a data logger such as SENSPIDER and evaluating it in real time with Sigma. You can check the quality quantitatively, so you can keep the quality uniform. In addition, since confirmation is possible during the inspection process, the time required for offline data evaluation can be shortened.
5. Management and detailed analysis of time-series data
You can manage time-series data measured by portable measuring instruments, check trends, and perform detailed analysis such as FFT.
Sigma operating environment
| Compatible OS | Microsoft Windows 10/8.1/8/7/Vista 64bit, 32bit |
|---|---|
| CPU | Intel Core 2 Duo or higher recommended |
| memory | 1GB or more recommended |
| ライセンス認証 | Authentication by Internet connection Authentication by USB dongle (when used without internet connection) |