Acquire air supply status data at each location with a wireless sensor
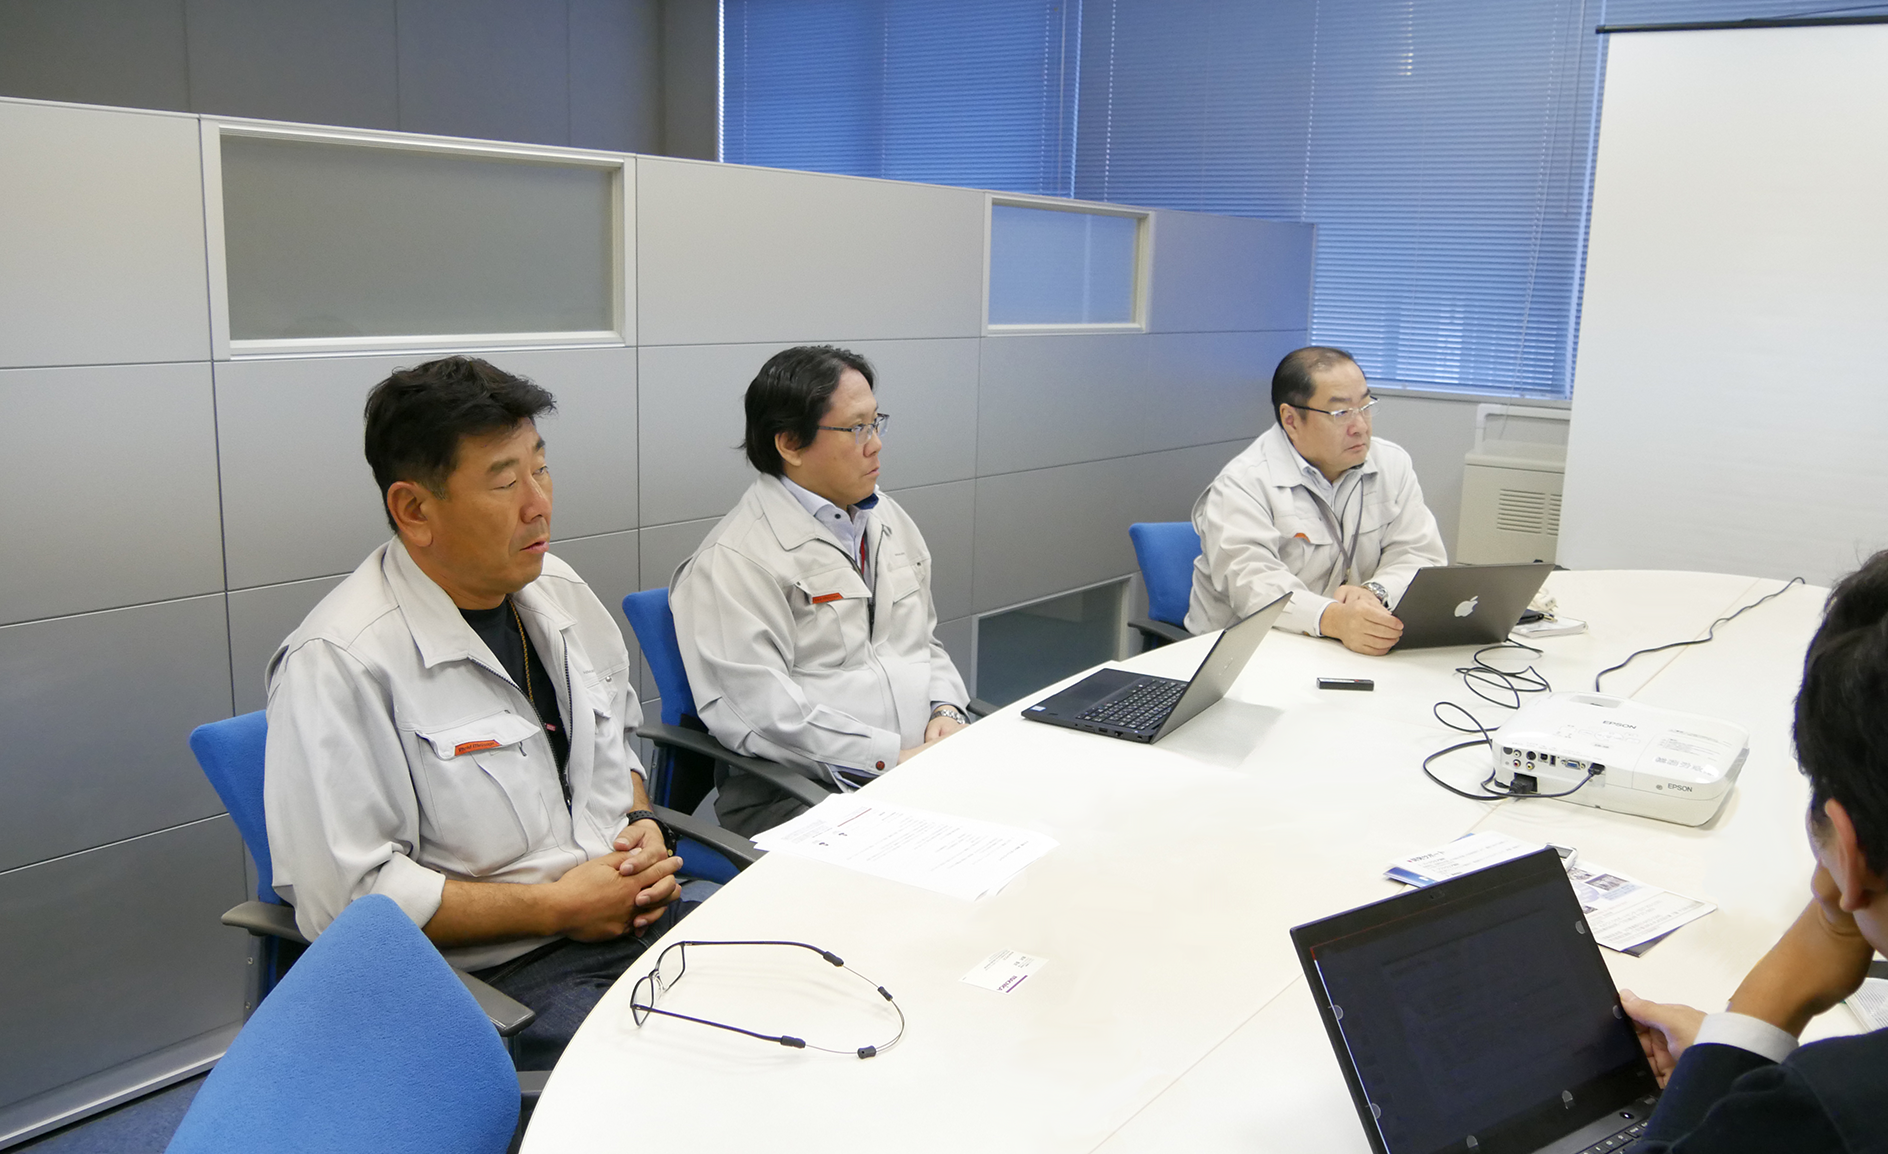
―Please tell us how you worked to solve the problem.
Mr. Kobayashi: First, I wanted to monitor the air supply status correctly. I decided to start by making it possible to view data digitally in real time even remotely.
So I consulted Macnica.
-Could you tell me why you asked Macnica?
Mr. Mogi: Macnica is a trading company that handles semiconductors and network/security related products, and we have been doing business with them for a long time.
During our relationship, I heard that they provide IoT and AI solutions and services for the manufacturing industry, so I decided to consult with them.

Mr. Motegi
Mr. Kobayashi: First, we had to verify what data we could collect to determine the air supply status.
While consulting with Macnica, which has sensing know-how, we hypothesized that the condition could be determined by looking at the pressure and flow rate, and decided to install a pressure sensor and a flow rate sensor.
I decided where to install the sensors, and I asked Macnica to select the appropriate sensors for each location and visualize the data.
―Please tell us where the sensors are installed and how they are configured.
This time, we decided to acquire data in the injection process. This is because air is used during the operation of the molding machine, an air gun is attached for cleaning, and it is easy to install pressure sensors and flow sensors.
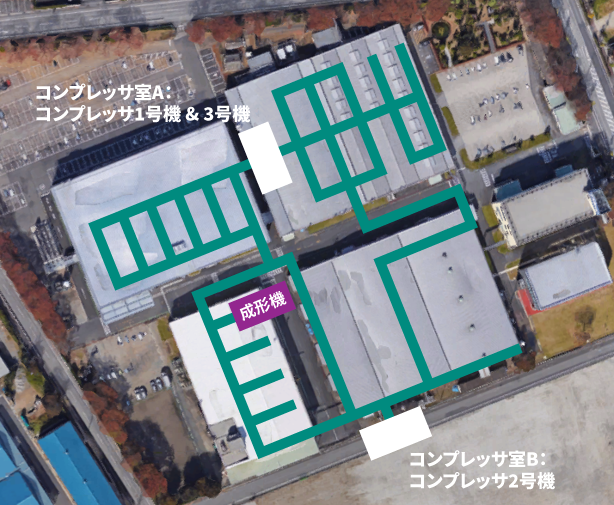
▲Compressor room and air piping diagram to the factory
Four pressure sensors were attached to the air pipes.
As you can see in the figure, it is installed at the branch point between the 1st and 2nd floors in the molding process building, in front of the molding machine on the 1st floor, on the way to the 2nd floor, and just in front of the air gun on the 2nd floor. to measure usage.
There are three flow rate sensors, one on the 1st floor where the molding machine operates, one on the air gun attached to the molding machine, and one on the 2nd floor just in front of the air gun.
In order to acquire the timing of the molding machine operation, we made it possible to acquire the machine operation signal as well.
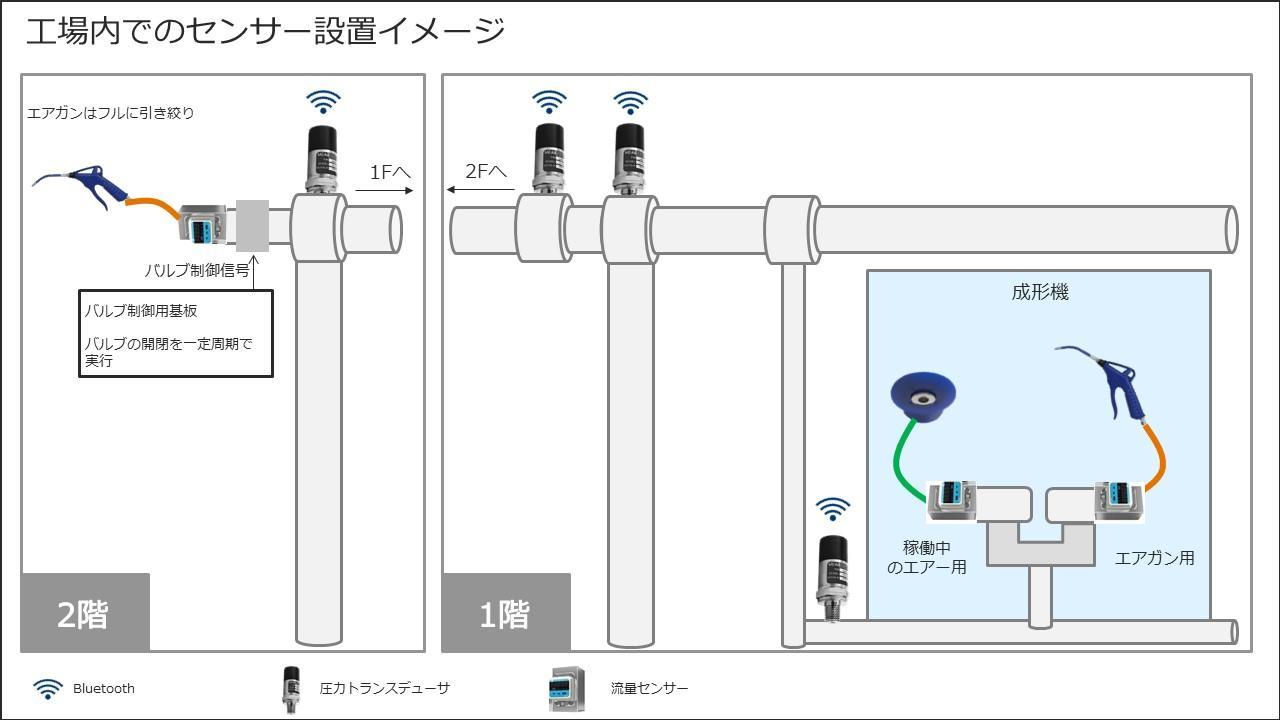
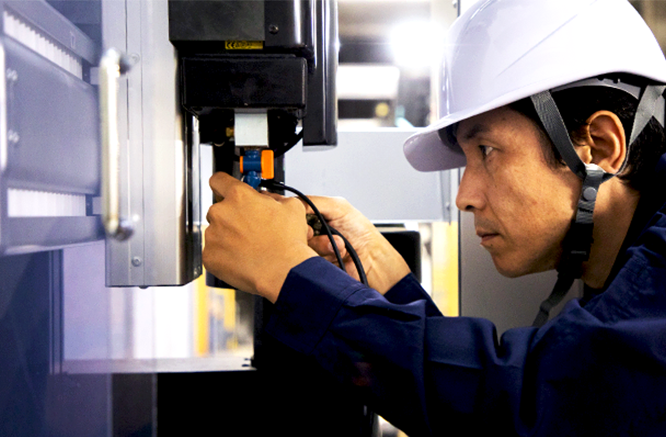
▲Sensor installation image in the factory
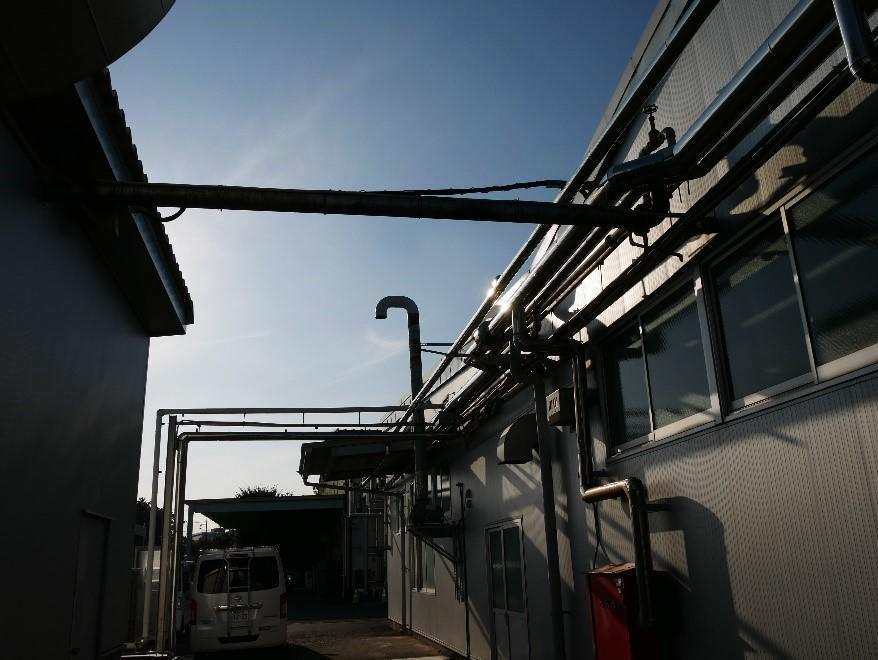
▲ Air piping extending from the compressor room
―Could you tell us why you chose a wireless sensor?
Mr. Kobayashi: Because the floors of the factory are separated, in the case of a wired system, we had to wire hundreds of meters, which was not realistic.
However, I didn't know how wireless would affect existing equipment, so if there was an impact, I was convinced that the worst case would be to switch to wired, but as a result of verification, it did not affect existing equipment. I was relieved to be able to take data wirelessly without giving it.
How to realize data visualization?
―Please tell us more about the system configuration.
Asami: Regarding the system configuration this time, pressure is transmitted via Bluetooth, flow rate and machine operation signals are transmitted via Wi-Fi, received by a Bluetooth router and wireless access point, and transmitted to an industrial PC.
Real-time data processing software is installed on the Industrial PC, and by accumulating data on pressure, flow rate, and machine operation signals, it is configured to display the operation status in real time.
The pressure sensor uses a wireless product with built-in Bluetooth. A Cassia Networks Bluetooth router (E1000, X1000) was used for Bluetooth reception.
The flow rate sensor uses an analog output (4-20mA) product, and the machine operation signal acquires a contact signal from Nakayo's operation information collection device NT920-IB.
A wireless compatible remote IO was used to wirelessize analog signals and contact signals. Reception uses a general-purpose access point.
In addition, the Bluetooth router communicates with MQTT and WiFi signals using different protocols than Modbus/TCP, and FogHorn is used to process signals of different protocols in real time.
See below for the configuration diagram.
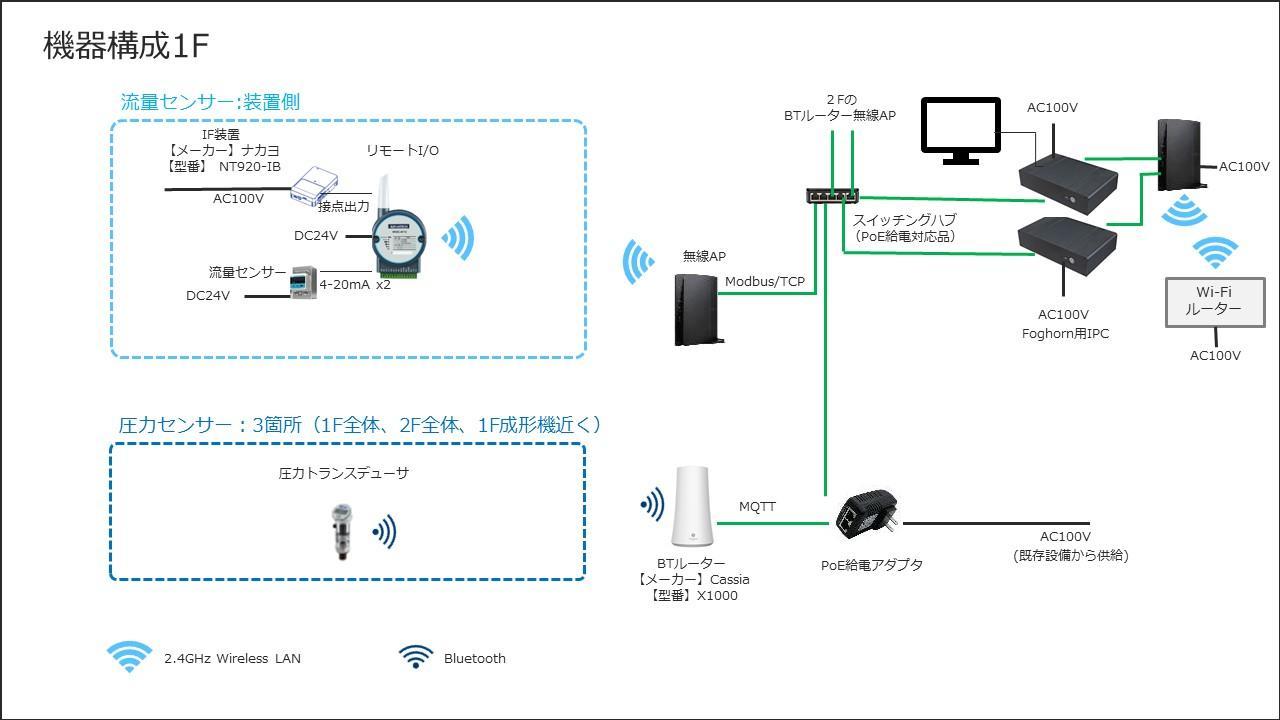
▲Configuration diagram 1st floor
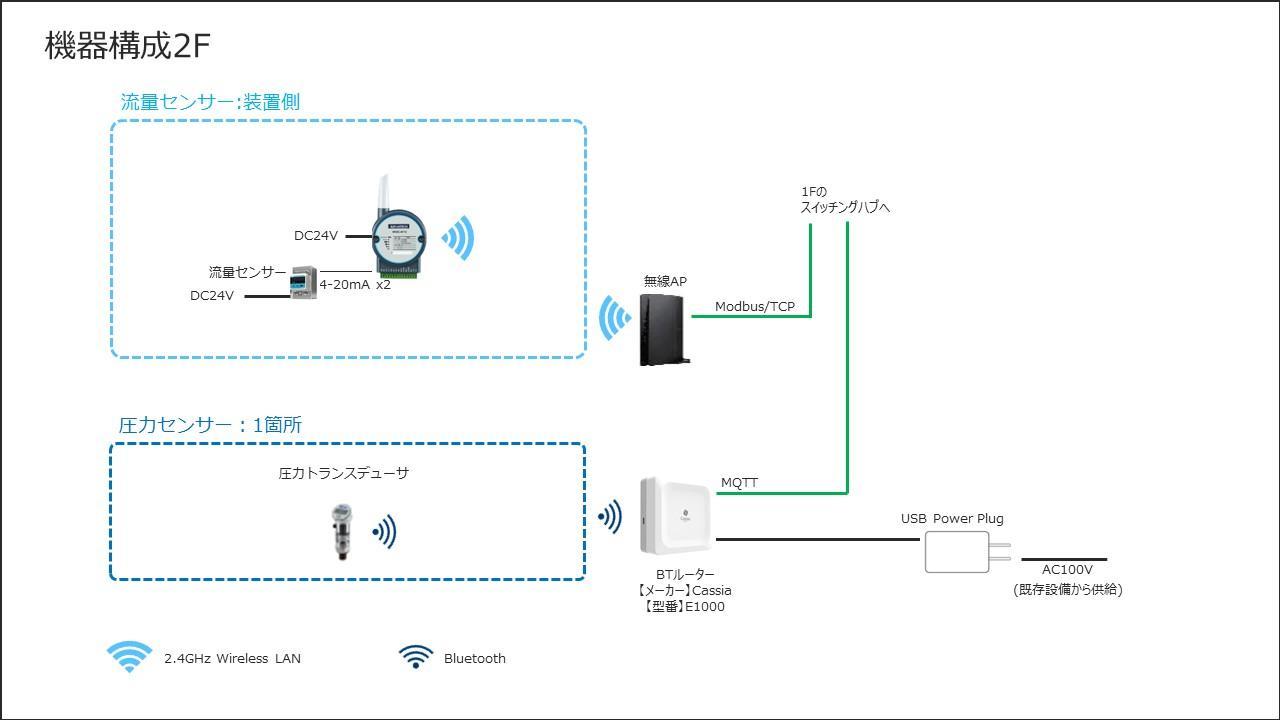
▲Configuration diagram 2nd floor
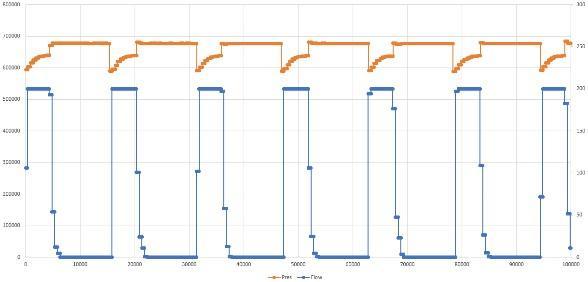
Asami: As a result of the measurement, we could see pressure fluctuations.
Since the pressure is controlled at a constant value (0.69 MPa) by the compressor, we assumed that the pressure change might not be visible, so we tried to acquire the flow rate data as well. We were able to obtain data in which the was changed by about 0.1 MPa. Since we could see the pressure drop due to the air gun, we decided that we could grasp the condition without obtaining the flow rate.
In addition, we found that there was no significant difference in the numerical values of any pressure sensors installed in the same building.
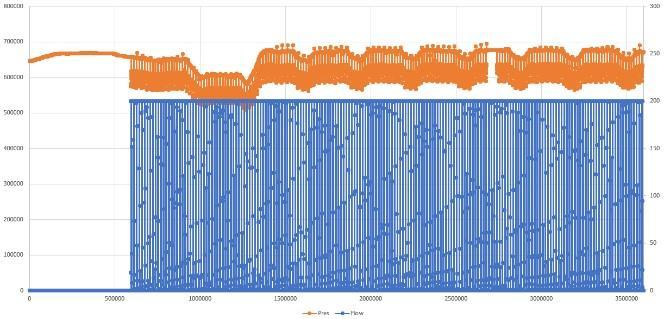
▲Flow rate/pressure data The orange graph is the pressure, and the blue graph is the flow rate.
―So you found out that the air condition can be visualized with just a pressure sensor, and that there is no change anywhere within the same building.
I think that the data has been visualized with this, but what can be done in the future to solve the problem of the air suddenly stopping?
Mr. Kobayashi: In this demonstration experiment, we found that air is often used in air guns. However, even with several air guns, the pressure in the entire building did not drop much, and it was found that there was almost no effect on the equipment.
At first, I thought that the usage rate of air guns was related to this problem, so this result was different from what I expected.
I was able to determine from the data that something unexpected was happening for some reason, so I knew I had to think of a different approach.
-I see. The ability to see data will change the approach to problem solving.
Mr. Mishima: Stable operation of the compressor may not be achieved unless the operation status of the entire factory, the operation status of the compressor, and the pressure data of each air pipe are combined.
However, it is difficult to implement everything at once. The problem will change when the data becomes visible like this time.
I would like to start from where I can step by step and move forward steadily.
-thank you. Lastly, could you tell us the important points for advancing the smart factory?
Mr. Mishima: Even if we obtain information, nothing will change unless we take action. It is important to set goals, analyze the data obtained, discover problems, and make improvements.
Also, since there is concern about a shortage of human resources in the future, we believe that it is necessary to promote automation.
―Thank you for sharing your valuable story with us!
We will continue to work with Nakayo to solve the problem in order to "conserve power and prevent air supply stoppages to production equipment tools."
Stay tuned for the next article!
Related article

Nakayo Co., Ltd. case study
Part 1: Aiming for stable supply of air and energy saving
Sensor consulting service