こんな方におすすめの記事です
- 工場設備のデータ収集やその利活用を検討・導入されている方
- マクニカのデータ収集ソリューションに興味がある方
この記事を読み終えるのにかかる時間
5分
はじめに
こんにちは!マクニカ イノベーション戦略事業本部の桜庭です。
前回は収集したデータの利活用のひとつとして、収集データを現場で可視化することを紹介しました。
今回はクラウドを用いた活用についてお話したいと思います。
なぜデータ基盤のクラウド化が必要なのか?
前回お伝えした通り、現場におけるデータの可視化は生産現場の意思決定や改善活動に役立ちますが、工場全体の製造における改善を考えるとそれだけでは不十分です。
複数の設備や工程からなる製造ラインや工場全体の状況を把握するには、それぞれの設備・工程の情報を統合して一元管理する必要があります。
また、ライン全体・工場全体で生産状況を把握・分析する際には、現時点での瞬間的な情報だけでなく、これまでの生産実績が必要になります。
このように、複数のデータソースから収集したデータを蓄積し、分析や改善活動に利活用するためにはクラウド環境を構築・利用することが不可欠だと考えています。
もちろん、自社で運用するいわゆる「オンプレミス環境」でデータを蓄積し、利活用することも可能ですし、多くの製造業のお客様は従来オンプレミス環境で運用されていたかと思います。
確かにオンプレミス環境であれば、システムを自社にとって使い勝手がいいようにカスタマイズできたり、社内システムとの連携や統合がしやすかったりと、メリットもあります。
しかし、企業が保有するデータ量が増え続けている昨今において、多くの時間と多額の初期費用を投じて自社内に環境を構築し、長期にわたって自社で管理し続けるオンプレミス環境よりも、環境の維持・管理が不要でリソースを柔軟に拡張できるクラウド環境を利用するほうが、本来注力するべきデータの分析や分析結果に基づく改善活動に時間を費やすことができ、効率的だと考えています。
マクニカのデモ工場でもやってみた! ~クラウドへのデータ蓄積~
ということで、今回はデモ工場の生産状況に関するデータをクラウドに蓄積してみました。
前回、現場での可視化の際に計算したOEE(Overall Equipment Effectiveness、総合設備効率)という指標をOPC UA(※1)経由でクラウドに吸い上げて時系列データとして表示してみました(図1)。
(※1)産業機器間のデータ交換の通信プロトコルのひとつ。
▼ 図1:デモ工場のOEE および関連する各種パラメータ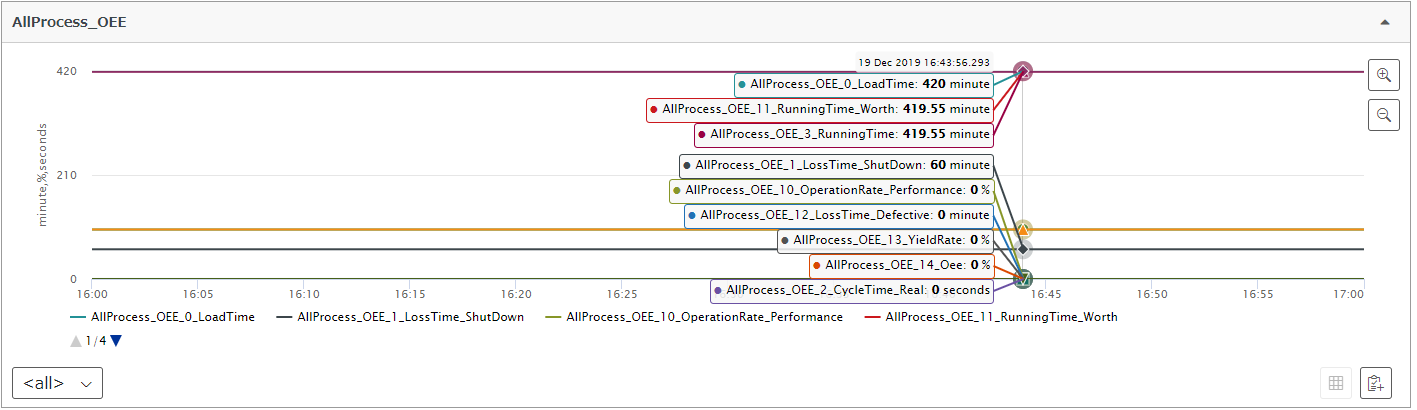
今回、蓄積したデータのソースが1ラインのOEE 関連のパラメータのみで、かつデータ自体が変化のないデータなので伝わりづらいかもしれませんが、このように蓄積された一定期間のデータを時系列で表示することで、経過時間によるパラメータの傾向が見えたり、複数のパラメータの相関関係が発見できたり、さまざまな分析・改善活動につなげることができます。
データから見る、改善に向けた要因分析
クラウドに蓄積したデータを利活用するひとつの方法として、クラウドでの可視化とそこから見えてくる要因分析があげられます。
ひとつの設備や工程のデータをリアルタイムに見るのであれば、現場側で可視化することが求められるでしょう。
一方で、複数の設備や工程のデータをまとめて確認したり、現在値だけでなく過去のデータも含めて確認したりする場合は、クラウドで蓄積したデータをもとに可視化をすることが求められます。
例えば、シフトごとの生産数や稼働率を確認したり(図2)、設備の停止要因ごとの停止時間・回数の推移を確認したり(図3)することができます。
▼図2:設備稼働状況画面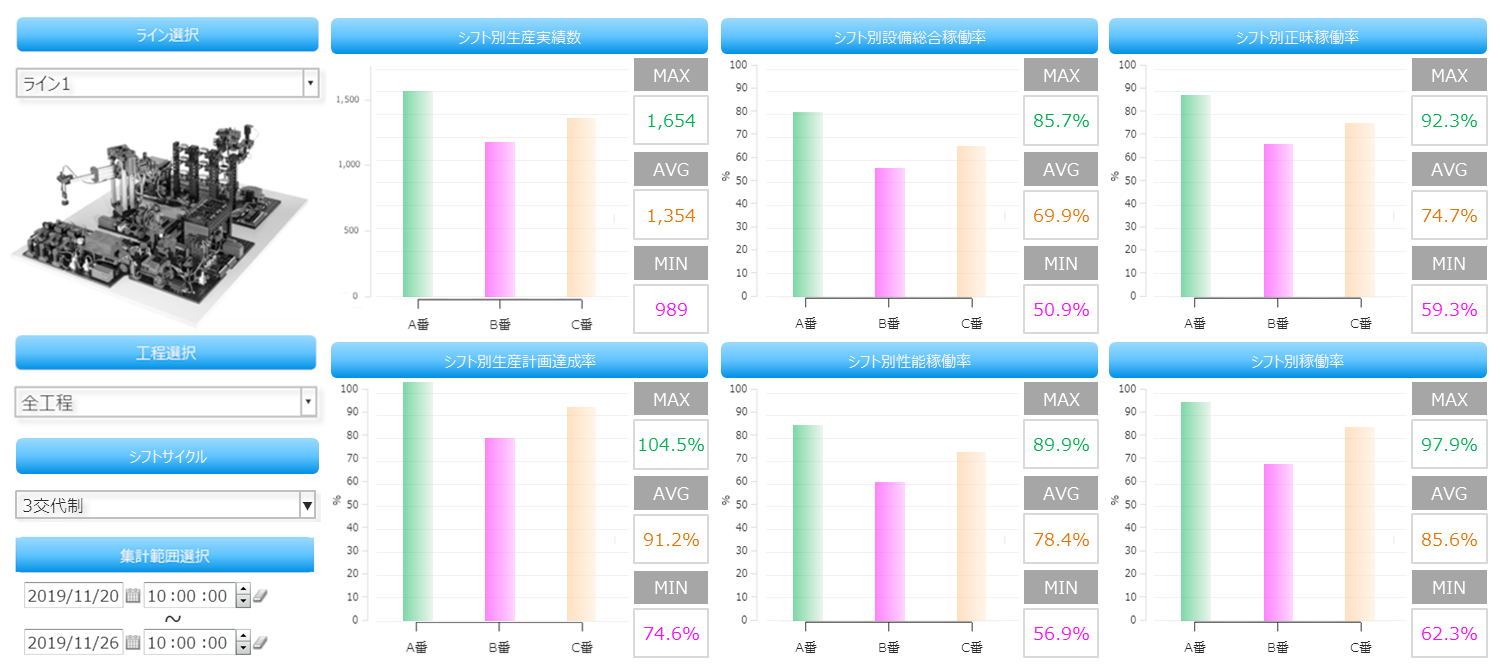
▼図3:停止要因画面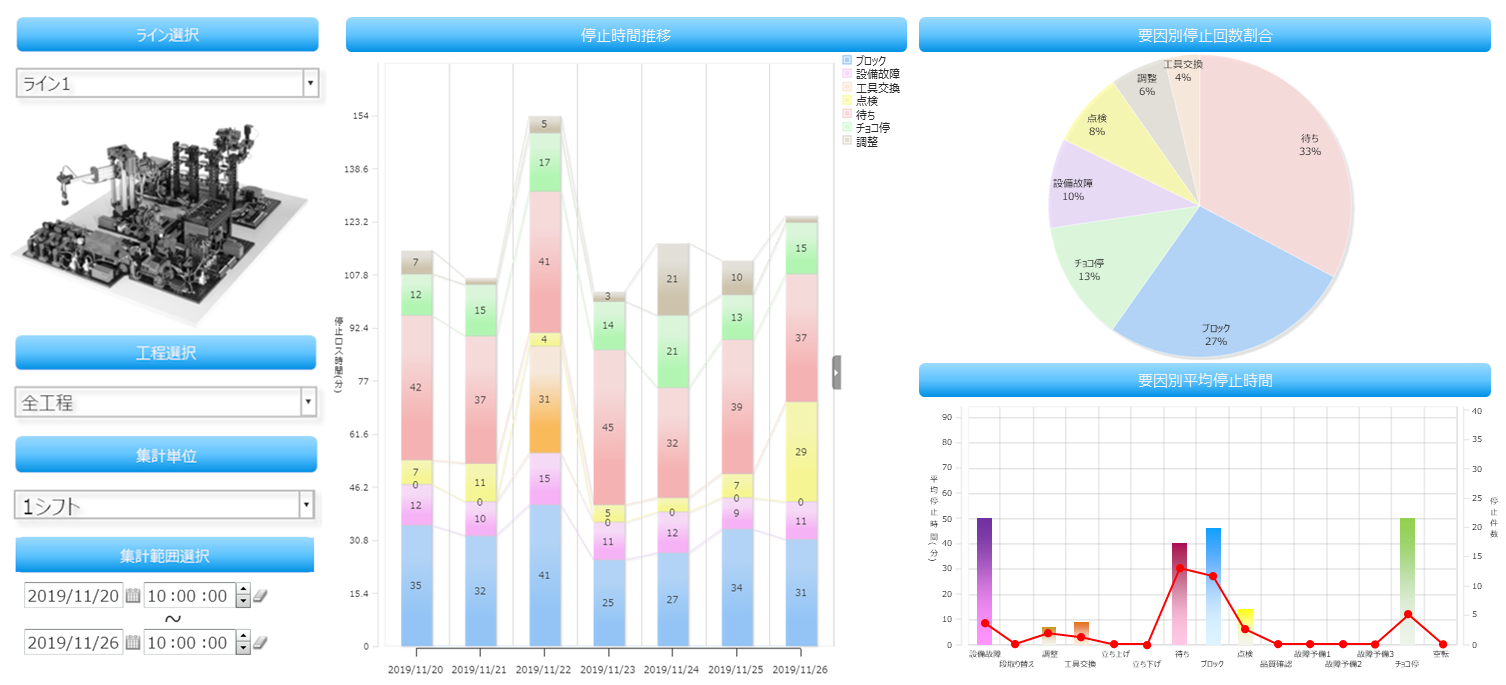
このような画面を作成することで、単に工場の状態を可視化するだけでなく、そこから要因分析ができるようになります。
例えば、生産数量が目標生産数よりも少ない日が数日続いた場合、どのようなことが分かるでしょうか?
・停止要因推移グラフから、直近一か月のうちでその数日だけ停止時間が極端に長いことが分かる
・内訳が6割段取り替えで2割調整作業だった場合、いつもよりも作業員の段取りに時間がかかったためその前後で調整が発生し、生産数量未達を引き起こしたという状況が見えてくる
上記は一例ですが、このように現場の肌感覚やイメージではなく数値で状況を把握できることで、優先順位や影響範囲を定量的に観測し、社内での情報共有・説明にも納得感が増します。
また、現状が把握できれば対策・改善活動を促進しやすくなります。
先ほどの例でいうと、段取り替えの回数を減らすような生産スケジュールに変更したり、段取り替え自体をスムーズに行えるように段取り時の手順を見直したり、などがあげられます。
スマートファクトリーのさらなるデータ利活用に向けて
今回は製造現場から収集したデータをクラウドでの蓄積・可視化についてお伝えしました。
実際の製造現場においては、クラウド環境の構築が難しいケースや、可視化からさらに進んだデータの利活用に向けて、AI技術を用いた分析などが検討されていると思います。
弊社では製造業をはじめとしたさまざまな業界のお客様に向けて、課題解決のためのサービス・ソリューションを提供していますので、データの収集やその利活用に課題をお持ちの方は、お気軽にお問い合わせくださいませ。
関連記事
*テックブログ*
小さなマクニカ工場のスマートファクトリー化を試してみた その1
*テックブログ*
小さなマクニカ工場のスマートファクトリー化を試してみた その2
*テックブログ*
小さなマクニカ工場のスマートファクトリー化を試してみた その3