- Smart Manufacturing Business HOME
-
approach

- Solution
- product·
service - event·
seminar -
column·
example
- Inquiry
This article is recommended for those who
- Those who are considering and introducing data collection and utilization of factory equipment
- For those interested in Macnica 's data collection solutions
How long does it take to finish reading this article
5 minutes
Introduction
Hello! This is Sakuraba from Macnica Innovation Strategy Business Division.
In the previous article, we introduced how easy it is to collect data from the PLC of a factory demo machine.
This time I would like to talk about the process of utilizing the collected data.
Data visualization to support decision making
Suddenly, how are you all using the collected data?
Various data related to people, equipment, materials, etc. exist at manufacturing sites, but even if they are collected, there is no point in collecting them if they are not utilized.
There are several ways to utilize it, but I think the easiest and easiest way to start is visualization.
By displaying the current parameter values numerically from the collected data, or by arranging changing parameter values in chronological order and displaying them in a line graph, you may notice trends and changes that you were not aware of before.
Furthermore, by sharing the visualized data with related parties inside and outside the company, decision-making and improvement activities that do not rely on the intuition and tricks of the person in charge become possible.
I tried to visualize Macnica 's demo factory!
So let's try it out in our demo factory!
Based on the PLC data collected in the previous article, I tried to visualize some indicators in production.
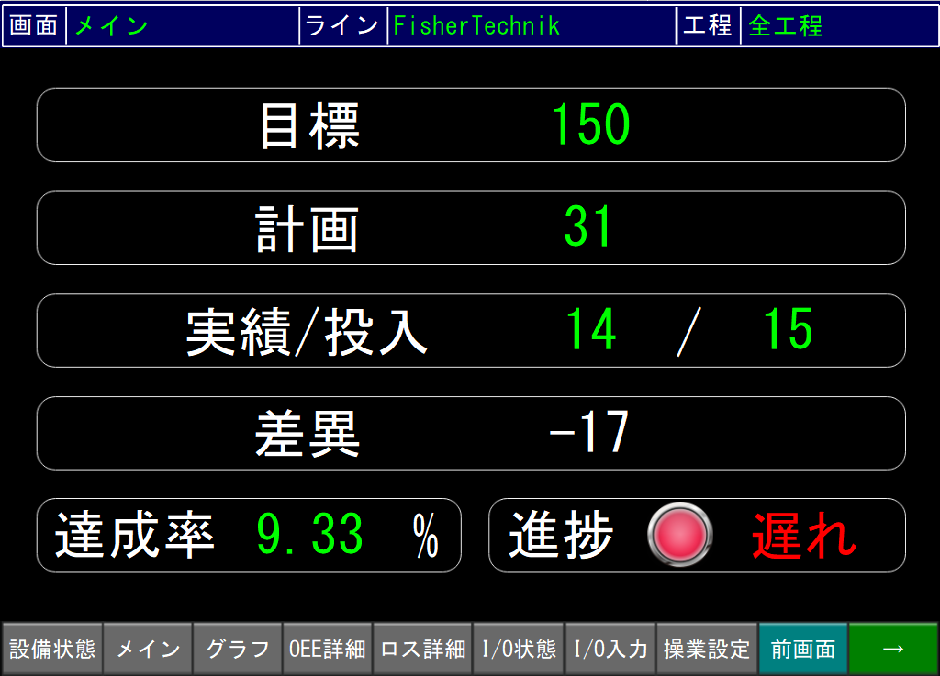
▼Production progress screen
Displays numerical values and line graphs for target production numbers, planned production numbers, differences between actual and planned numbers, and target achievement rates.
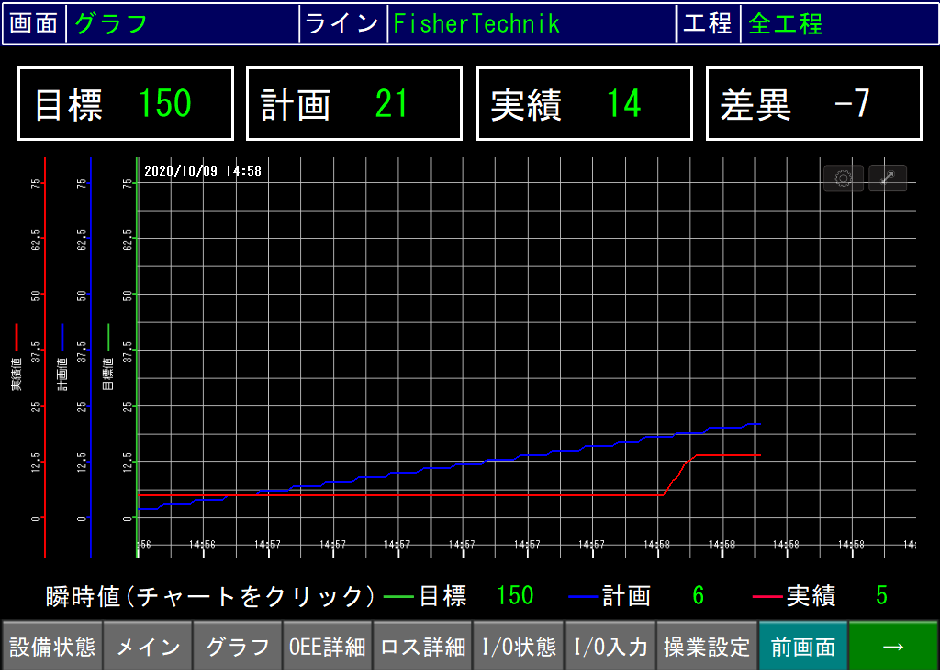
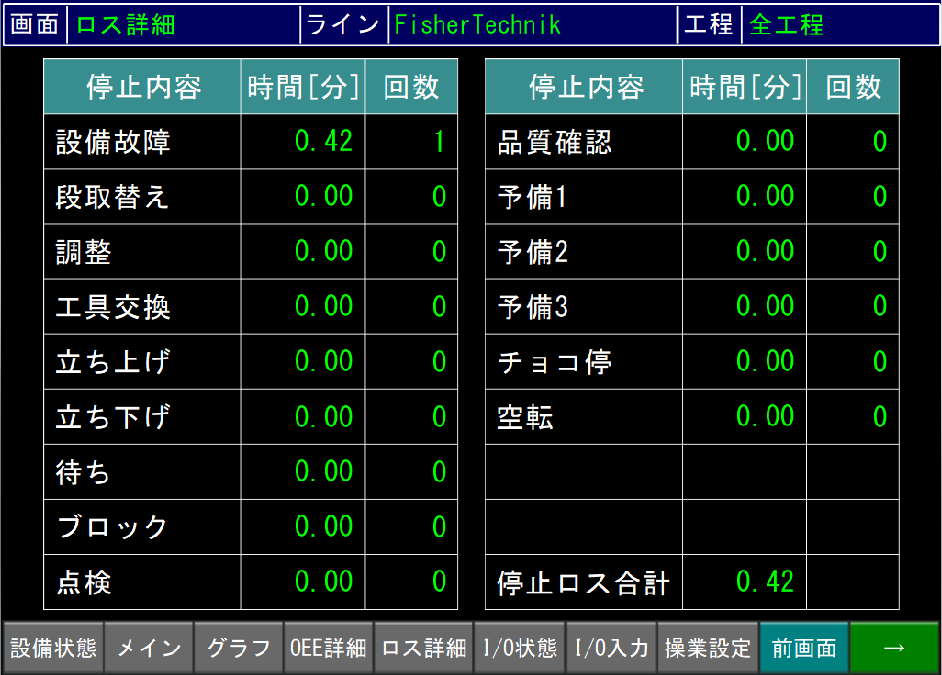
▼Loss screen
Displays the time and number of times for each equipment stoppage
▼ I/O status screen
Displays the current operation/stop status of equipment
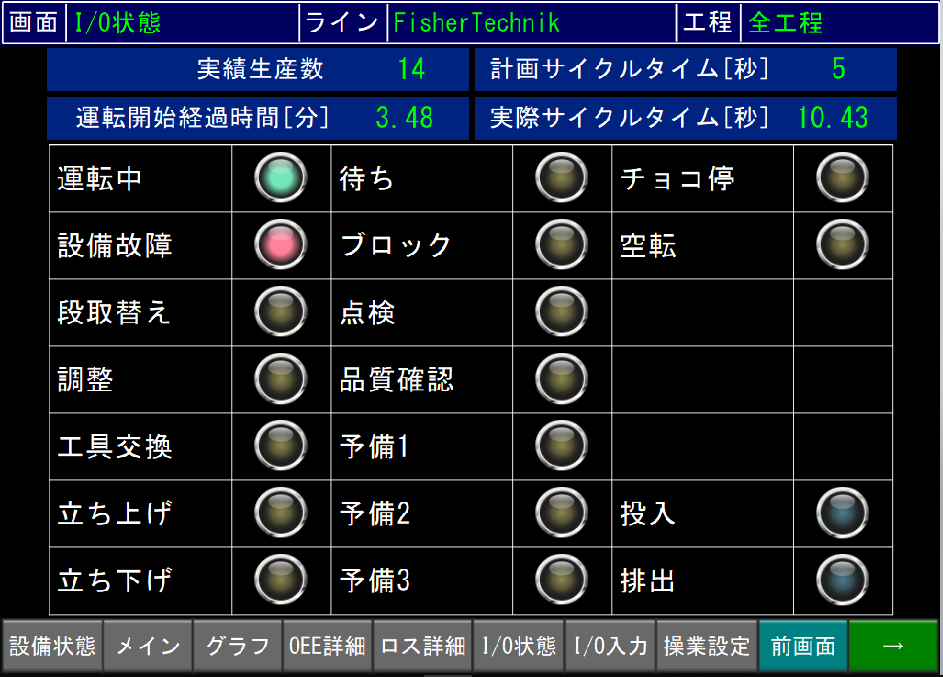
This makes it possible to understand the current production progress and equipment operating status at a glance, making it easier to grasp the situation and determine what to do next.
I think that visualization in this way at the actual manufacturing site will be useful for workers' decision-making and equipment maintenance activities.
No visualization without pretreatment
Data that could not be collected from the PLC was input from the HMI screen.
However, if you display this input data as it is, you will not be able to create a screen like the one above.
Some parts are displayed as numerical values as they are, but some parts are processed according to the indicators and parameters you want to display.
In other words, visualization requires not only data collection, but also preprocessing for visualization.
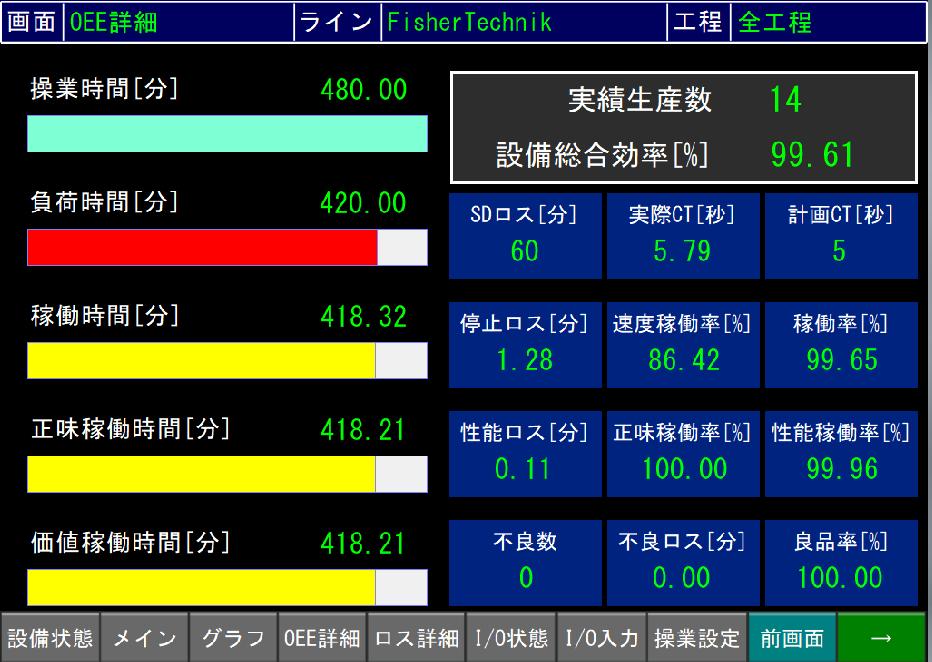
For example, OEE (Overall Equipment Effectiveness) is one of the indicators related to the operating efficiency of production equipment.
This index is calculated based on a defined formula using the number of production, production time, stoppage time, etc.
In order to carry out efficient production activities, it is essential to perform preprocessing in real time at the time of data collection and connect it to utilization such as visualization, instead of performing manual work using Excel after collecting data.
▼OEE screen
Display the current OEE parameters of the equipment
Let's visualize the target index (KPI)!
Earlier, I talked about OEE as an example, but there are several other indicators used at manufacturing sites.
Important indicators for achieving goals are called KPIs (Key Performance Indicators), and OEE is one of the KPIs for improving productivity.
KPIs are essential for understanding how much progress is being made toward the ultimate goal.
In general, at manufacturing sites, equipment downtime, production loss rate, etc. are set as KPIs, and confirmed and shared in daily reports.
In addition to setting KPIs, it is believed that more accurate cost control can be achieved by utilizing the collected data.
課題をまとめ、プロジェクトのゴールを決め、KPI を設定し、現場で可視化していくという流れは、スマートファクトリー化の初期フェーズにおける常套パターンです。
ぜひ我々と一緒に製造現場の変革を進めていきませんか?
Toward further utilization of smart factory data
This time, based on the data collected from the PLC, we talked about pre-processing and on-site visualization.
At actual manufacturing sites, there are old facilities that are not PLCs, and multiple processes and facilities are intricately intertwined.
We also support data collection from equipment other than PLC, data preprocessing in complex processes and equipment, visualization and analysis using the cloud.
Please feel free to contact us if you have any problems with data collection or its utilization.
Next time, we plan to introduce data accumulation and analysis as content related to utilization.
stay tuned!
Related article

*Tech Blog*
We tried turning a small Macnica factory into a smart factory. Part 1
*Tech blog*
I tried turning a small Macnica factory into a smart factory Part 2
*Tech Blog*
We tried turning a small Macnica factory into a smart factory. Part 4