To achieve carbon neutrality
Demand is increasing for in-house power generation using renewable energy sources such as solar, wind, and biomass in order to achieve carbon neutrality by 2050. However, renewable energy cannot provide a stable energy supply like fossil fuels due to the effects of weather and problems with power generation efficiency. In order to realize a society centered on renewable energy, it is essential to promote significant energy conservation by each company.
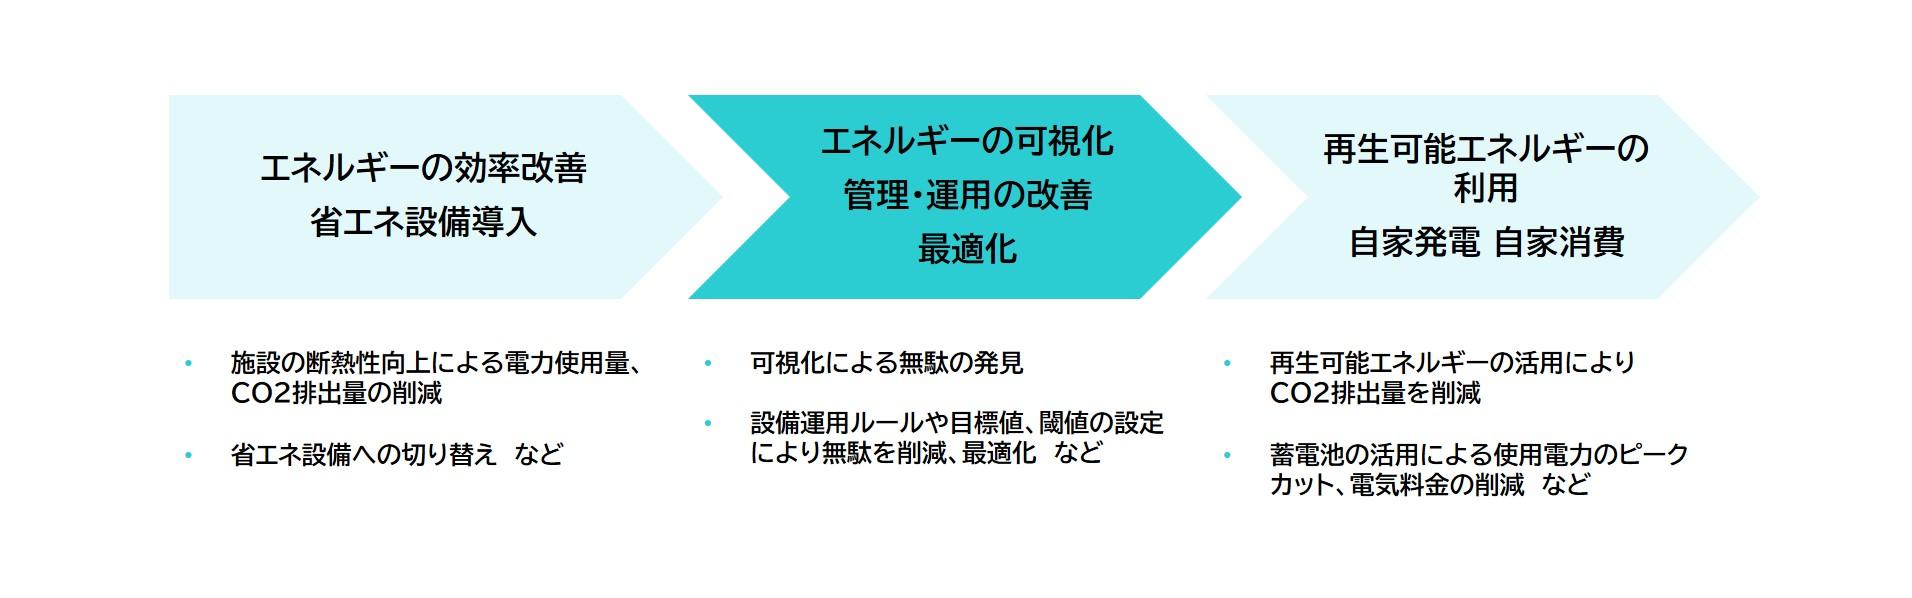
In buildings, commercial facilities, schools, public facilities, etc., lighting and air conditioning equipment account for the majority of energy consumption. It is often thought that energy conservation is possible only by upgrading these facilities, but by visualizing the amount of energy used and reducing and minimizing energy consumption more efficiently, we can improve energy efficiency and optimize the environment. It is possible to build.
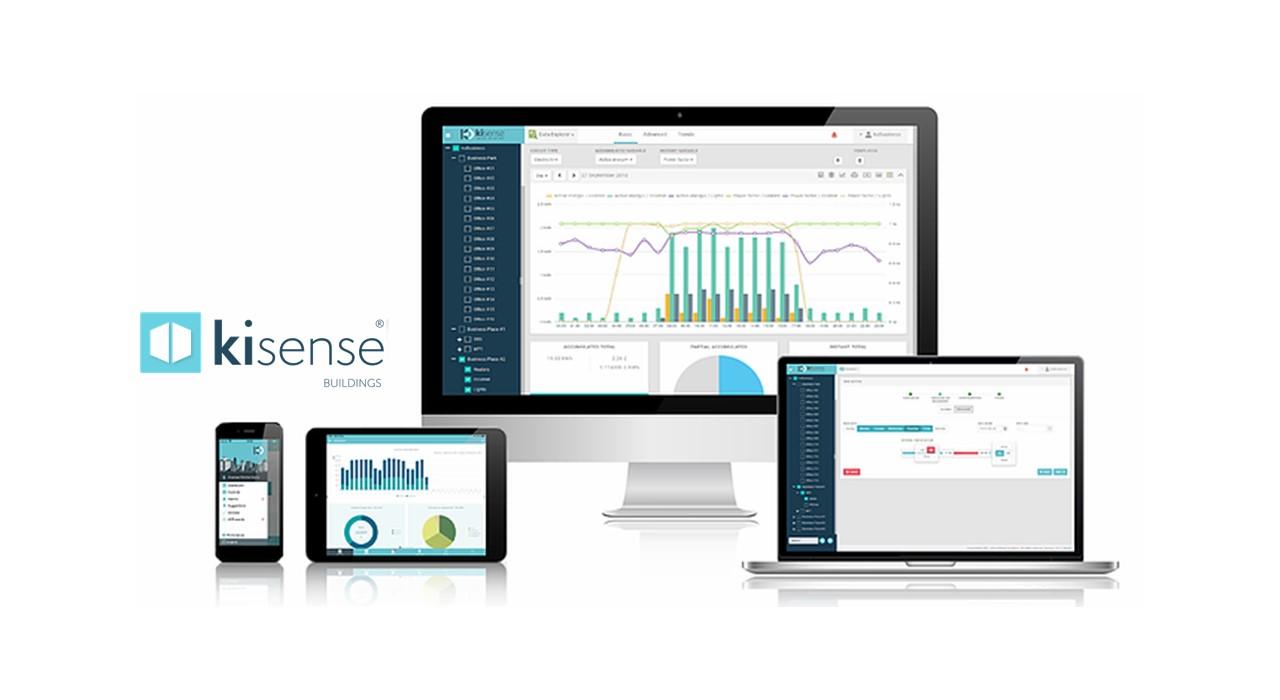
Data visualization solution features
The Data Visualization Solution (hereafter referred to as this solution) collects data obtained from various sensors installed in facilities and power consumption data obtained from smart meters into the cloud, visualizes and analyzes it, Realize decarbonization of the facility, such as improvingthe operation of the entire facility and reducing electricity costs, by grasping the amount of usage and CO2 emissions, reviewing the facility operation rules, setting specific reduction targets, and controlling the facility equipment. To do.
After the introduction of this solution, with minimal development and settings, environmental analysis, control of facility equipment, and optimal operation of energy for the entire facility can be achieved.
no cord connection
It supports various communication standards and protocols, and various sensors and IoT devices from major manufacturers such as temperature, humidity, atmospheric pressure, illuminance, UV, noise, VOC, CO2, PM2.5, human sensation, power, etc. It is possible to connect with almost all clouds by using API. By using compatible sensors, this solution can be used in a short development and introduction period.
Environmental analysis and equipment control
By acquiring power usage data from smart meters and using sensor devices, it is possible to manage and analyze power consumption between equipment and areas. In addition, it is possible to analyze the environment and control equipment based on the acquired data by linking with environmental sensors such as temperature, humidity, and CO2 concentration.
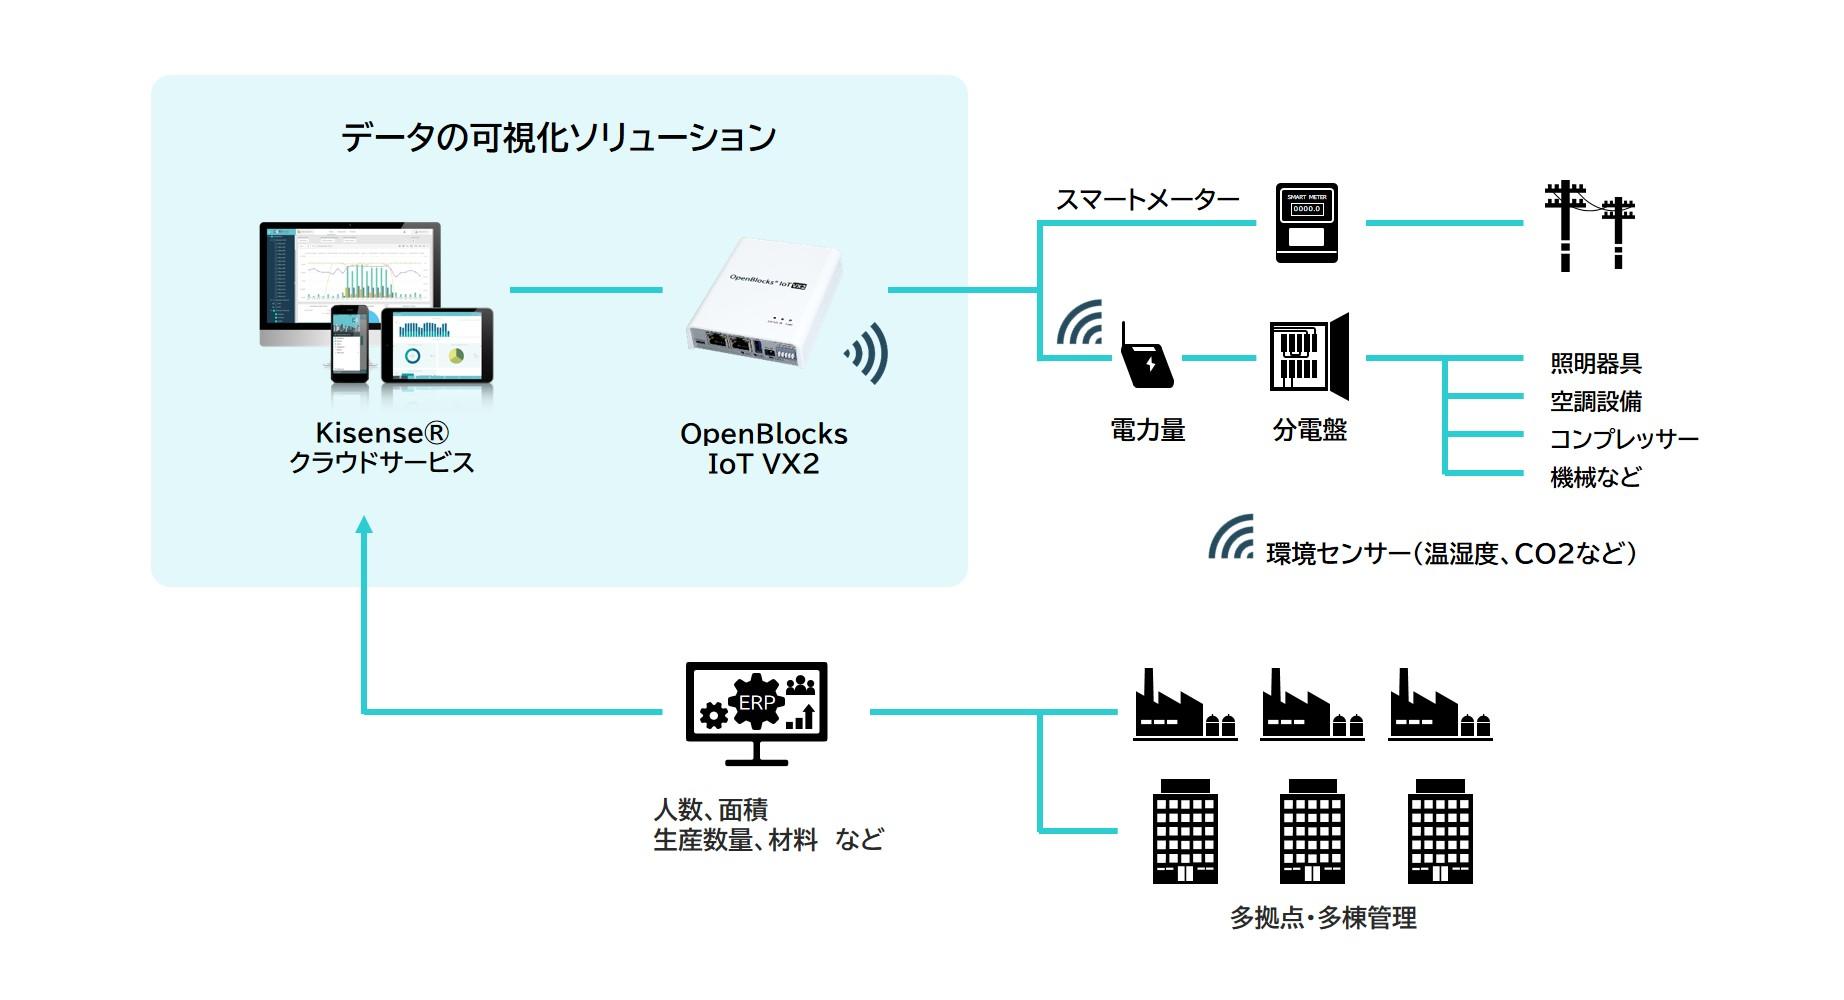
<System configuration example>
Acquirable data and usage examples
|
Acquisition data |
Usage example |
effect |
|
energy usage |
・Visualization of consumption of electricity, water, gas, etc. |
・可視化した結果をもとに、施設運用の最適化することでCO2排出量を削減 |
|
environmental data |
・Visualization of temperature/humidity data and other environmental data |
・Construct a comfortable environment by controlling equipment based on the results calculated from the acquired data |
|
ERP |
・Linking of ERP data, correlation analysis |
・分析結果から経営資源の有効活用、効率化が可能 |
|
Facility data |
・Visualization and comparison of data from multiple sites |
・Improve work efficiency by collectively managing multiple sites |
Inquiry
If you have any questions or concerns about our data visualization solutions, please contact us here.