

What is the energy management system Kisense®?
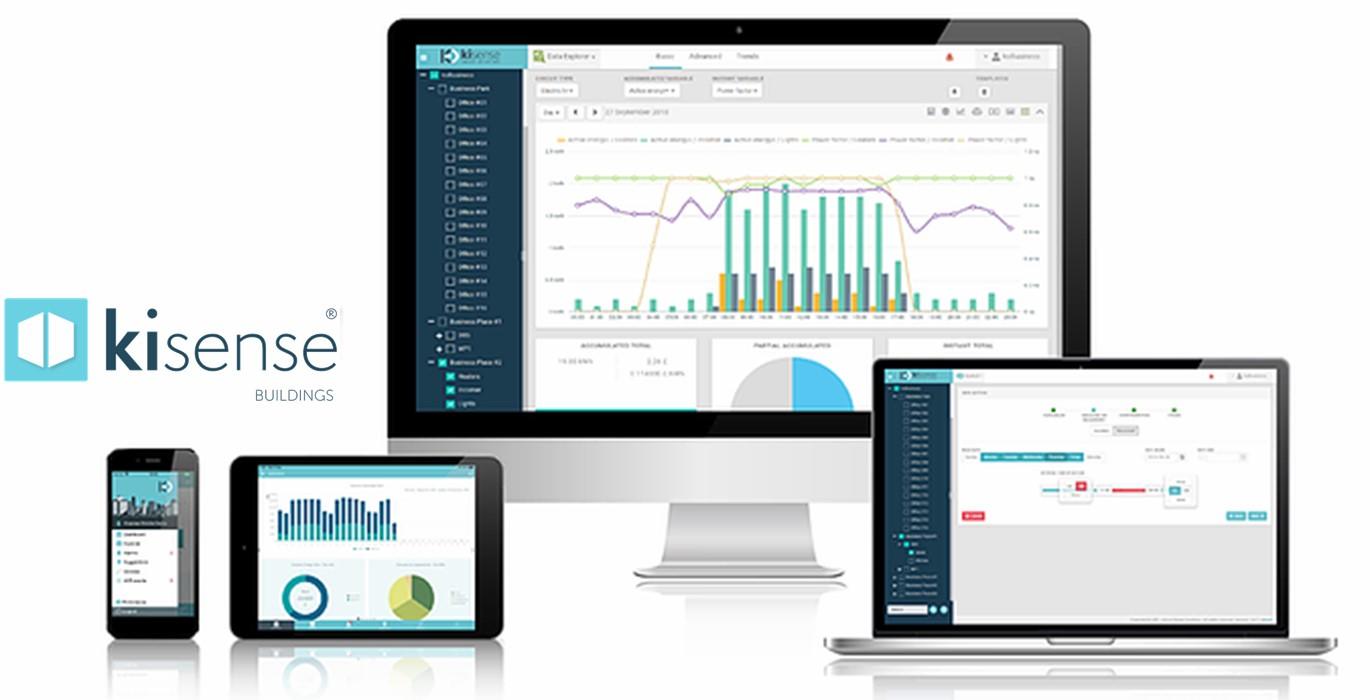
The energy management system "Kisense®" realizes real-time data visualization and early detection of equipment abnormalities by installing sensors that match various energy data such as electricity, gas, and water according to each environment. In addition, unique analysis is possible by combining indoor and outdoor temperature, motion sensor, and core system data.
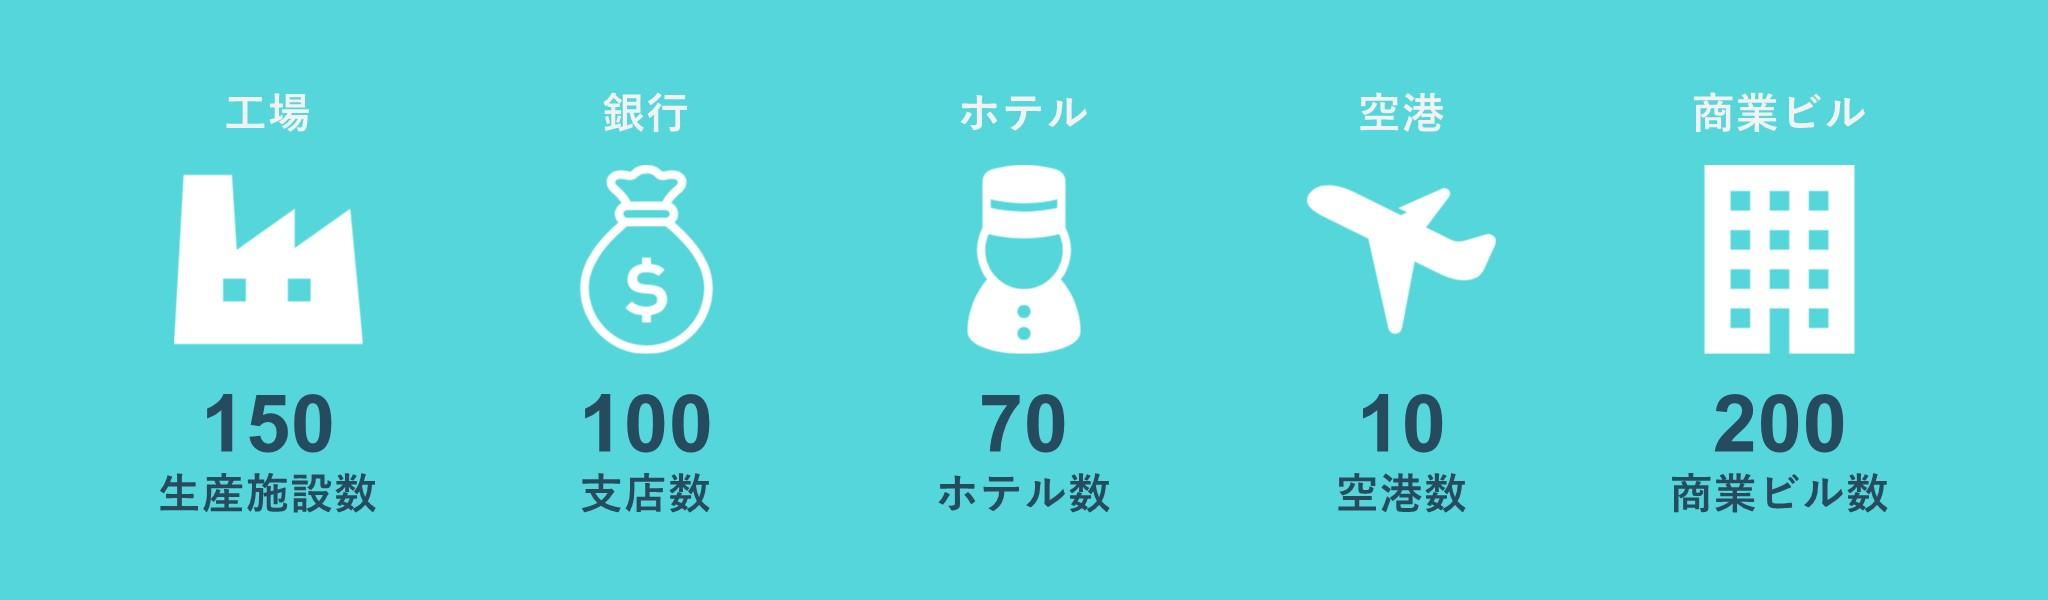
So far, we have installed more than 500 facilities such as production facilities, banks, hotels, airports, commercial facilities, etc., and we have many functions to meet the diverse needs of our customers.
Features of Kisense®
1 Real-time energy asset management and efficient use
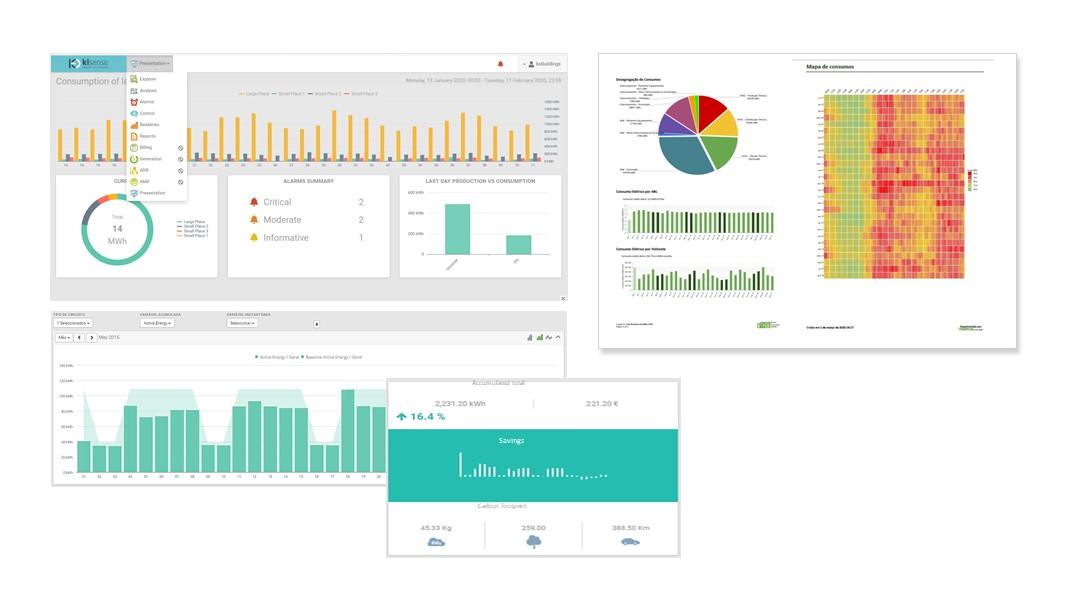
Streamline your energy usage with advanced dashboards & reports for web and mobile apps.
Energy consumption is analyzed in real time, and power consumption, alert information, and other data tailored to each user's needs can be easily checked on the management screen (dashboard). You can freely customize and obtain periodic reports and multi-faceted company reports.
By using the reporting function,
・Visually grasp the amount of energy used
・Shortening the time for checking electricity bills and usage, reducing costs and man-hours
etc. is possible.
2 Energy anomaly detection and alerts
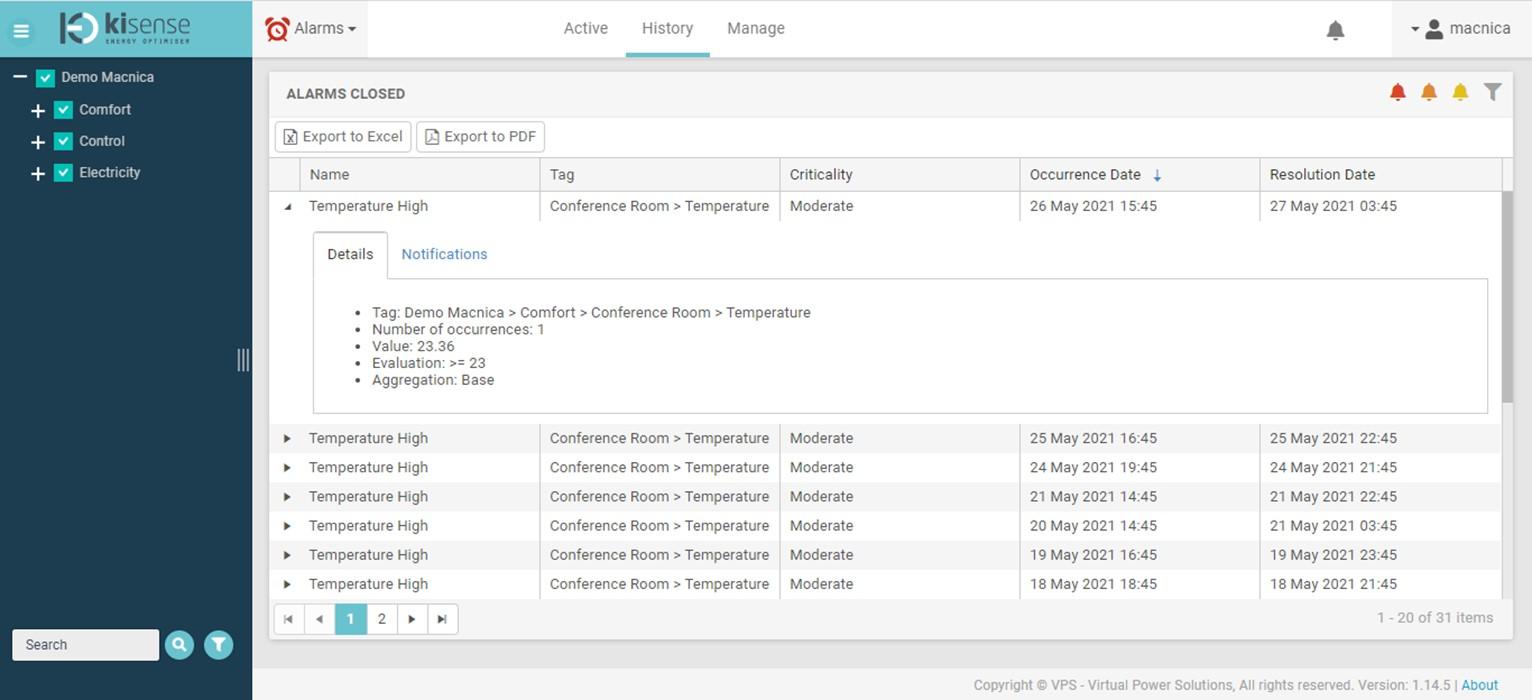
An alert tool that can detect anomalies and create rules for a series of actions that send alerts.
Thresholds can be set in advance for early detection of abnormalities, such as for preventive maintenance. When an error occurs, you can display the management screen (dashboard) and set email notifications.
3 Renewable energy and battery management
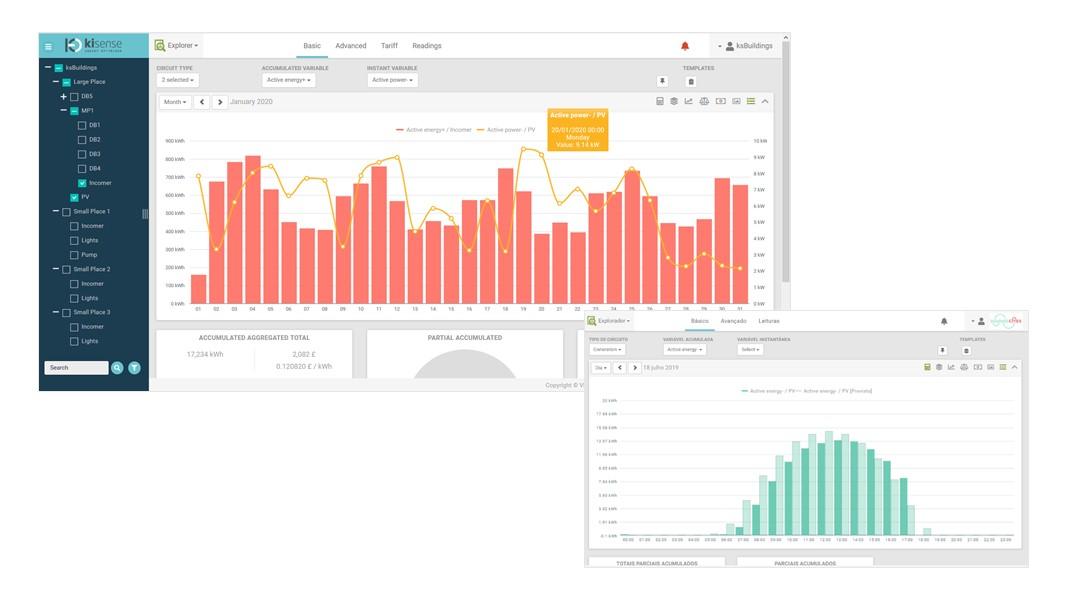
Tools for optimizing the use of renewable energy and storage for economic analysis.
Versatile functions to meet your needs
| Management screen (Dashboard) |
Easily view power consumption, alert information, and other data tailored to each user's needs |
|---|---|
| data explorer | Easily search and compare historical or real-time data |
| アラート | Abnormalities can be detected early by setting thresholds in advance. |
| control | Program settings for real-time ON/OFF control or peak cut can be performed. |
| analysis | Analyze power consumption profiles by comparing them with historical data and using heatmap and trend analysis functions |
| report | Flexible reporting on power usage and more |
| Viewing energy usage | Usage charges for electricity, water, gas, etc. can be imported into the system and checked. |
| Renewable energy management | Monitor ROI analysis, outlier detection, and more |
| optimisation | Optimization algorithms for cost reduction |
| Cloud data linkage | Centralized management, data comparison, and analysis are possible by linking different facilities and different systems in the cloud. |
Kisense® installation results
Case study
Factory x Kisense®

BEFORE
We want to reduce the amount of electricity used, which accounts for the majority of the energy used in the factory, and reduce the electricity bill.
Since lighting and air conditioning accounted for most of this, we were looking for ways to reduce these.
AFTER
By using CW technology, we were able to visualize power consumption and optimize operations, including employee training.
As a result, we have achieved a 13.6% annual reduction in electricity costs.
Airport × Kisense®

BEFORE
Due to the lack of detailed energy (electricity, gas, water) usage data for each tenant in the airport, it was difficult to bill each customer appropriately and reduce energy costs for the entire airport.
AFTER
By collecting real-time information from 5,300 monitoring points in the airport and sharing this data between the billing system and the core system, we were able to accurately grasp the exact utility costs for each tenant.
By collecting, analyzing, and integrating data within the airport, energy conservation measures for the entire airport have become possible.
Bank × Kisense®

BEFORE
It was necessary to achieve the 10% reduction target for energy consumption in order to curb climate change set by ESG. was.
AFTER
Installed in 180 bank branches to monitor and control power consumption, air conditioning and exterior lighting.
We adopted an alarm setting function to realize stable operation and a report function to analyze power consumption patterns and waste. At the same time, by consulting on energy procurement, we succeeded in reducing annual energy consumption by more than 12%.
Hotel × Kisense®

BEFORE
The challenge was to reduce operating costs, find and replace inefficient equipment, and eliminate other waste.
AFTER
We have installed Kisense® in 17 hotels based on the results of our current facility and building audits.
By collecting data on each facility and solar power generation and monitoring it in real time, we succeeded in reducing energy consumption by more than 5% annually. This allowed us to secure low-cost electricity contracts.
Inquiry
If you have any questions or concerns about Kisense®, please feel free to contact us.
Related product

Data visualization solution
Understand facility power consumption and CO2 emissions, and support energy efficiency improvement and optimization

Next-generation smart office solution
Smart offices improve operations in the office and reduce electricity costs for the entire facility