- Semiconductor BusinessHOME
- Products and Services of Macnica,Inc.
-
technical information

-
Events and Seminars
- Handling Manufacturer
- Support
- Inquiry
- Click here to purchase products
- Semiconductor business e-mail magazine registration
![]()
![]() Narrow down by specifying conditions
Narrow down by specifying conditions
現在2183件がヒットしています。check

In the previous article, Let's use LTspice - Confirmation of output transient response, we introduced how to obtain the output voltage value using the mouse hold operation and the cursor addition function. This time, we will introduce a simulation that automatically displays the maximum and minimum values (Peak to Peak) of voltage fluctuations in a power supply circuit using the ".measure" command (hereinafter abbreviated ".meas").
If you are just starting LTspice, we recommend that you look at the "basics" from the list below.
Let's use LTspice series list is here
Also, if you would like to see a video on how to write a basic circuit and how to execute it, there is an on-demand seminar that does not require you to enter personal information, so please take a look if you are interested. Detailed information about the seminar is also provided to those who fill in the questionnaire.
LTspice On-Demand Seminar - Function check with RC circuit -
Let's check the voltage fluctuation value of μModule® LTM8065!
Let's use LTspice - Referring to the basics, call the circuit diagram (JIG circuit) of the step-down switching regulator μModule® LTM8065.
This time, we will simulate a load that fluctuates between 0.5A and 2A to the LTM8065.
Click here for how to set a variable load Let's use LTspice - Check output transient response
Run the simulation
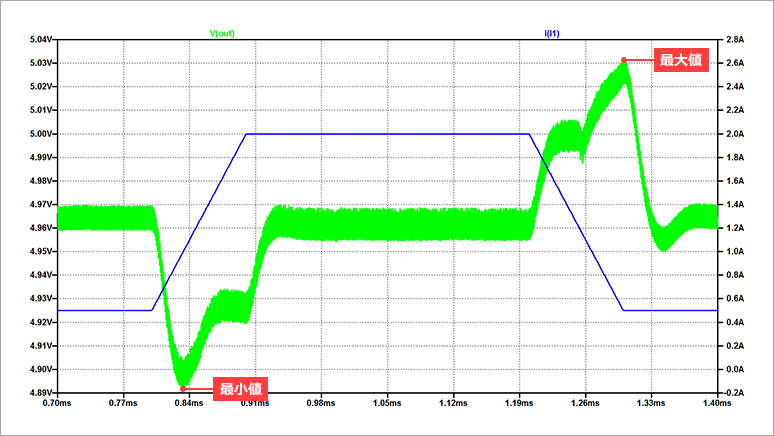
Press the "RUN" button to run the simulation. Probe the output (OUT) node and the load current (I1) to see the output voltage and current waveforms. Next, I expanded the red frame part of the simulation result.
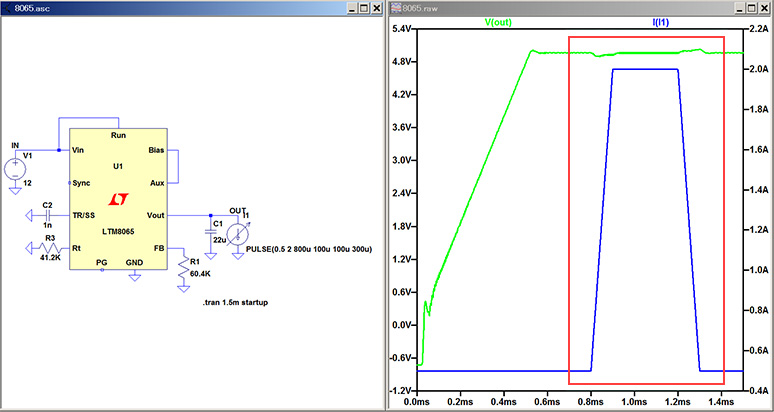
You can check the voltage fluctuation value when the load fluctuates by using a mouse hold or cursor on this enlarged simulation result.
Click here for details on mouse hold operation Let's use LTspice - Operation check of DC/DC converter
Uncertainty about whether the maximum and minimum values are really being detected
However, with those methods, I am unsure if the cursor is really pointing to the maximum and minimum values circled in red.
It would be easier if the maximum and minimum values of the voltage could be obtained automatically during the simulation.
Check the maximum and minimum values of voltage fluctuation with the ".meas" command
It is possible to obtain the maximum and minimum values (Peak to Peak) of voltage fluctuation from the simulation results with the ".meas" command.
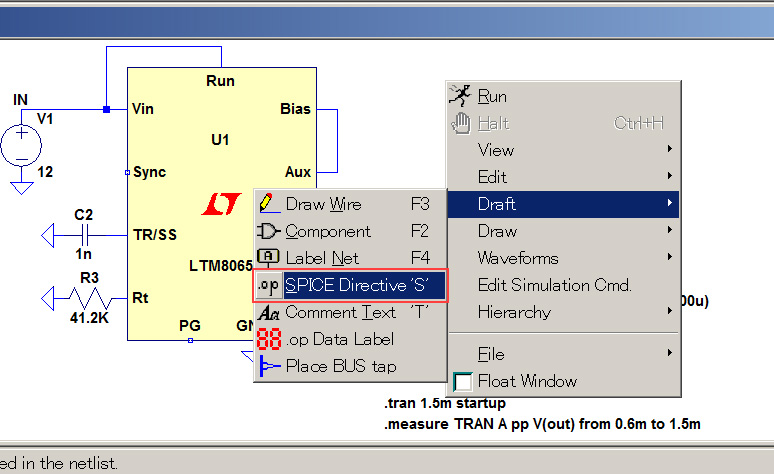
1. Right-clicking on the schematic window displays the following menu list.
Select “Draft” → “.op SPICE Directive”.
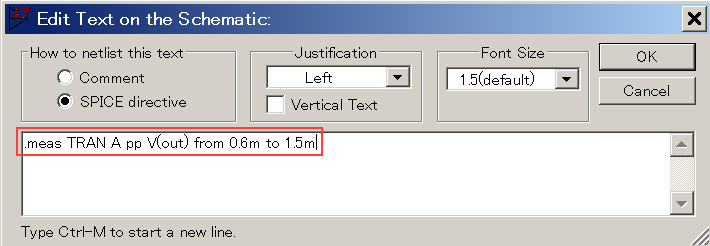
2. The “Edit Text on Schematics” window opens.
We write:
.meas TRAN A pp V(out) from 0.6m to 1.5m
3. Press the "RUN" button to run the simulation.
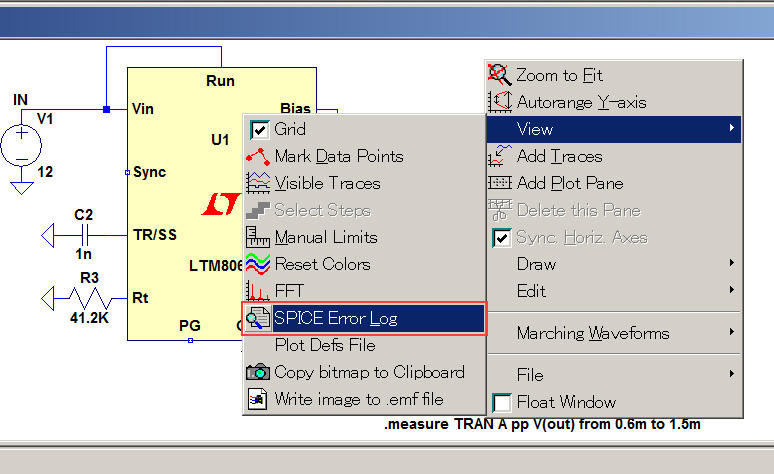
4. After the simulation is finished, right-click on the schematic window to display the following menu list.
Select View > SPICE Error Log.
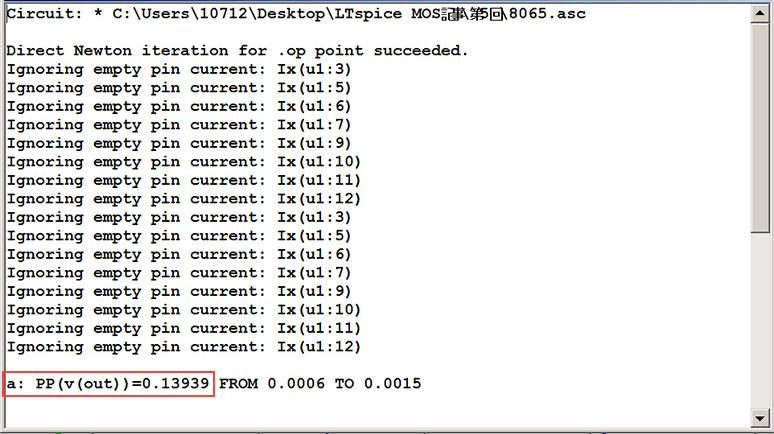
5. A text file will open.
The maximum and minimum values of voltage fluctuation a: PP (v (out)) = 0.13939 are displayed in the red frame part of the text. I was able to easily find the maximum and minimum values just by adding one sentence.
Command description
- .meas : command used when measuring from simulation results
- TRAN : Used when performing transient analysis simulation
- A: Name of the measurement result (Anything will do. To make it easier to understand when multiple displays are displayed.)
- pp: Calculate peak to peak (maximum/minimum value)
- V(out): voltage of the OUT node
- from 0.6m to 1.5m: Between 0.6msec and 1.5msec

(Supplement) If the pp part in the .meas syntax is set to max, the maximum value can be measured, and if it is set to min, the minimum value can be measured.
LTspice demo file verified this time
After extracting the zip file to the same folder on a computer with LTspice installed, run LTspice to automatically start waveform display.
.meas simulation file
At the end
This time it was about ".meas", but there are a wide variety of other commands available. We will continue to introduce various functions in the future, so please continue to support us.
We also hold regular LTspice seminars. You can learn the basic operation of LTspice, so we look forward to your participation.
Click here for LTspice seminar information
Click here for recommended articles/materials
List of articles: Let's use LTspice Series
LTspice FAQ: FAQ list
List of technical articles: technical articles
Manufacturer introduction page: Analog Devices, Inc.
Click here for recommended seminars/workshops
Inquiry
If you have any questions regarding this article, please contact us below.
Analog Devices Manufacturer Information Top
If you want to return to Analog Devices Manufacturer Information Top, please click below.