- Semiconductor BusinessHOME
- Products and Services of Macnica,Inc.
-
technical information

-
Events and Seminars
- Handling Manufacturer
- Support
- Inquiry
- Click here to purchase products
- Semiconductor business e-mail magazine registration
![]()
![]() Narrow down by specifying conditions
Narrow down by specifying conditions
現在2168件がヒットしています。check


Click here for product descriptions, quotations, demos, evaluation requests, etc.

Click here to apply for a seminar on this product
It has a lot of convenient functions for verification, and I will introduce the extended data flow, which is one of the verification functions.
Feature introduction
Enhanced Dataflow Features
When you find a problem in the output waveform of logic simulation, how do you search for the cause of the problem?
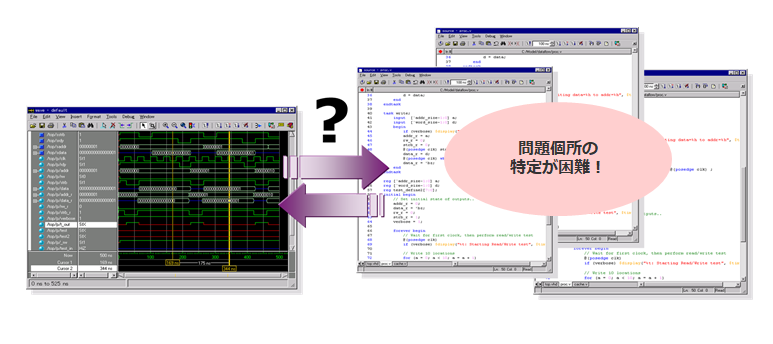
With waveform-based debugging, you may have experienced the following:
● See the problem on the waveform, see the signal on the source
● Debugging by round trip between waveform and source
● Increasing the amount of description and the number of files makes it difficult to trace signals...
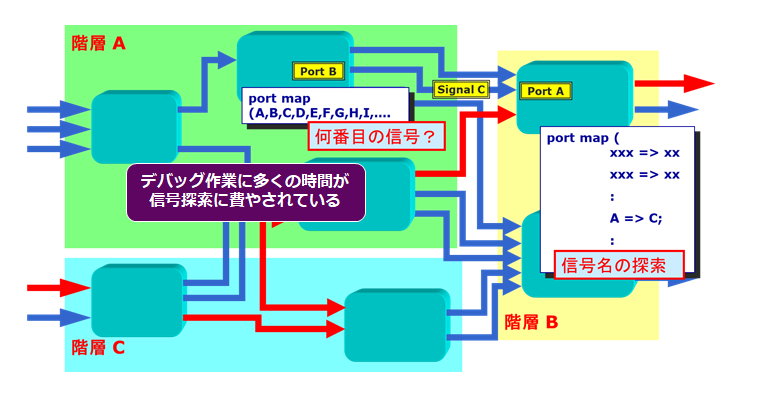
As the scale of the circuit increases, the number of logic stages and branches increases, so it will take time to find the cause of the problem. In such cases, it is convenient to use the enhanced dataflow functionality.
The extended data flow is easier to understand if it is introduced along the actual analysis flow, so this time we will explain it with an analysis example when the output pin is X (undefined).
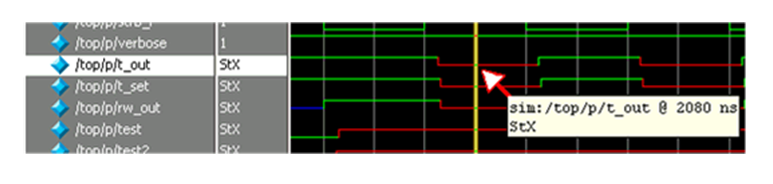
(1) Display of waveform window
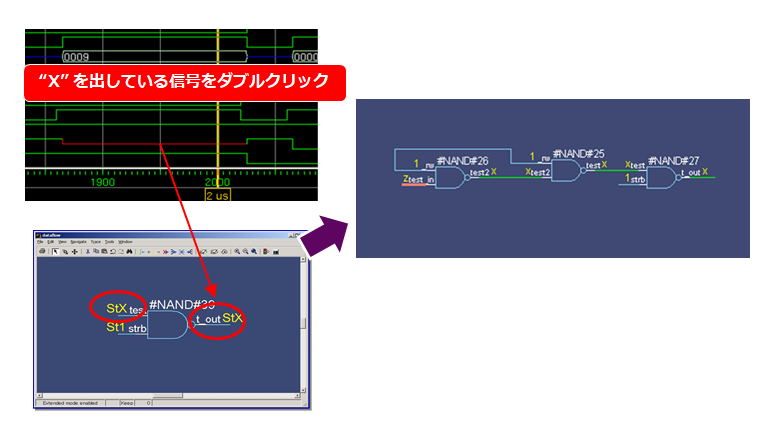
First, run the simulation and display the waveform window. If you check the waveform in Figure 3, the signal t_out is X (undefined). Let's try to find the cause of this.
(2) Display of data flow window
If you double-click where the arrow waveform in Fig. 3 is X (indefinite), the RTL will automatically display the corresponding circuit diagram and the waveform of the signal only, as shown in Fig. 4. This is the dataflow window. I think that it is easy to understand because only the corresponding circuit diagram is displayed.
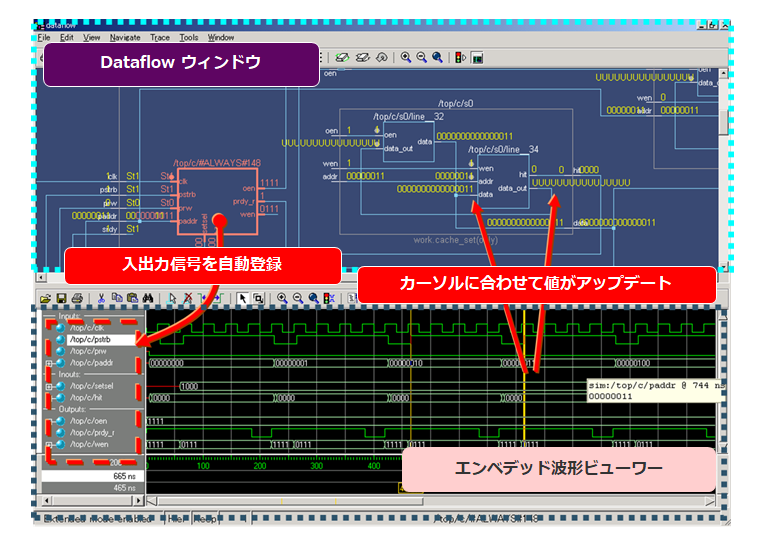
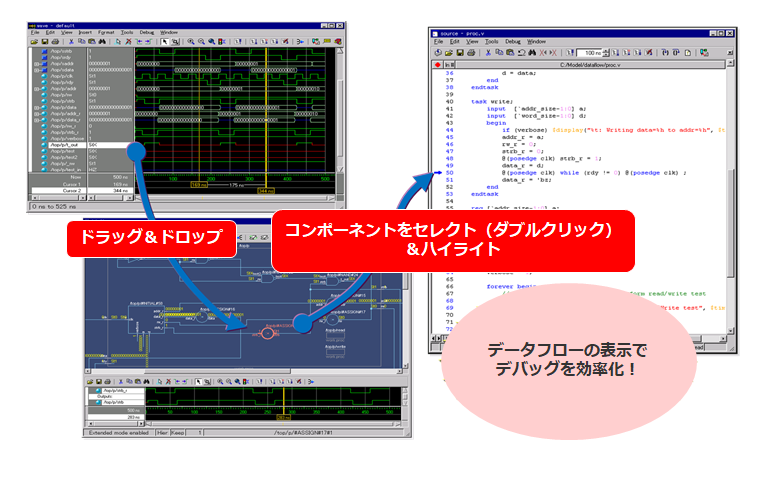
(3)Linking schematics and waveforms in the dataflow window
Signal values on waveforms and schematics are linked. If you move the yellow border on the waveform at the bottom of Fig. 4 to the left or right, the signal values on the circuit diagram will also change at the same time as shown in Fig. 4. This is a convenient function for identifying the cause by tracing back time because you can see which input pin caused the change in the output pin.
(4) Back trace of circuit diagram
When the output pin of the NAND cell is X (undefined), one of the input pins is X (undefined). If you click on the input signal, the circuit diagram will be expanded further and it will be the circuit diagram in Fig. 5. Even if you go through the hierarchy, it will automatically search between hierarchies. As such, the dataflow window is used to explore the physical connectivity of your design. You can verify connectivity by expanding the display from process to process.
(5) Identification of the cause of failure
Since the circuit diagram is not expanded beyond the Hi-Z of the input pin of the NAND cell in Figure 5, this NAND cell is examined.
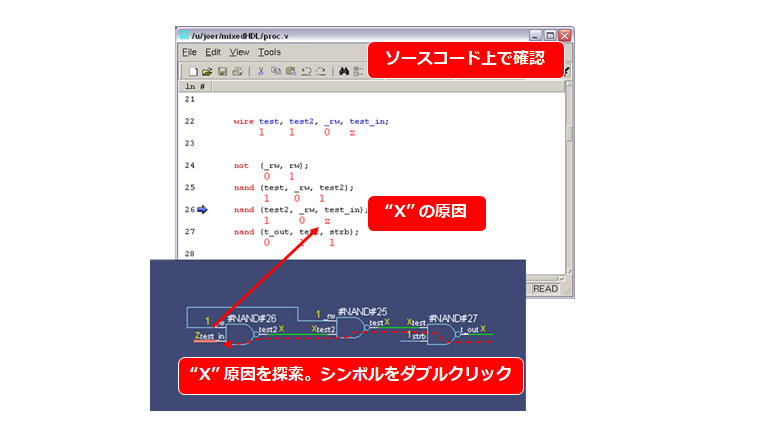
(6) Confirmation of RTL description
Double-clicking on a NAND cell on the schematic automatically opens the RTL window to the appropriate row. Analysis of the RTL reveals that the test_in pin, marked as Z in the schematic, is floating. Now we know that the X (indeterminate) of the signal t_out is caused by the test_in pin floating.
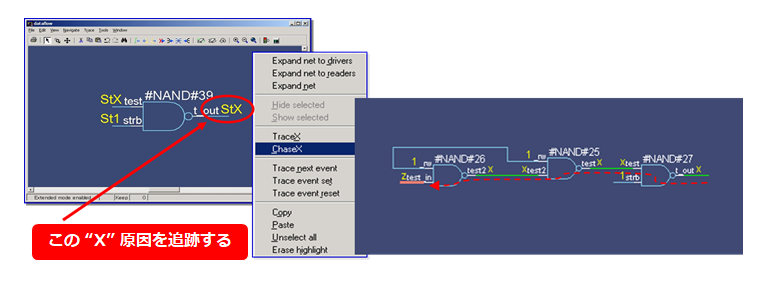
(7) ChaseX function
In the above, we searched for the cause of X manually, but there is a function that automatically searches for the cause of X. Select the NAND cell's output pin X and run ChaseX to automatically search the signal path and expand only the schematic from the NAND cell to the NOR cell. The circuit diagram of unnecessary signal paths is not displayed, so it is a highly visible circuit diagram.
The main features of enhanced dataflows can be summarized as follows:
● Automatic generation of circuit diagrams around relevant signals from RTL
● Reciprocal link between waveform ⇔ circuit diagram ⇔ RTL
● Identify the cause with time traceback
● Backtrace function for undefined value X
Related Information
▶ assertion validation
▶ code coverage
▶ Waveform comparison
▶ Extended data flow
Seminar/Workshop
▶ [Online Seminar] Assertion Validation with ModelSim <Free>
This seminar introduces the effects of assertion-based verification (ABV), code coverage, and extended data flow, which are debugging functions of Questa Sim / ModelSim. In particular, assertion-based verification is the preferred verification technique, utilized in more than half of FPGA designs.
▶ Related events and seminars
Inquiry
Manufacturer information Top
If you would like to return to the manufacturer information top page, please click below.
Trademarks and registered trademarks owned by Siemens: here