Exabeam
Exabeam
Summarizing the Incident Timeline: Manual vs. Automated Processes (Part 1)

SIEM technology has long provided a centralized, queryable log repository that allows security analysts to access information that would otherwise be scattered across different tools. For analysts to create fact-based activity reports, they need to create an incident timeline each time suspicious activity is flagged. Creating such timelines is often a daunting task. This is because you need to know not only your SIEM tool expertise, but also the "normal" state of affairs in your organization, and there are many pitfalls in the creation process. Understanding which assets users were accessing at the time of an event is a daunting task, but trying to tie hostnames to IP addresses in modern networks makes things even more complicated. Developing an accurate investigative timeline using manual log queries can ultimately take a long time. Time is a precious resource in security operations.
Exabeam customers repeat today that our Smart Timelines have been revolutionary for SOC analysts. By automating the timeline creation task, analysts can immediately get to the heart of the investigation. In the meantime, a question arose. How much time are you actually saving? Therefore, we ran a simulation that was largely faithful to the real-world scenario. The results frankly surprised me.
Simply put, it took even an experienced analyst over 20 hours just to put together the investigation timeline for one relatively simple malware alert. Including slow and subtle maneuvers behind the scenes, months of reconnaissance, exploits that attack carefully crafted security vulnerabilities, and the like. It was not intended for nation-level attack timelines. A fairly standard malware alert investigation takes over 20 hours.
Life before joining Exabeam
Prior to joining Exabeam, I was the lead cybersecurity practice for a world-renowned 10,000-employee company whose security team consisted of just 5 analysts. . Like many organizations, we have worked as cybersecurity analysts, investigators, architects and liaisons.
Quality control is essential because all security analysts have varying levels of internal knowledge about what activity is considered normal or unusual in an organization. With this in mind, in educating my team, I emphasized that when you make a claim, you have to prove it in at least two ways, three ways is even better.
I know firsthand that manually creating an incident timeline with a traditional SIEM is a labor intensive process that requires a lot of queries. In this article, we'll take a look at how laborious that process can be. And in the second article of this series, we summarize how Exabeam automates the entire process while including important information that the manual process misses.
Ask what the standard of normal behavior is
Any question for security related events leads to the following questions: "What queries should a SIEM run to prove that each event accurately depicts a particular user's activity when creating a chronological timeline of events?" Alerts or events must be manually processed to reveal the full picture before moving on to the next alert or event. This point is illustrated in Figure 1. The aim of our task was to bring together the most relevant information.
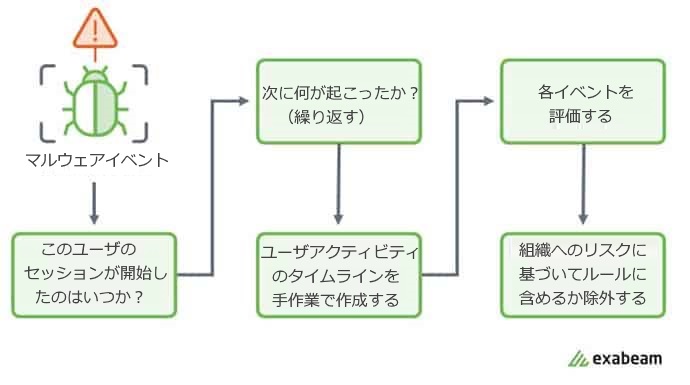
Figure 1: An example workflow followed by an Incident Response Analyst.
But detecting anomalous behavior is only a small part of the overall job. In reality, retrieving such information from raw log data is very difficult and even laborious.
Most of the time, it's difficult to make sense out of the logs as there are more questions and possibilities such as:
- Is it normal for users to have such access?
- Does this activity match the user's job function?
- Does this activity match the way users normally interact with systems and apps?
Trying to draw conclusions from extremely large amounts of raw data without context has been a daunting task.
Different paths may not lead to the same truth
Manual threat research and risk assessment is very time consuming and error prone. Moreover, the analysts who scrutinize all this data also have their own biases, each following the path they thought makes sense. In my experience, assigning the same incident to two analysts leads to two different results. That's not a good result for the credibility of your security operations team.
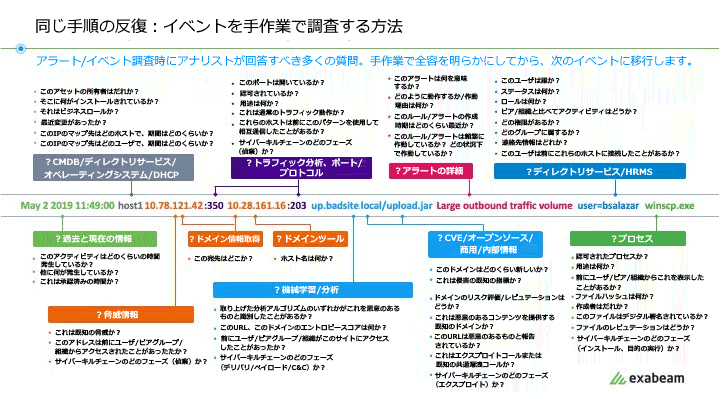
Figure 2: Analysts have many questions to answer when researching an event.
This example lists 51 types of questions.
Manual survey simulation
I recently ran a simulation of a traditional SIEM platform to demonstrate the inefficiencies of doing research through manual pivots and queries.
The skill level of analysts within the organization was assumed to be moderate. i.e. anomalies, apps users use, which resources they use, knowledge of the latest attack techniques, where to check reputation for indicators of potential threats (domain or IP reputation, file reputation) Analyst with basic knowledge of
We also chose a relatively well-tuned environment in which query data was returned reasonably quickly. A few years ago, when technology wasn't as advanced as it is today, that's an unlikely assumption.
In a real-world enterprise, poorly tuned environments, visibility gaps due to inadequate log ingestion, and staffing that does not allow 24/7 monitoring can further negatively impact detection and response times. There are a ton of variables and metrics to evaluate, including:
- Does your organization have a SOC?
- Does the SOC have employees who monitor security events 24/7?
- What is the average response time of your employees?
- Are supervisors part-time? Or are you outsourcing your monitoring duties?
- What is the MTTD (mean time to detect) and MTTR (mean time to respond) in each case?
- Do you regularly test using penetration tests, red team exercises, or other simulations?
- Is your SIEM properly maintained (tuned) to quickly return the information you need?
- What is the SLA for returning queries last 30, 60, 90 days?
- Does your security budget support ongoing SIEM maintenance?
We frequently see these security gaps leading to major data breaches. The following adage still applies today. "Defenders need to know every incident, while attackers only need to succeed once." In this regard, gaps in defensive coverage are where the greatest risk lies. Closing the known gaps requires enormous effort and focus. They also need to empower security teams and more broadly IT teams to identify previously unknown gaps.
In many cases, when an analyst investigates an incident, it turns out that the impact is much more widespread than originally thought. Digital forensics often find evidence of lateral movement or other persistence. And for the first time, we know that the first security breach wasn't within six months. The security breach had been going on for years.
make assumptions
In a production environment it is not uncommon to have 200-400 processes running per day on a single system. Heavy users may reach four figures. Assuming 200, analysts typically apply the 80/20 rule. So for 80% of the process, we can confidently explain why it's happening, run a few searches to validate it, and rule it out quickly. That leaves about 40 process executions for analysts to scrutinize.
In a traditional SIEM environment, 96 different queries were required to create the incident timeline needed to describe the entire flow of events. It took an average of 12.9 minutes to run each query and analyze the results. In total, it will take 20.64 hours, which is well above the average working hours of one worker. Since the survey results will be handed over between analysts, there is a risk that some of the findings obtained in the survey will be lost due to the handover.
A user named Frederick Weber stood out in this series of attack simulations. A real-world investigation would need to determine whether Weber himself was performing the observed activity on the account, or whether there was an attacker using Weber's account. On the other hand, if the incident really points to Weber, we also need to consider whether there is a possibility that Weber is being bought or threatened by an outside party. Manually, it is very difficult for analysts to reliably detect deviations from normal behavior across large datasets. It is a very labor-intensive task and error-prone.
Focusing on Weber's timeline in the simulation, I set the short term search query to the first tab (Tab 1) and the long term query to the second tab (Tab 2). This increases the speed of switching and comparing Weber's activity to the historical norms of the user (Weber) and the entire organization.
We then extrapolated some conclusions from the simulated environment.
connect the pieces of the timeline
I started by investigating conhost.exe. This is the host process Weber was running, shown in Tab 1 (see Figure 3). Switching to Tab 2 and observing the March-May period, conhost.exe has 1,243 entries. A possible interpretation of this manual analysis is that the frequent appearance of conhost.exe in this environment is normal. They may not be concerned that it is malware or that attackers are leveraging it.
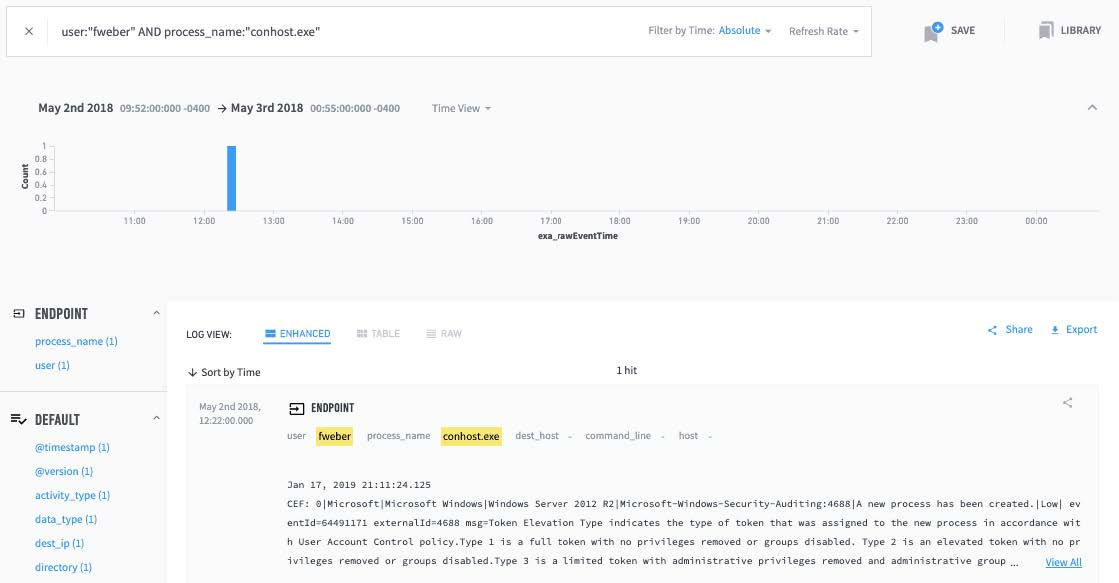
Figure 3: Tab 1 shows conhost.exe process execution by Subject Frederick Weber
Indicates a short-term search for activity.
I wasn't sure, so I asked a member of the SOC team about conhost.exe. This member suggested that I check the usage in my peer group. Frederick Weber belongs to a group of web developers. It turned out that Weber wasn't the only one in the peer group running conhost.exe during the two months (see Figure 4).
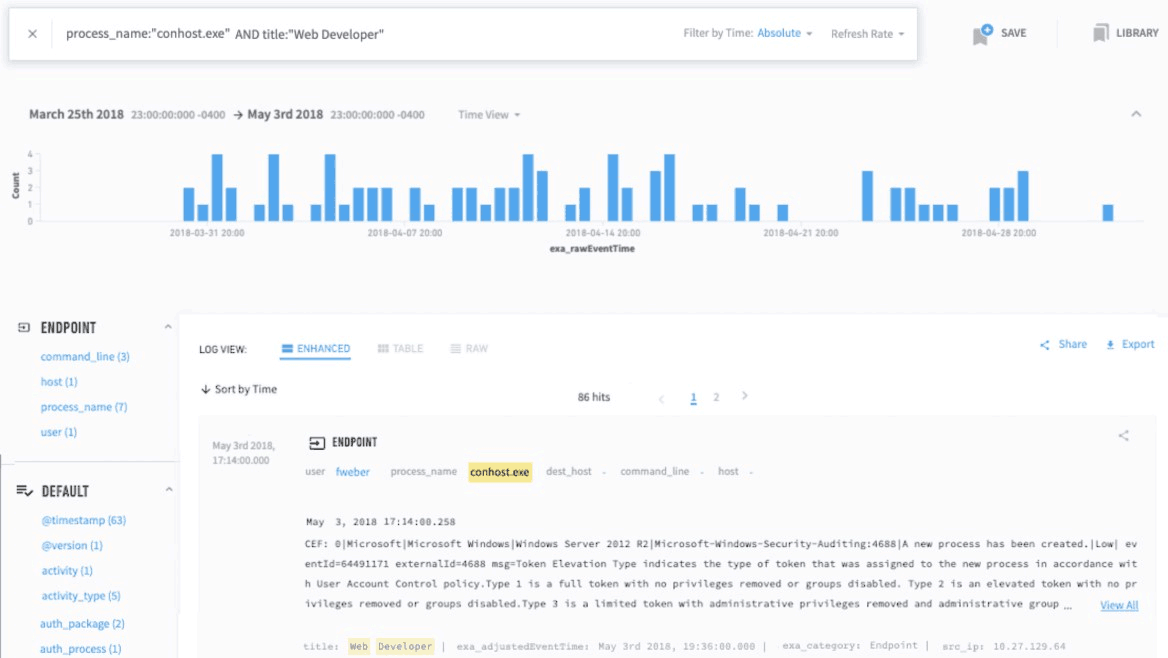
Figure 4: Tab 2 shows conhost.exe process execution by Frederick Weber's peer group.
Indicates a long-term search for activity.
After all, conhost.exe was a console window host that ran every time a user opened a command prompt window. It's up to the analyst to see that. Moreover, the command prompt is thought to be used by many people other than Weber.
Here we look at what an analyst might know in a simulation with limited test data. As the hours ticked by, I determined that conhost.exe was a false positive.
By the way, what is tab 1 barbarian.jar? Why is this file only hit once in the two month timeline shown in Tab 2? It doesn't appear that anyone other than Weber has run this file before in this environment. This is clearly an anomaly and requires further investigation.
Now let's take a break. In the following articles, we will discuss how to build a timeline from separate logs and evidence, the questions to ask, and how to utilize a reliable and automated system to create the investigative timeline.

Erik Randall
Exabeam, Inc. Sales Engineer
Inquiry/Document request
In charge of Macnica Exabeam Co., Ltd.
- TEL:045-476-2010
- E-mail:exabeam-sales@macnica.co.jp
Weekdays: 9:00-17:00