- 半導体事業HOME
- マクニカの製品・サービス
-
技術情報

-
イベント・セミナー
- 取扱メーカー
- サポート
- お問い合わせ
- 製品購入はこちら
- 半導体事業のメルマガ登録
![]()
![]() 条件を指定して絞り込む
条件を指定して絞り込む
現在2189件がヒットしています。check

はじめに
こんにちは、とぷぅです。
今回は前回(Quartus® と基板シミュレーションの関係 ~IBIS ファイルの導き①~ )のつづきです。
前回でシミュレーション用のトポロジー作成とモデルの割り当てが完了したので、今回はいよいよシミュレーションしてみましょう。
シミュレーションの実行
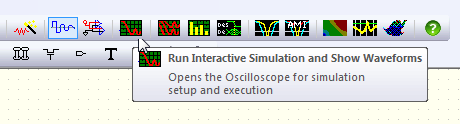
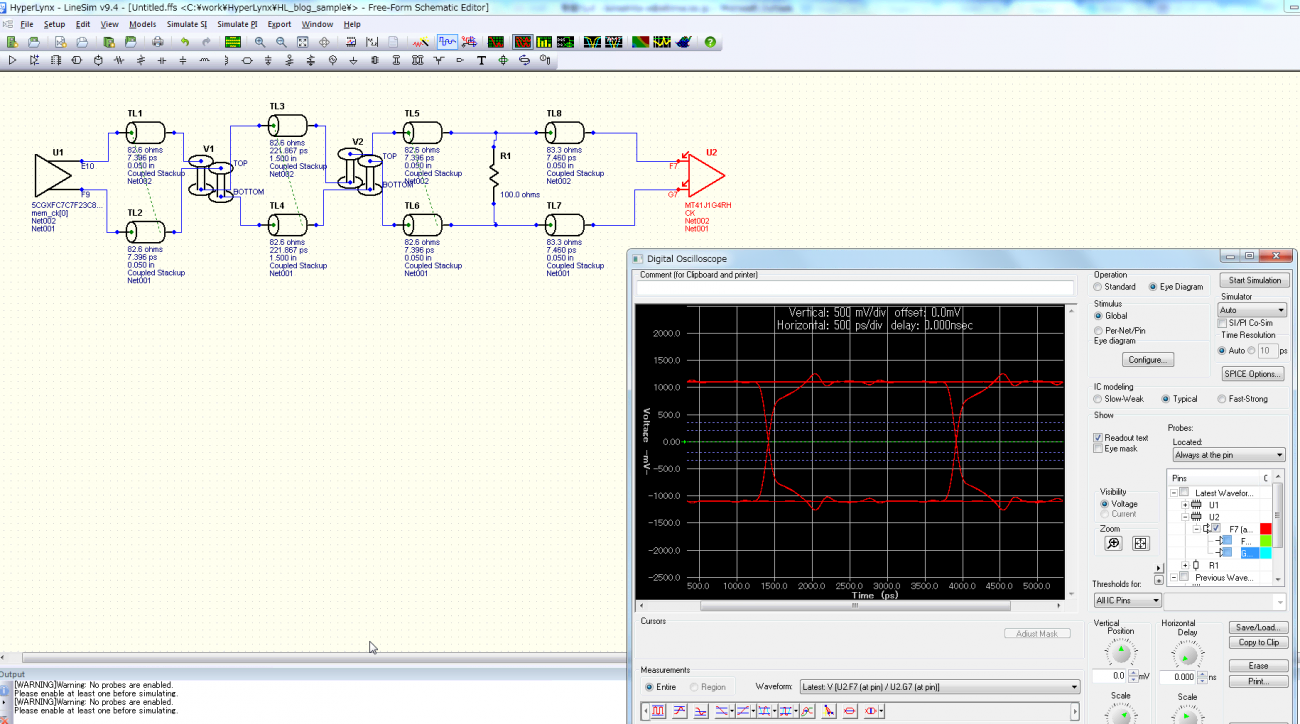
HyperLynx® で前回作成したトポロジーを開き、Run Interactive Simulation and Show Waveforms を起動します。
Digital Oscilloscope ウィンドウが起動します。
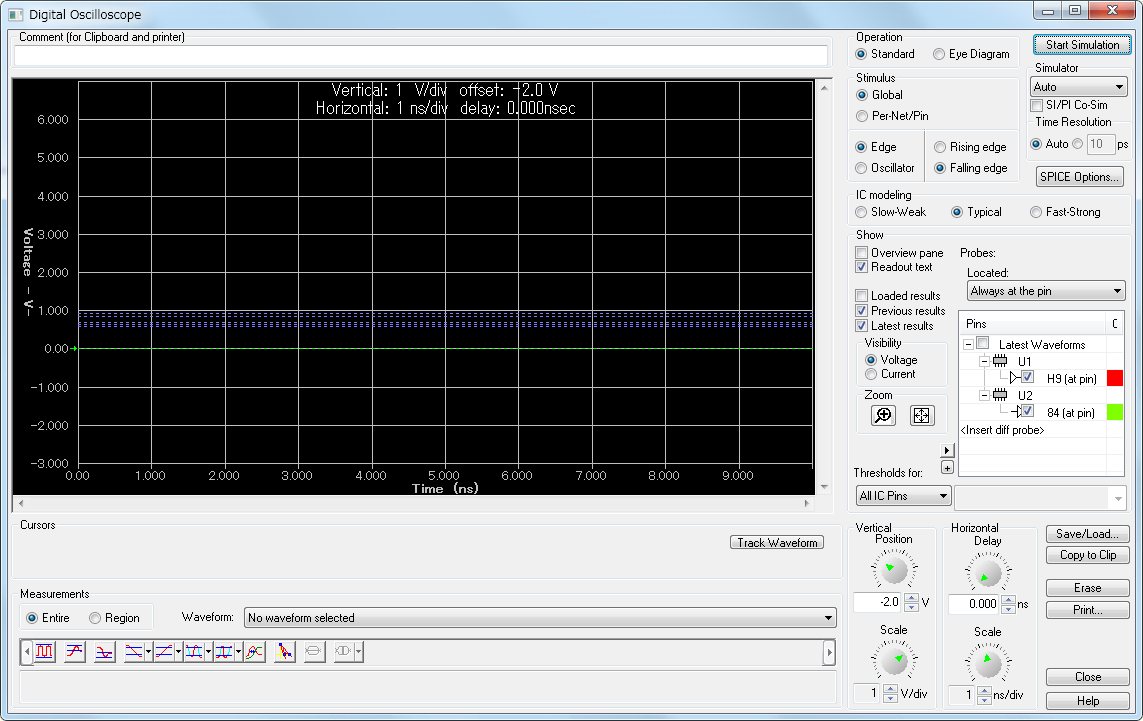
Digital Oscilloscope では IBIS シミュレーションの結果を波形で表示します。
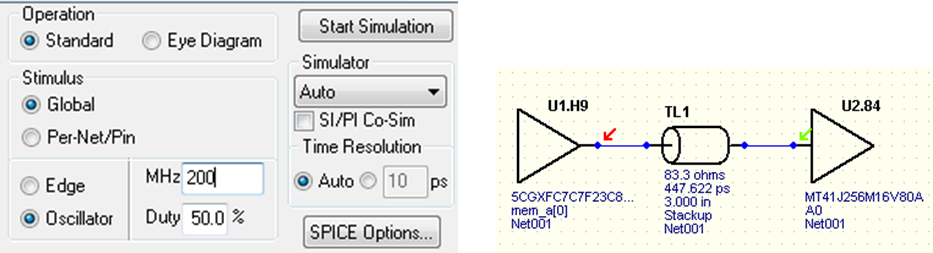
今回は Oscillator で 200MHz の信号をドライバから出力した場合をシミュレーションしてみます。設定は以下(図3)の通り。
Start Simulation をクリックしてシミュレーションスタートです。
シミュレーションが完了すると、図3 のように波形が表示されます。
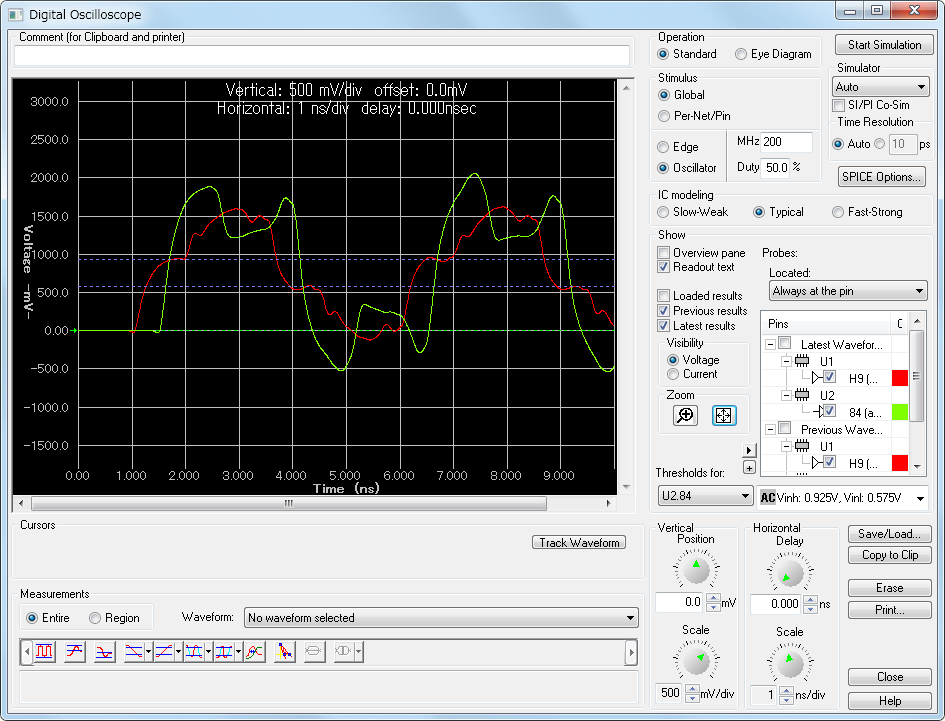
2 つ波形が表示されていますが、赤がドライバ、黄緑がレシーバ側の波形です。
レシーバ(緑)波形に注目すると波形が大きく乱れているのがわかります。
これらは伝送路での信号の反射などによるものです。
信号歪みの原因を知りたい方はこちらの記事を読んでみてください!
今回はドライバとレシーバを接続しただけの非常に簡単なトポロジーでシミュレーションしました。
実際は図5 のように基板上で想定されるトポロジーを Schematic 上で作成してシミュレーションを行い波形をチェックしていきます。
このように基板作成前にシミュレーションを行うことにより、伝送路長、配線幅などによる影響を確認して、基板設計に反映させることができ、手戻りの少ない設計フローを確立することができるのです。
今回は Quartus にて生成した IBIS ファイルのシミュレーション方法をご紹介しました。
HyperLynx を使用すればさまざまな検証が可能です。またの機会にご紹介します。お楽しみに。
MentorGraphics Virtual Lab
HyperLynx を使ってみたくなった皆さん。
持ってない。。。という方でも大丈夫!以下サイトから、どなたでもHyperLynxをお試しいただけます!
<MentorGraphics 社 HyperLynx SI Virtual Lab>
https://www.mentor.com/pcb/product-eval/hyperlynx-si-virtual-lab
こちらはクラウド環境を使って、製品を購入していないお客様にも簡単に MentorGraphics 社製品を体験してもらおうというものです。
簡単なユーザー登録でツールの体験ができますので、ぜひお試しください!
最後にワンポイント★
IBIS モデルは Web サイトからも入手することができます。
Web から入手したファイルと Quartus で生成したもののモデル選択画面を見比べてみましょう。左が Quartus で生成したもの、右が Web から入手したものです(図6)。
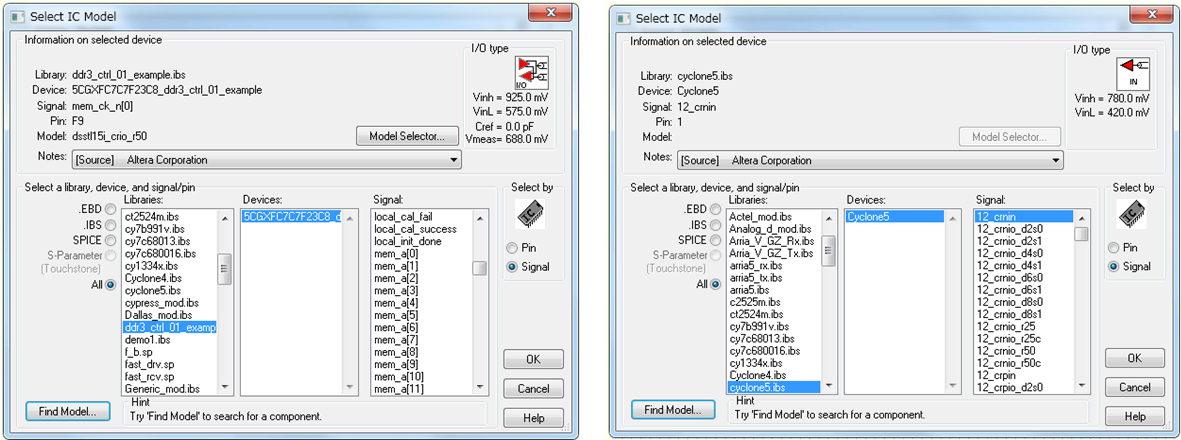
Signal の部分に注目してください。
右は 12_crnio_d2s0 や 12_crnio_d2s1 など似たような名前が並んでいます。これは Cyclone® V デバイスの IO で選択できるピン設定の組み合わせに対するすべてのモデルです。Cyclone V の場合は 3000以上の設定の組み合わせがあります。この中から自分の使用するピン設定に対するモデルを選択するのは大変ですね。
一方、Quartus のプロジェクトから生成した ibis は各ピンの設定や名前を反映した IBIS ファイルを生成することができます。これだとモデルの選択も簡単にできるのです!
<あわせてチェック!>
Quartus と基板シミュレーションの関係 ~IBIS ファイルの導き①~ はこちら。