- 半導体事業HOME
- マクニカの製品・サービス
-
技術情報

-
イベント・セミナー
- 取扱メーカー
- サポート
- お問い合わせ
- 製品購入はこちら
- 半導体事業のメルマガ登録
![]()
![]() 条件を指定して絞り込む
条件を指定して絞り込む
現在2183件がヒットしています。check


こんにちは。
マクニカでインテル® FPGA 製品の技術サポートをしている インテル・F・ハナコ です。
System Console (システム・コンソール)は、FPGA でデザインを実動作させながら JTAG 経由のデバッグが行える Quartus® Prime に搭載されているデバッグツールです。
JTAG を経由して System Console に接続されているペリフェラルに対するレジスタ・アクセスや、JTAG マスターのクロックの確認などができます。
また、簡単なレジスタ・アクセスであれば、Nios® II プロセッサーを実装していなくても System Console でデバッグが可能です。
今回は、簡単なサンプルを用いて System Console をご紹介します。
対象環境
| Quartus Prime | Pro Edition / Standard Edition / Lite Edition |
| 対象デバイス | Quartus Prime の各エディションがサポートする全デバイス |
| 通信ケーブル |
インテル FPGA ダウンロード・ケーブル II (旧称 USB-Blaster II) On-Board インテル FPGA ダウンロード・ケーブルII インテル FPGA ダウンロード・ケーブル (旧称 USB-Blaster) On-Board インテル FPGA ダウンロード・ケーブル |
使用要件
System Console を使用するためには、プロジェクト・デザインにおいて
以下のいずれかのペリフェラルが組み込まれている必要があります。
・ JTAG to Avalon Master Bridge (JTAG Master)
・ Nios II Processor (JTAG Debug モジュール付き)
・ USB Debug Master
・ Avalon-ST (Streaming) JTAG Interface
・ JTAG UART
・ Ethernet コンポーネント
サンプルデザイン
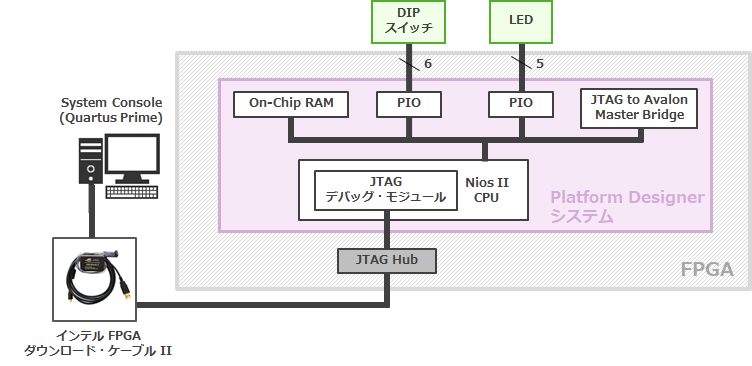
ここで使用するサンプルデザインの構成は、以下のとおりです。
今回は System Console を使用して、クロック信号およびリセット信号の状態確認や、
DIP スイッチの PIO、LED の PIO、オンチップ RAM へアクセスします。
ここでは、Quartus Prime Standard Edition の GUI を使用して操作をご紹介します。
System Console のデバッグフロー
System Console を使用するための作業フローは、以下のとおりです。
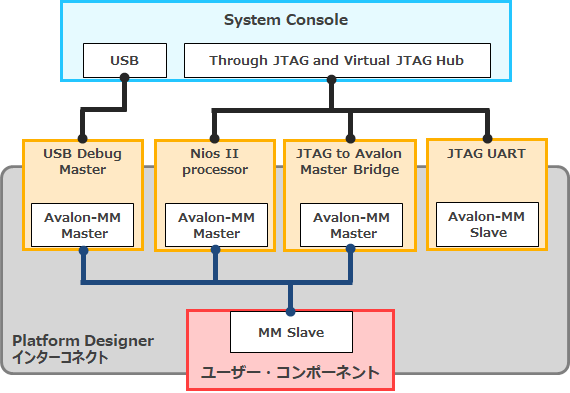
1. Platform Designer システムに IP コアを追加、生成
System Console を使用するために必要な IP を、Platform Designer システムに組み込みます。
今回のサンプルデザインで使用したコンポーネントは、以下のとおりです。
・Nios II Processor (JTAG Debug モジュール付き)
・JTAG to Avalon Master Bridge
・On-Chip Memory Intel FPGA IP
・PIO Intel FPGA IP (2つ)
Note:
簡単なレジスタ・アクセスだけであれば、Nios II だけでもデバッグが可能ですが、
今回は JTAG Debug サービス(コマンド)を使用するため、JTAG to Avalon Master Bridge も接続しています。
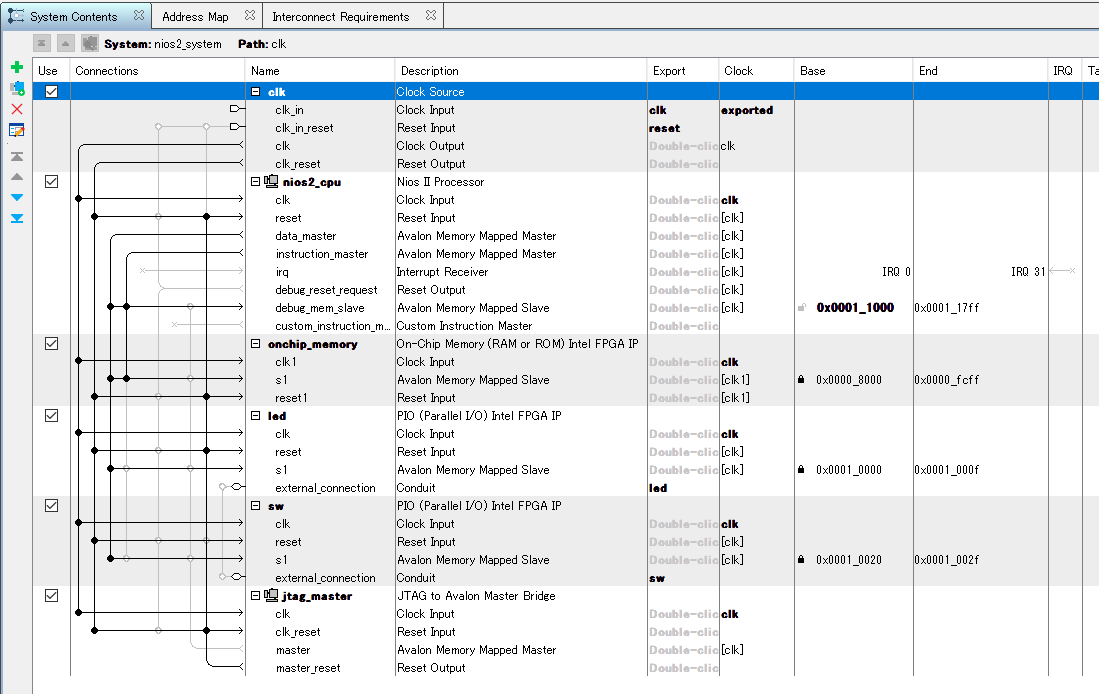
Platform Designer において各コンポーネントを登録後、System Contents タブで接続します。
Avalon Memory Mapped Master (以下、Avalon MM Master)は、操作したいコンポーネントの Avalon Memory Mapped Slave (以下、Avalon MM Slave) へ接続してください。
Note:
今回のサンプルデザインは一例として、Master サービスを Nios II の Avalon MM Master に実行させ、
JTAG Debug サービスを JTAG to Avalon Master Bridge の Avalon MM Master に実行させる仕様にしています。
下図は、今回のサンプルデザインにおける接続を示したものです。
完成後、Platform Designer システムを保存し、Generate HDL を実行します。
2. デザインをコンパイル
作成した Platform Designer システムをデザインに組み込み、プロジェクトに登録します。
その後、コンパイルを実行します。
3. ボードを接続し、FPGA をコンフィグレーション
① ボードとダウンロード・ケーブルを接続し、ボードに電源を投入します。
② Quartus Prime の Programmer を起動し、Hardware Setup やダウンロードする sof ファイルの選択など
各種設定を行います。
③ Start ボタンをクリックし、コンフィグレーションを完了させます。
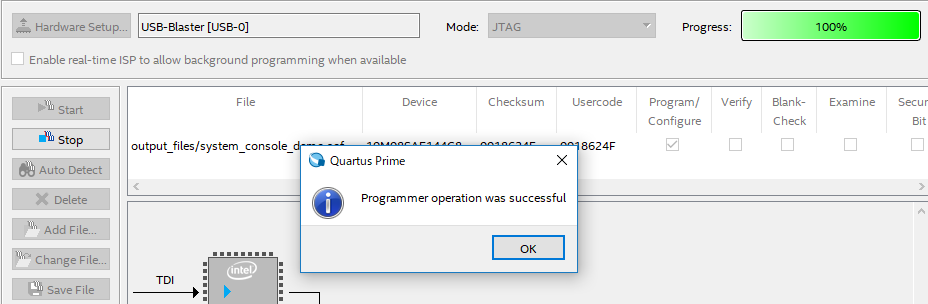
④ Programmer を閉じます。
なお、FPGA のコンフィグレーション(.sof をダウンロード) は、ここで行わず、
System Console 上からデバイスコマンド device_download_sof で実行することも可能です。
詳細は、"4. System Console を起動" をご覧ください。
4. System Console を起動
① System Console を起動します。
起動方法は以下の3通りありますので、開発状況に応じたいずれかの方法を選択してください。
A) Quartus Prime の Tools メニュー > System Debugging Tools >System Console
B) Platform Designer の Tools メニュー > System Console
C) Nios II Command Shell を起動し、system-console.exe コマンドを入力
② System Console の File メニュー > Load Design をクリックし、ダウンロードしている(ダウンロードする) .sof を選択します。
<すでに .sof をダウンロードしている場合は、次のステップへ進んでください。>
③ System Explorer ペインの devices フォルダー下にある接続先の FPGA に対して、
右クリック > Program device > "sof ファイル" をクリックします。
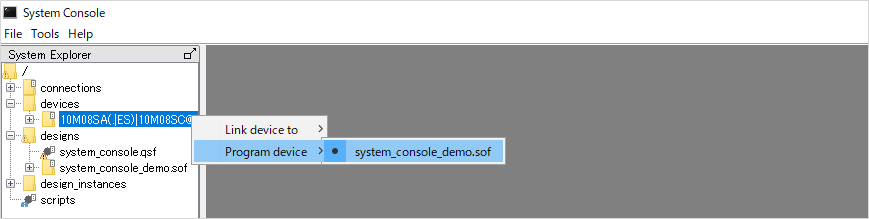
または、Tcl Console ペインに下記のコマンドを入力しても、FPGA をコンフィグレーションできます。
% get_service_paths device
% set dpath [lindex [get_service_paths device] 0]
% device_download_sof $dpath "sof ファイルのパス"5. サービスパスを指定し、サービスを特定
① Tcl Console ペインにおいて、get_service_pathsコマンドでパスを指定し、サービスを特定します。
なお サービスタイプのリストは、get_service_types コマンドで確認できます。
例えば 今回のサンプルデザインにおいて、
"DIP スイッチの PIO、LED の PIO、オンチップ RAM にアクセスする" 場合は master サービスを使用します。
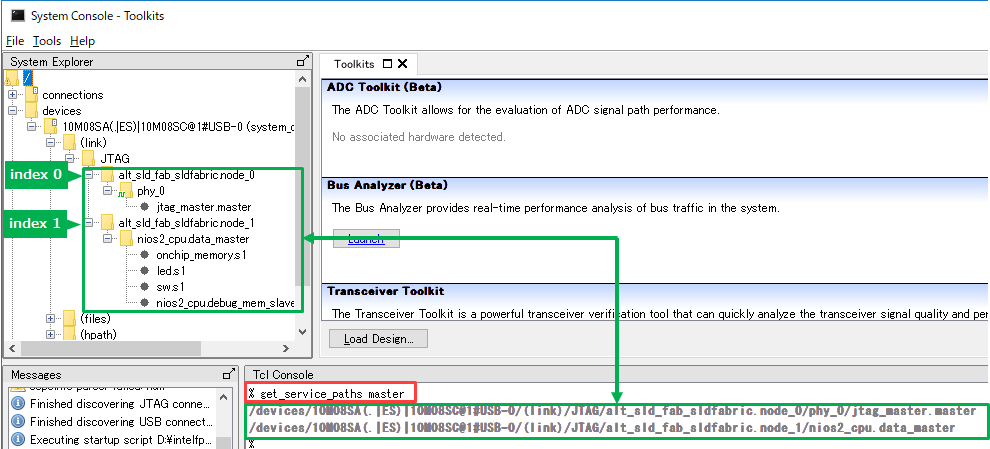
以下のように入力し、master サービスのパスを取得します。
% get_service_paths masterサンプルデザインでは、Avalon MM Master が2つ表示されます。
上記コマンドのログ以外に、System Explorer ペインの devices フォルダー > FPGA 型番 > (link) フォルダー > JTAG フォルダー下でも確認できます。
② サンプルデザインでは、Nios II の Avalon MM Master を介してメモリマップされた各スレーブを読み書きするので、
以下のように入力し、Nios II (Avalon MM Master) コンポーネントを指す変数を作成します。
※ mpath は変数。lindex は 1。
% set mpath [lindex [get_service_paths master] 1]6. サービスを開始
claim_service コマンドで、指定したサービスへの接続を開始します。
% claim_service master $mpath ""この後のデバッグ作業をしやすくするため、以下のコマンドで開始したサービスに変数を作成します。
% set master_path [claim_service master $mpath ""]Note : 上記コマンドを使用する場合は、claim_service master $mpath “” を同時に使用しているため、不要です。
7. デバッグ動作を実行
コマンドを使用して、接続されたデバイスを検証します。
以下に、今回のサンプルにおけるコマンド例をいくつか紹介します。
● クロックおよびリセット信号を確認する場合 / リセット信号を発行する場合
jtag_debug サービスを使用します。
サンプルデザインでは、JTAG to Avalon Master Bridge の Avalon MM Master を介してアクセスするので、以下のようになります。
※ jdpath は変数。lindex は 0。
 % set jdpath [lindex [get_service_paths jtag_debug] 0]
 % jtag_debug_sample_clock $jdpath
 % jtag_debug_sample_reset $jdpath
 % jtag_debug_reset_system $jdpath
・jtag_debug_sample_clock : クロック信号の値を返す (トグル確認には複数サンプリングが必要)
・jtag_debug_sample_reset : リセット信号の値を返す
・jtag_debug_reset_system : Avalon to JTAG Masterコンポーネントに接続されているすべてのコンポーネントにリセットを発行
● DIP スイッチの ON/OFF 状態を確認する場合
% master_read_8 $master_path 0x10020 1・master_read_8 : 指定したアドレスの値を読み出し
・0x10020 : DIP スイッチ用 PIOのアドレス
・1 : 読み出すサイズ
● LED の点灯/消灯を制御する
 % master_write_8 $master_path 0x10000 0x1F
 % master_write_8 $master_path 0x10000 0x0
・master_write_8 : 指定したアドレスに書き込み
・0x10000 : LED 用 PIOのアドレス
・0x1F、0X0 : 書き込む値
● オンチップ RAM の読み書きをする
% master_read_32 $master_path 0x8000 32・master_read_32 : 指定したアドレスの値を読み出し
・0x80000 : オンチップ RAM のアドレス
・32 : 読みだすサイズ
% master_write_32 $master_path 0x8000 {0 1 2 3 4 5 6 7 8 9 10}・master_wrote_32 : 指定したアドレスの値に書き込み
・0x80000 : オンチップ RAM のアドレス
・{0 1 2 3 4 5 6 7 8 9 10} : 書き込む値
その他のコマンドやサービスについては、下記ドキュメントをご覧ください。
| Quartus Prime | 参考ドキュメント |
|
Standard Edition Lite Edition |
Analyzing and Debugging Designs with System Console 「Intel Quartus Prime Standard Edition User Guide: Debug Tools」より |
| Pro Edition | 「Intel Quartus Prime Pro Edition User Guide: Debug Tools」より |
8. サービスを終了
close_service コマンドで、操作6で開始したサービスへの接続を閉じます。
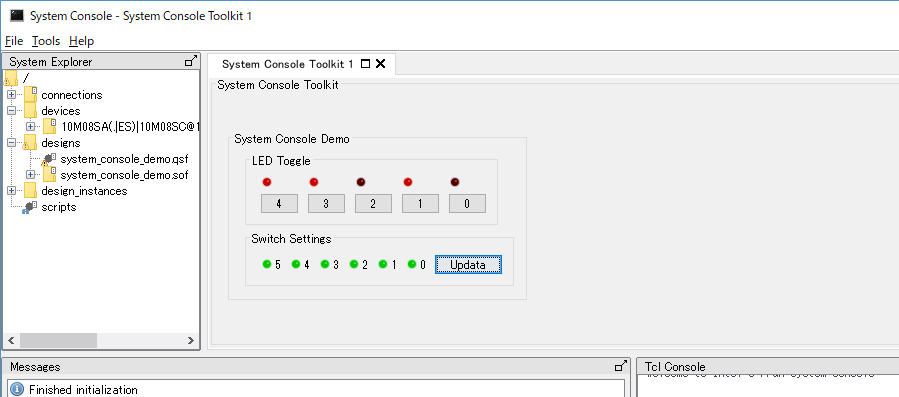
% close_service master $master_path[応用] Toolkit API で実行
System Console の Tcl Console ペインにその都度入力していたコマンドをスクリプト化し Toolkit API サービスを使用すると、デバッグデータを視覚化し、ボタンやテキストボックス、棒グラフやダイアルなどのグラフィカルなウィジェットで表示することが可能です。
次回は、Toolkit API をご紹介します。
まとめ
System Console を使用すると、システム・レベルのリード/ライト・トランザクションを Platform Designer システムに送信できるため、
問題の切り分けや特定に役立ちます。
また、システム・クロックの確認やリセット状態のモニタを素早く簡単に行うこともできるため、ボード立ち上げの際にも役立ちます。
System Console に関するコンテンツ (メーカー Web サイト)
Web ページ
System Console (英語)
※ Video Demonstrations に掲載されているリンク先のビデオを視聴する際は、
JavaScript の有効化、および Adobe Flash Player の最新バージョンが必要です。
オンライン・トレーニング (無償)
System Console (英語)
Youtube