- Semiconductor BusinessHOME
- Products and Services of Macnica,Inc.
-
technical information

-
Events and Seminars
- Handling Manufacturer
- Support
- Inquiry
- Click here to purchase products
- Semiconductor business e-mail magazine registration


 Narrow down by specifying conditions
現在2232件がヒットしています。check

[Notes]This content applies to Quartus® Prime Standard Edition and Lite Edition. This feature is not available in Pro Edition.
 Hello. I'm Hanako Altera from Macnica, providing technical support for Altera® FPGA products.
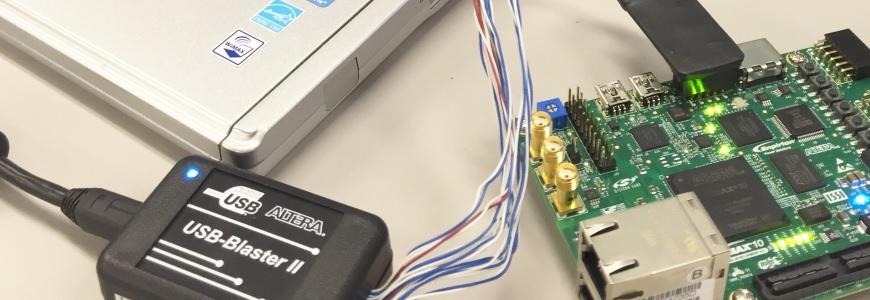
Quartus ® Prime includes on-chip debugging features as standard. Signal Tap Logic Analyzer However,
How do you select the internal signal of FPGA?
When registering internal signals you want to monitor in a user circuit to an STP file, you typically select them using a node search window called Node Finder.
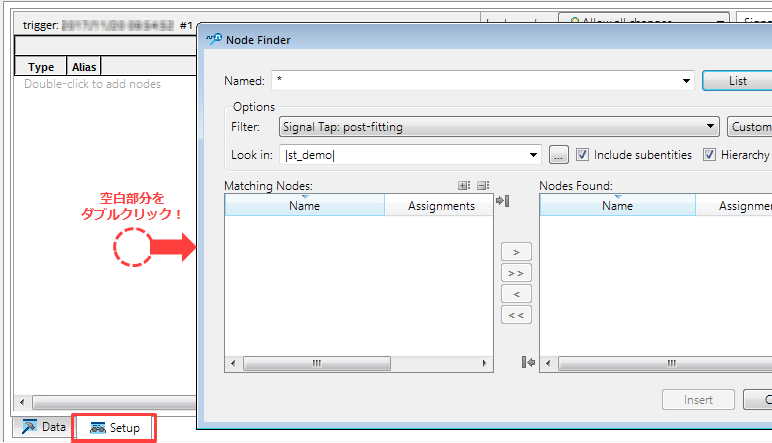
But finding a signal with Node Finder is because the signal name is only letters
It's hard to imagine which part of your design it is, and to be honest, it's hard to choose for users who don't have much experience working with Quartus® Prime.
In such a case, I recommend using the TechnologyMap Viewer to select internal signals! ! !
The Technology Map Viewer is a graphical viewer of the pre-synthesis and post-place and route netlists of your design.
There are two types, Post-Mapping and Post-Fitting, and the Post-Fitting viewer is used in Signal Tap this time.
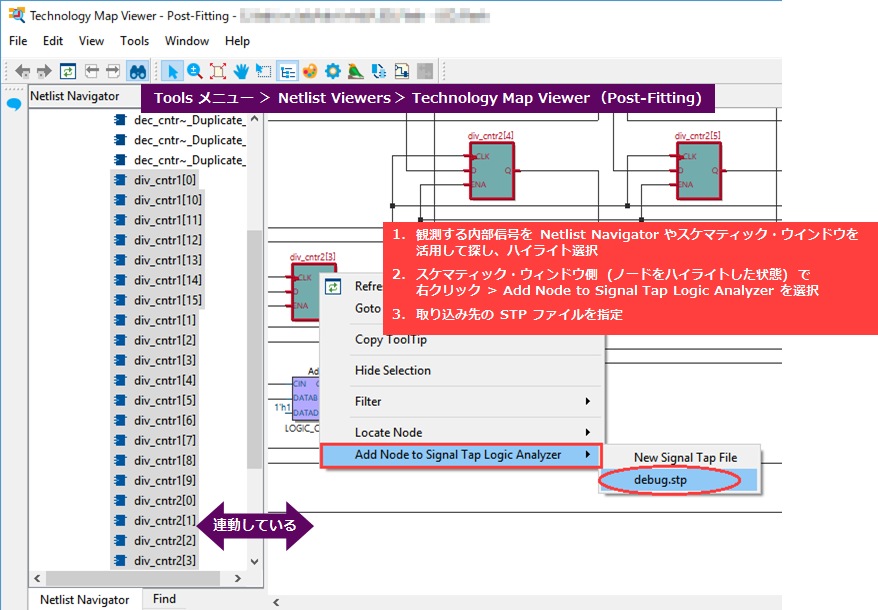
As shown in the diagram above, you visually search for the internal signals you want to monitor using the Technology Map Viewer (Post-Fitting) and import them into the STP file.
Some users may be using this viewer for the first time, but it's a viewer function that can be used in conjunction with various debugging tools, such as timing analysis, in addition to Signal Tap, so please do try it out.
Debugging will be easier if you can use each Netlist Viewer including Technology Map Viewer♪
Give it a try!
Click here for recommended articles/materials
Let's try FPGA on-chip debugging Signal Tap
Quartus® Getting Started Guide - How to Use the Signal Tap Logic Analyzer