Ultra-high-speed statistical calculation is possible with the metrics function! Splunk Enterprise 7.0 Released with Enhanced Graph Options

Major additions in Splunk Enterprise 7.0
今回リリースされた「Splunk Enterprise 7.0」では、下記の機能が追加されています。
- Addition of metrics function
-
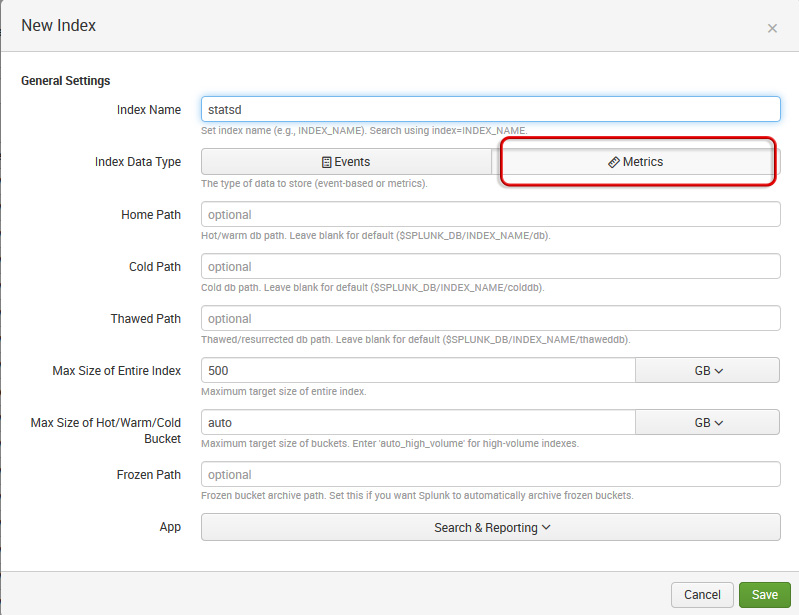
- Add a metric index
- Add Metrics Command
- Support for collected data using statsD and CollectD
- Improved data model acceleration
- Added monitor console function
-
- Added resource usage panel when ingesting data
- Added event annotation functionality
- Extended chart style
-
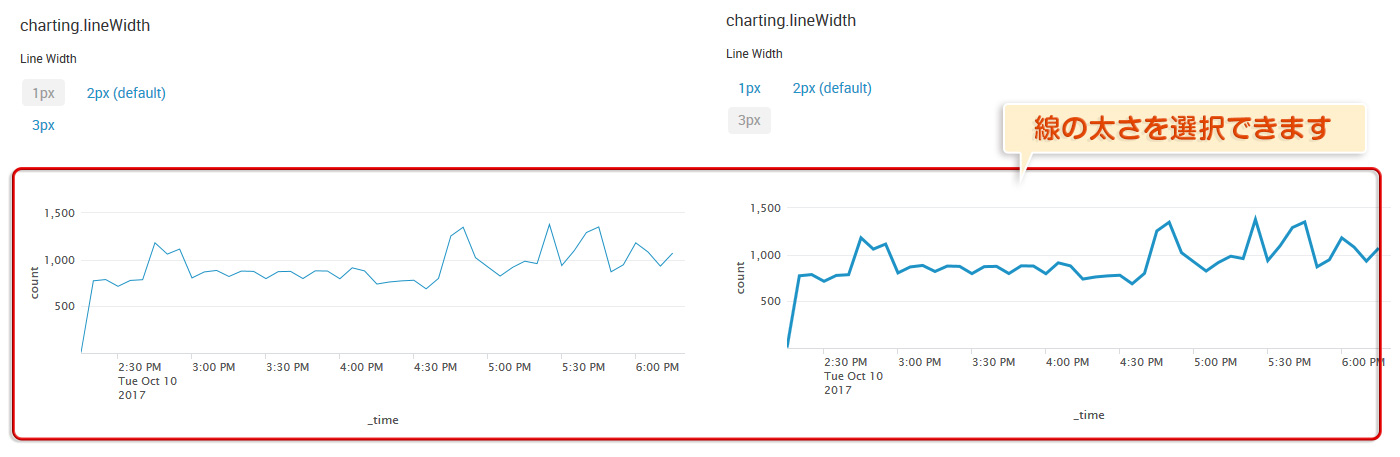
- Added line width selection option for polylines
- Added same time period comparison option
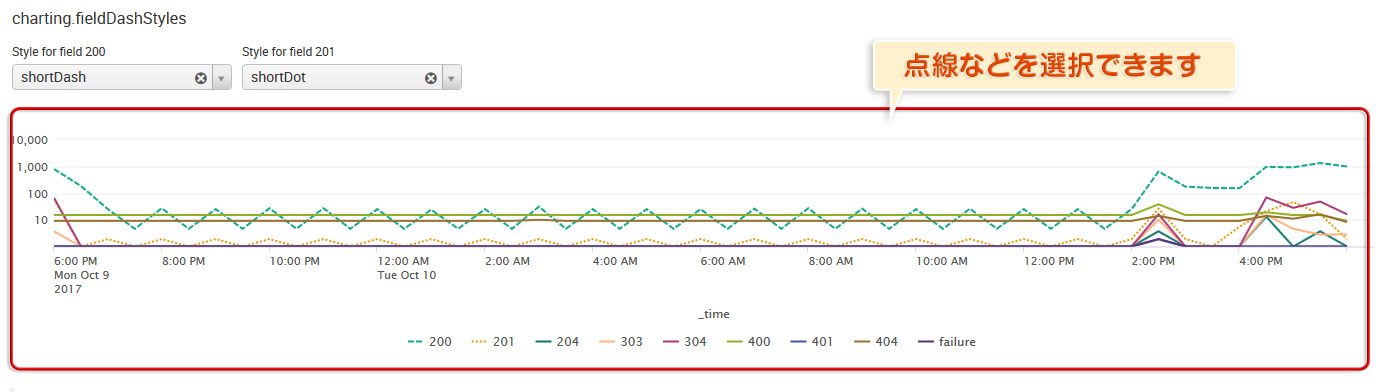
- Add polyline style options
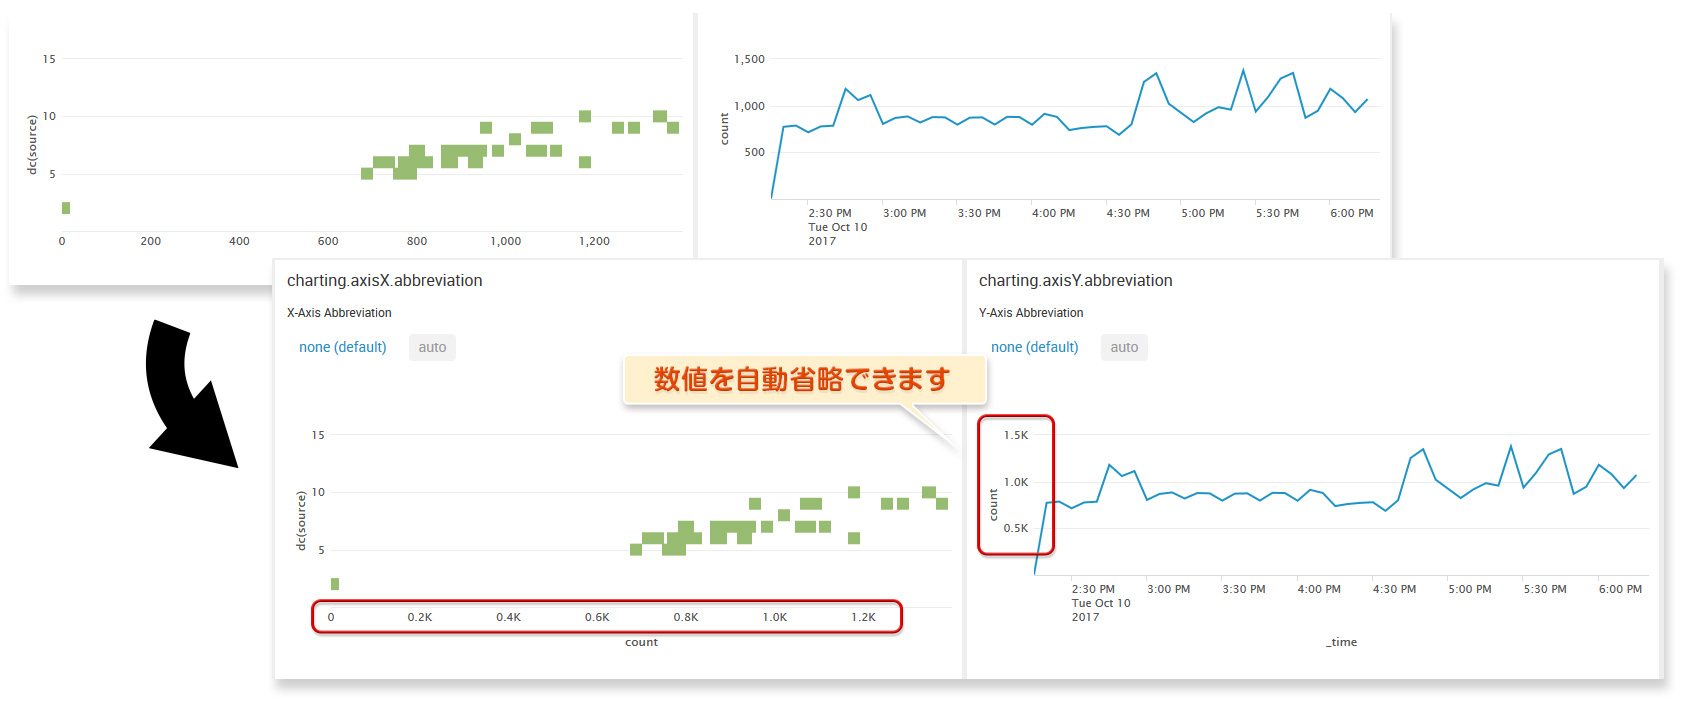
- Added option to omit display units
Addition of metrics function
Add a metric index
In order to achieve high-speed analysis of metric data, it is now possible to create an index dedicated to metric data.
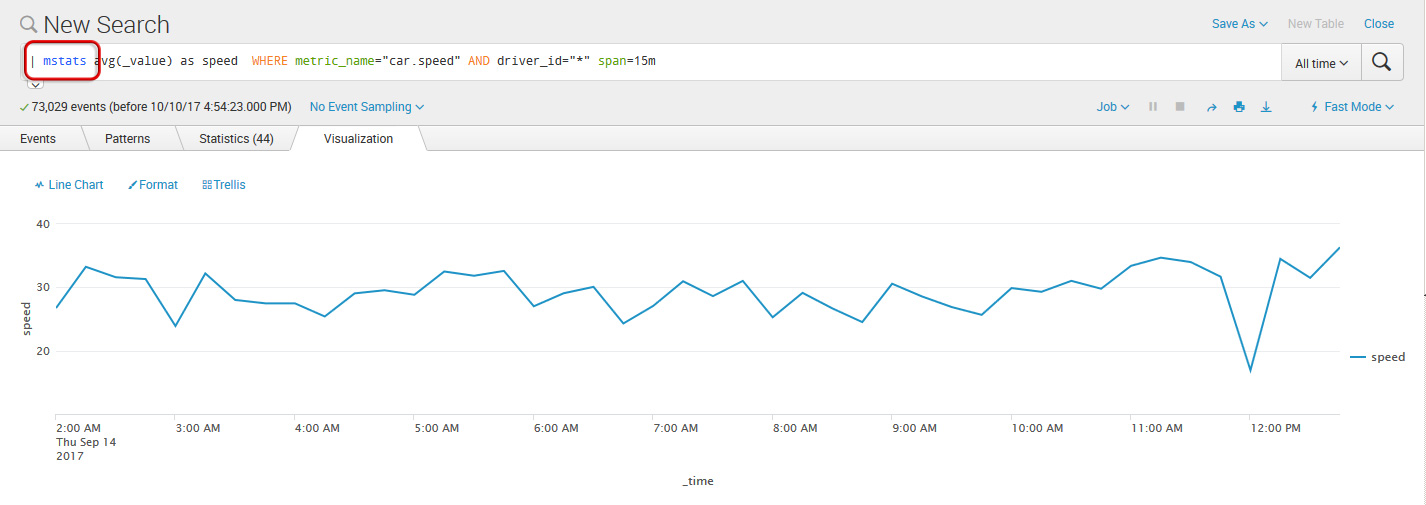
Add Metrics Command
The mstats command has been implemented as a command for high-speed analysis of metric data.
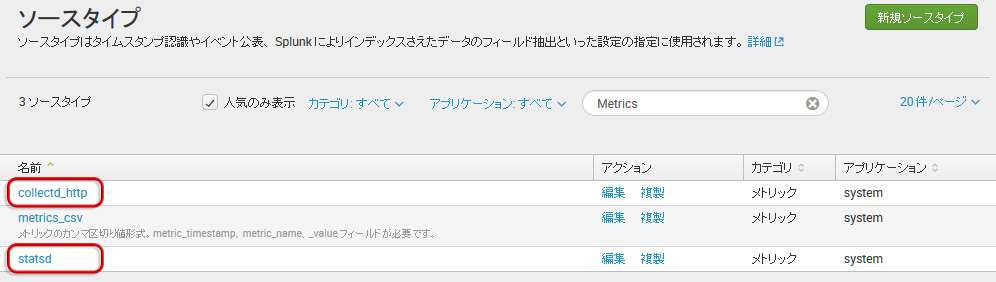
Support for collected data using statsD and CollectD
Added dedicated source types for metrics data collected using statsD and CollectD.
Improved data model acceleration
We improved the speed of the data model by parallelizing the data writing process, and improved the search performance by optimizing the internal search process.
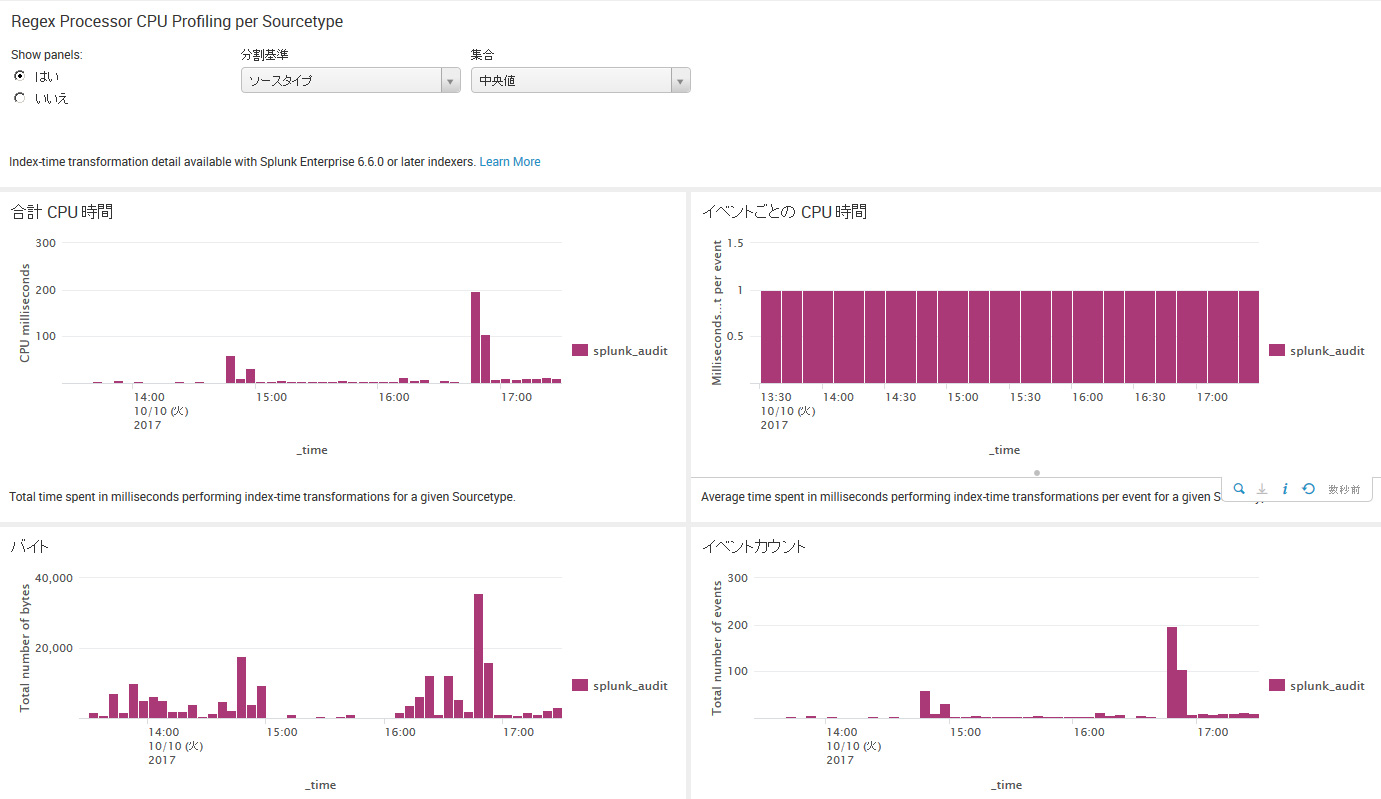
Added monitor console function
In the monitor console, it is now possible to check the processing load of field extraction using regular expressions when importing data for each source type.
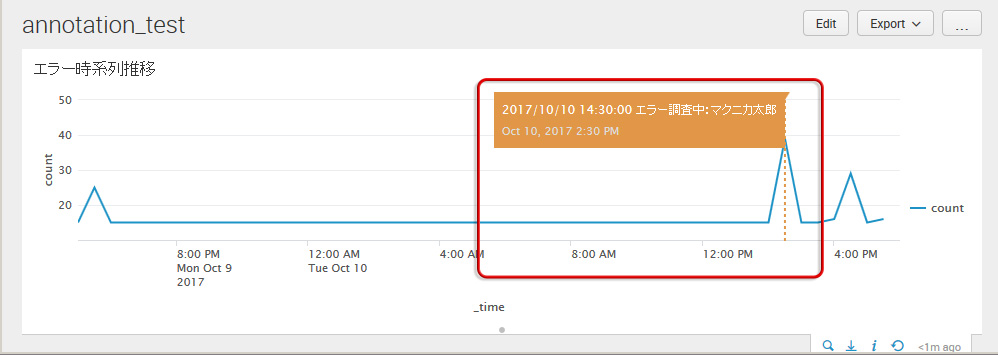
Added event annotation functionality
Graphs can now be annotated by importing annotation data.
Extended chart style
Added graph drawing options, such as graph line thickness and style.