- Connectivity Business HOME
- service·
solution -
event·
Seminar
-
Case studies, columns,
Blog
- Inquiry
product
- Transportation/storage status monitoring and tracking service - Macnica Tracks® -
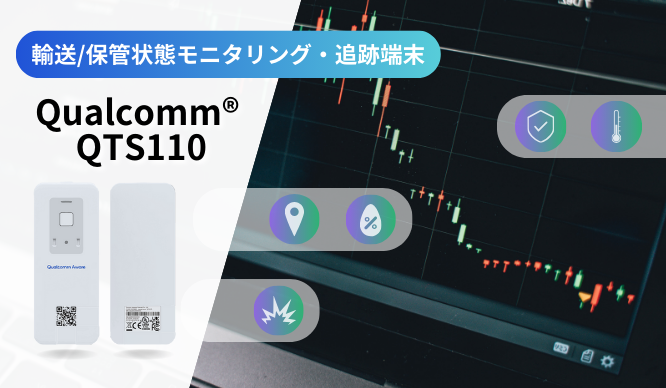
- Transportation/storage status monitoring and tracking terminal - Qualcomm® QTS110 -
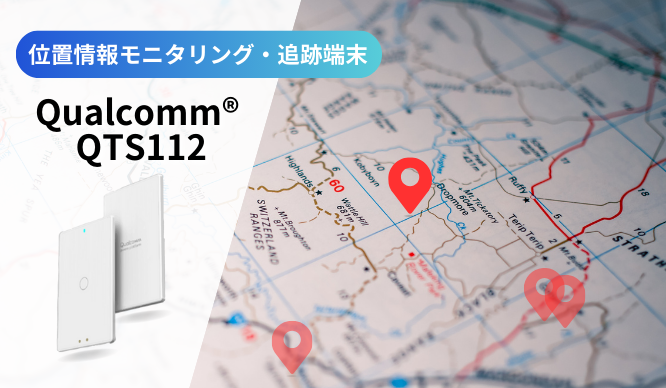
- Location monitoring and tracking device - Qualcomm® QTS112 -
- [FAQ] Transportation/storage condition monitoring and tracking service - Macnica Tracks® -
- List of documents
Are you able to monitor "brightness" during transport and storage? ~QTS110 Illuminance/Brightness Detection Demonstration Experiment Report~
Introduction
Unexplained shipping problems might actually have a clue in "brightness"...!
In logistics and transportation quality control, monitoring location information (GPS), temperature, and humidity is common. However, there are problems that cannot be prevented by these methods alone.
"The box was open upon delivery, but we don't know when or who opened it."
"There are signs that it was temporarily stored in an unexpected location and exposed to direct sunlight."
"The transshipment should have taken place during the night, but there is no evidence."
Illumination and brightness data make visible things that conventional sensors couldn't detect, such as "human intervention" and "sudden environmental changes."
This article explains the usefulness of the transportation and storage condition monitoring service "Macnica Tracks®" and the high-precision sensor terminal "QTS110" based on the results of a field test.
Recording illuminance and brightness data brings "accountability" to logistics.
The greatest feature of Macnica Tracks® is that it allows you to view multiple data points, including illuminance, in real time and all at once.
Four important pieces of information that can be gleaned from illuminance data
1. Tamper detection: When a sealed box or container was opened.
2. Indoor/Outdoor Discrimination: Identifying the timing of moving from inside the warehouse (dark place) to outside (bright place).
3. Signs of improper handling: Environmental changes during times when the system should not be operating, such as at night or on holidays.
4. Estimation of storage environment: Lighting conditions in the storage location and the effects of direct sunlight near a window.
These serve as objective evidence to prove "when, where, and what happened" in logistics.
Click here for details on each product/service solution.

Why is "illumination/brightness" important?
The following information can be gleaned from illuminance and brightness data:
- The timing when the cargo is moved from a dark place (inside a box, warehouse, or container) to a bright place.
- Time period when it may have been opened
• Switching between indoor and outdoor
- Signs of handling during nighttime or unexpected hours
In other words, illuminance and brightness are data that can be used to infer "human intervention" and "environmental changes."
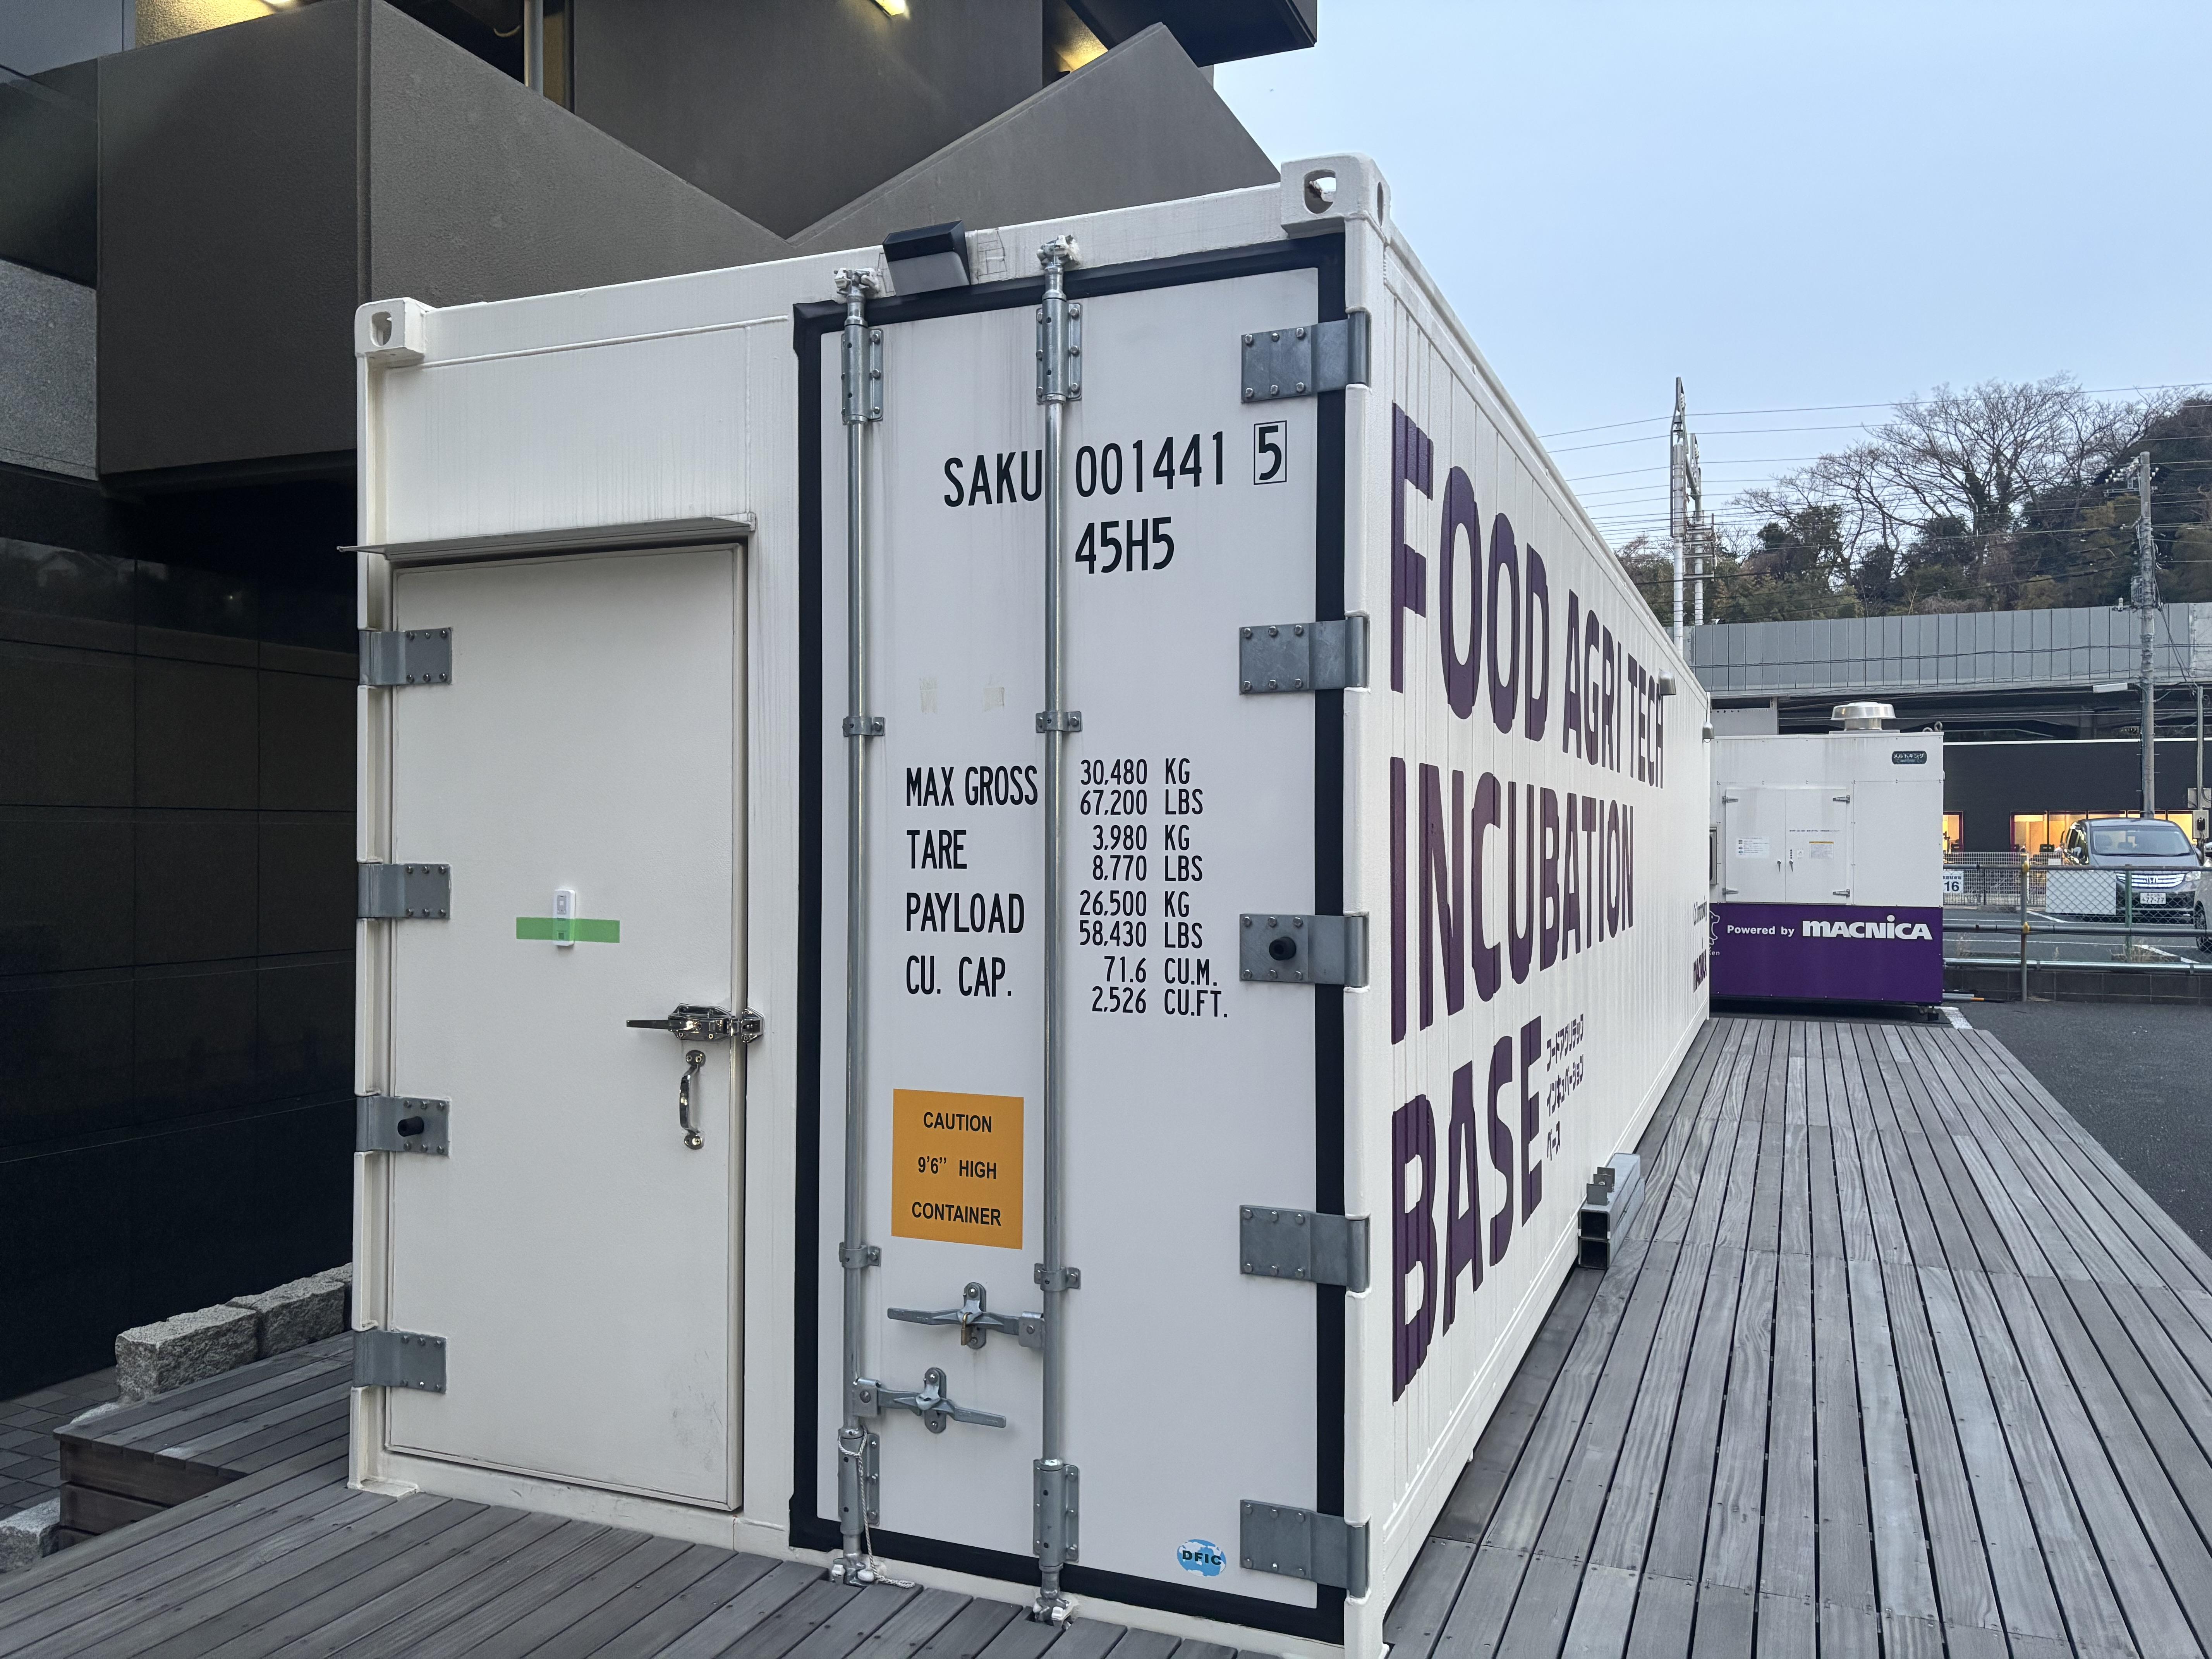
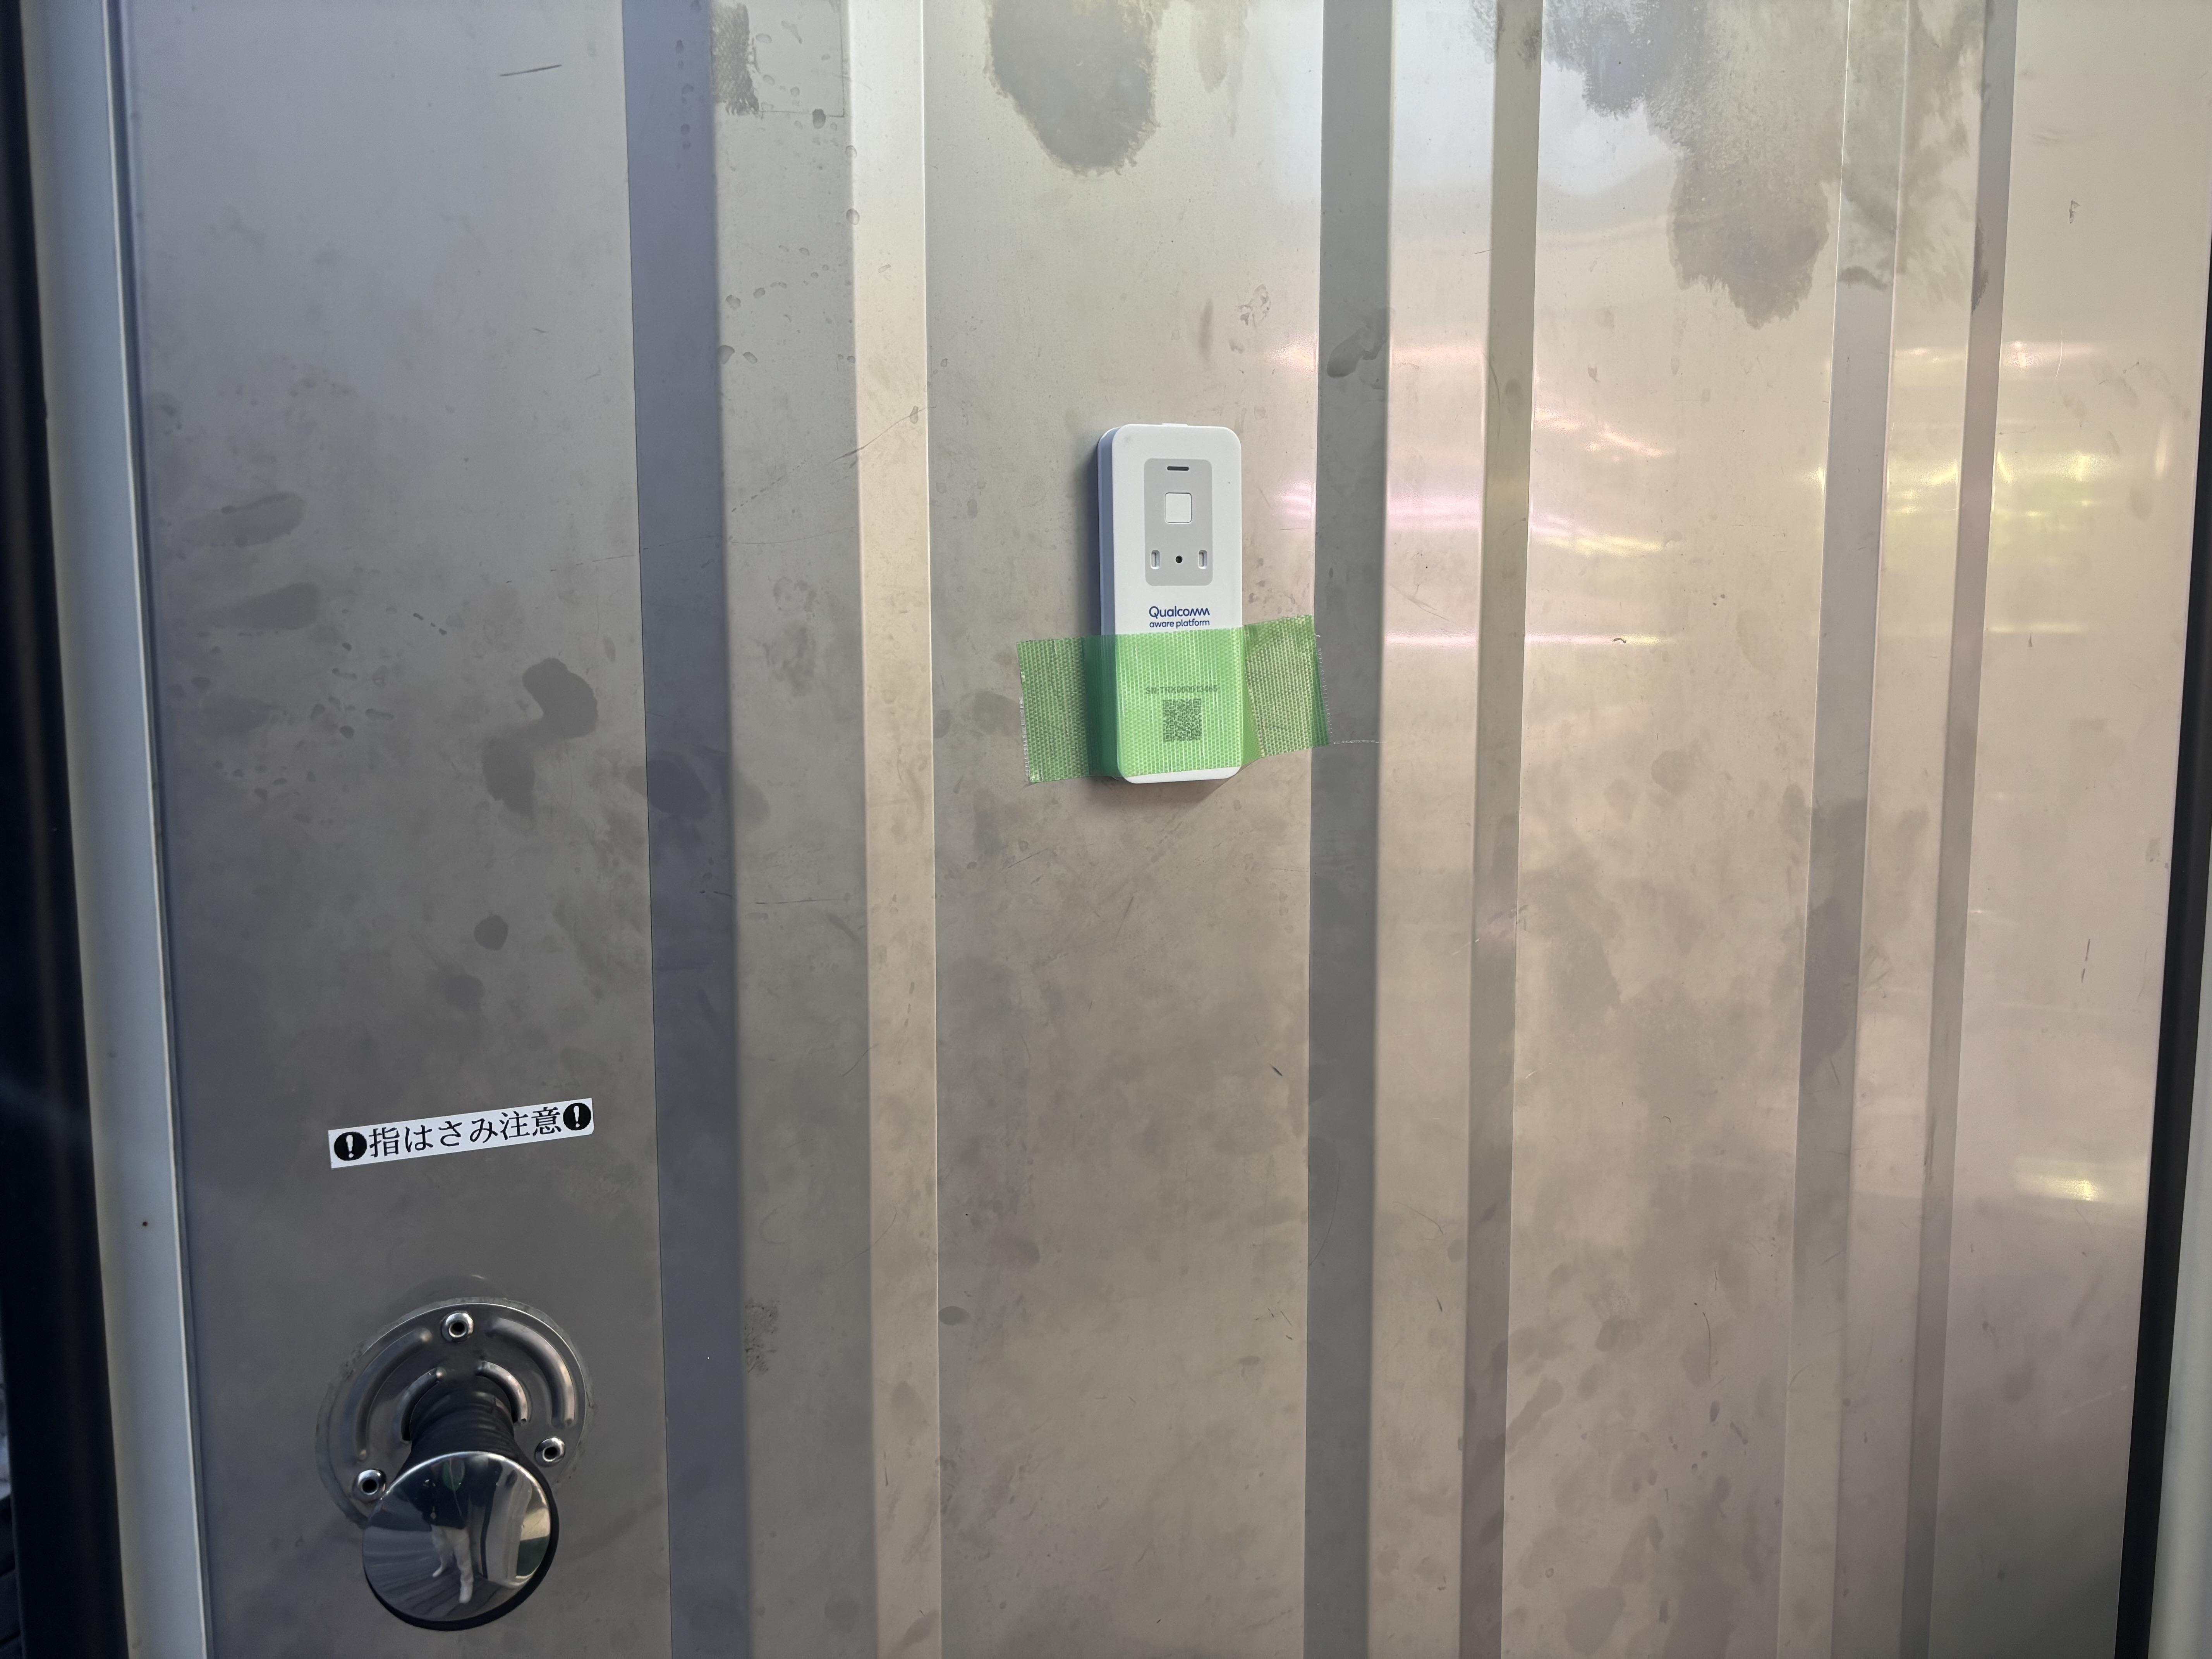
Overview of the demonstration experiment
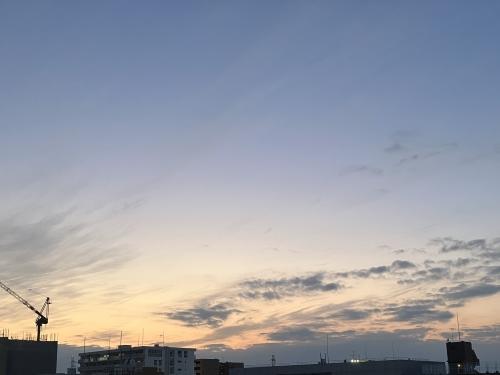
To simulate actual operation, sensor terminals were installed inside an outdoor container. We measured changes in brightness before and after sunset, as well as changes in illuminance associated with opening and closing the door.
• Service used: Macnica Tracks®
• Device used: Qualcomm® QTS110
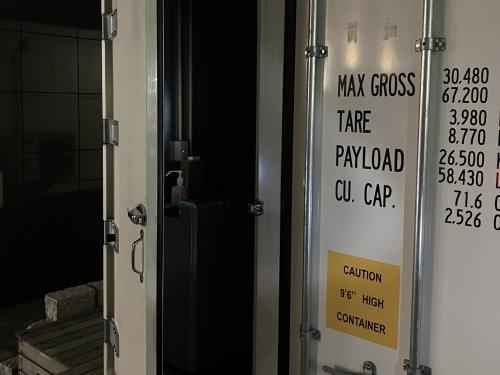
• Testing environment: Outdoor container
• Acquired data: Illuminance (lx), brightness/darkness
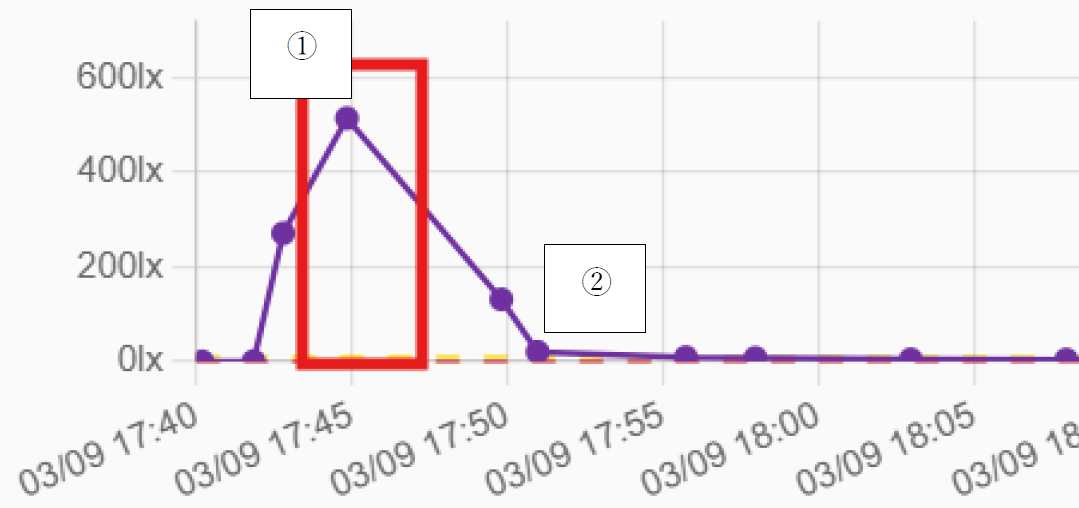
Illuminance detection results
The verification results confirmed that changes in illuminance (lx) can be obtained as time-series data in response to the ON/ OFF state of the lights and changes in the environment.
<Results time series>
|
order |
time |
detail |
Illuminance |
|
① |
17:46 |
Before sunset, the motion sensor detects light. |
514 lx |
|
② |
17:50 |
sunset |
8 lx |
|
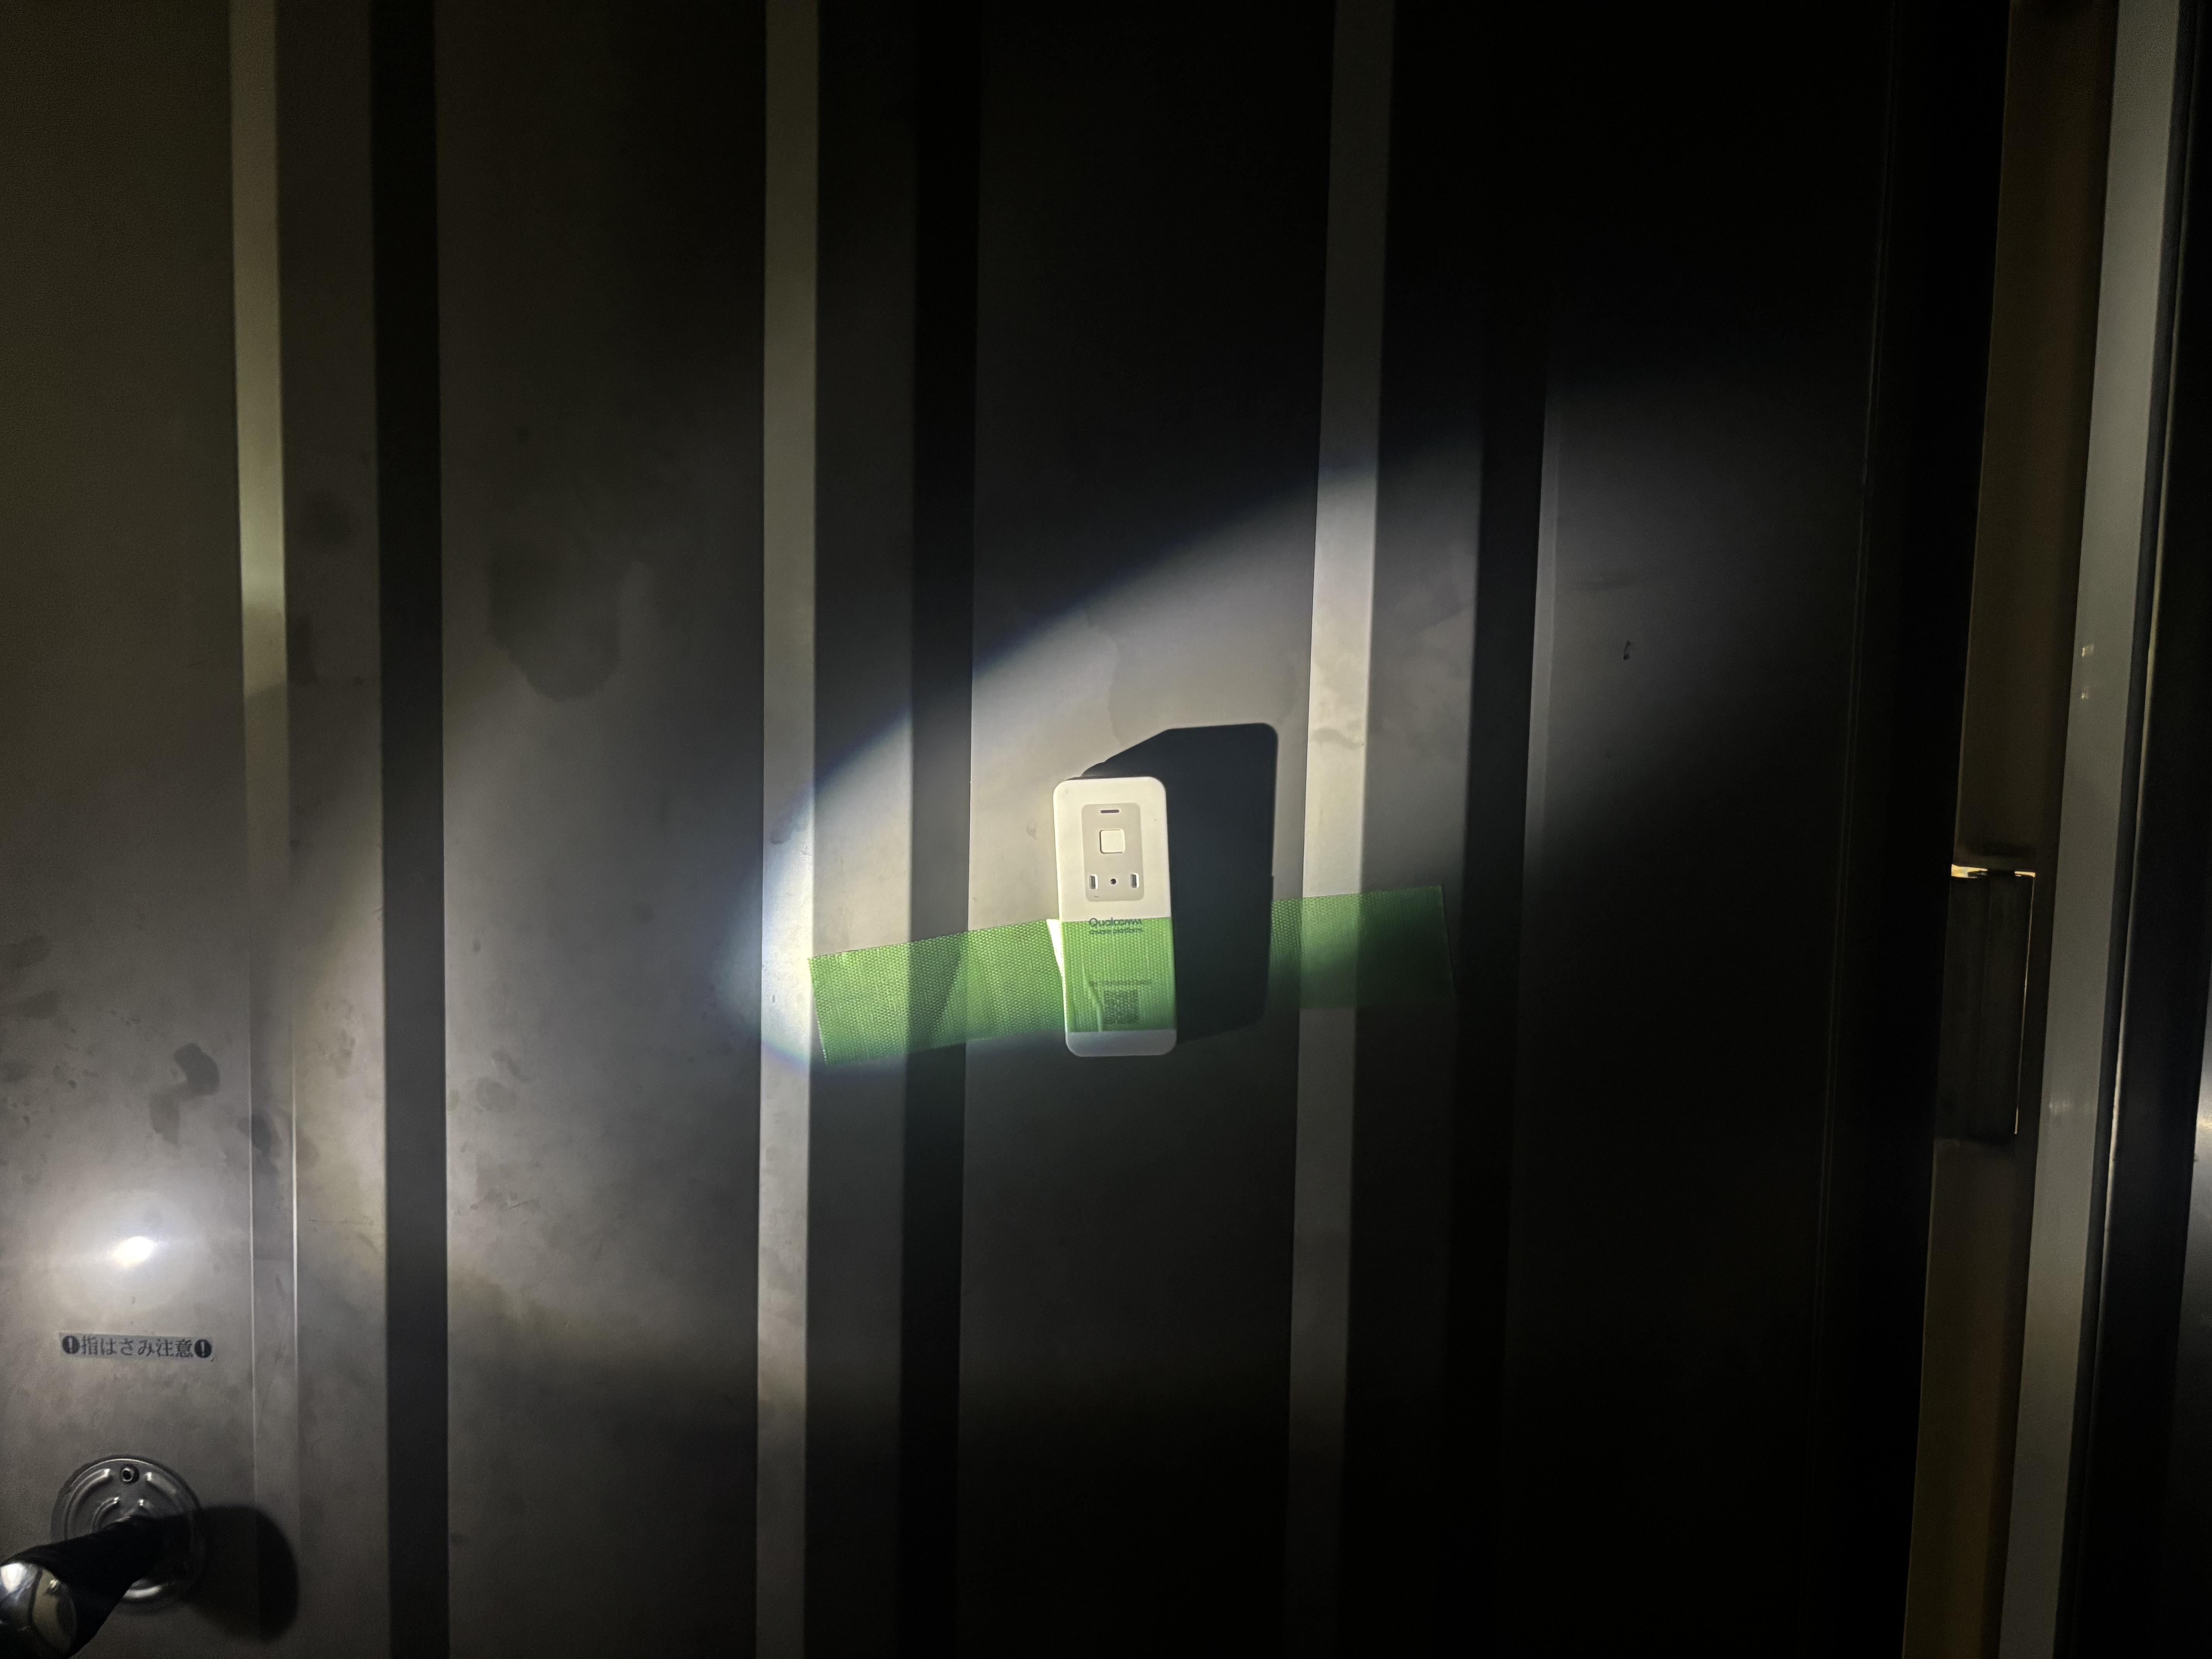
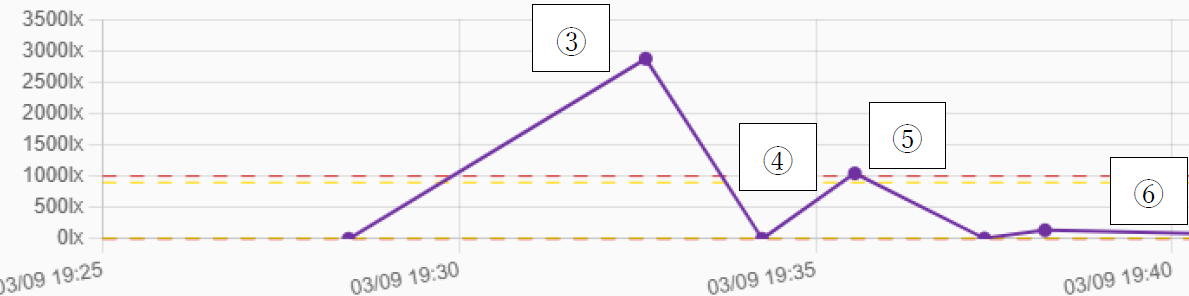
③ |
19:32 |
Open the container door and shine a flashlight inside. |
2873.5 lx |
|
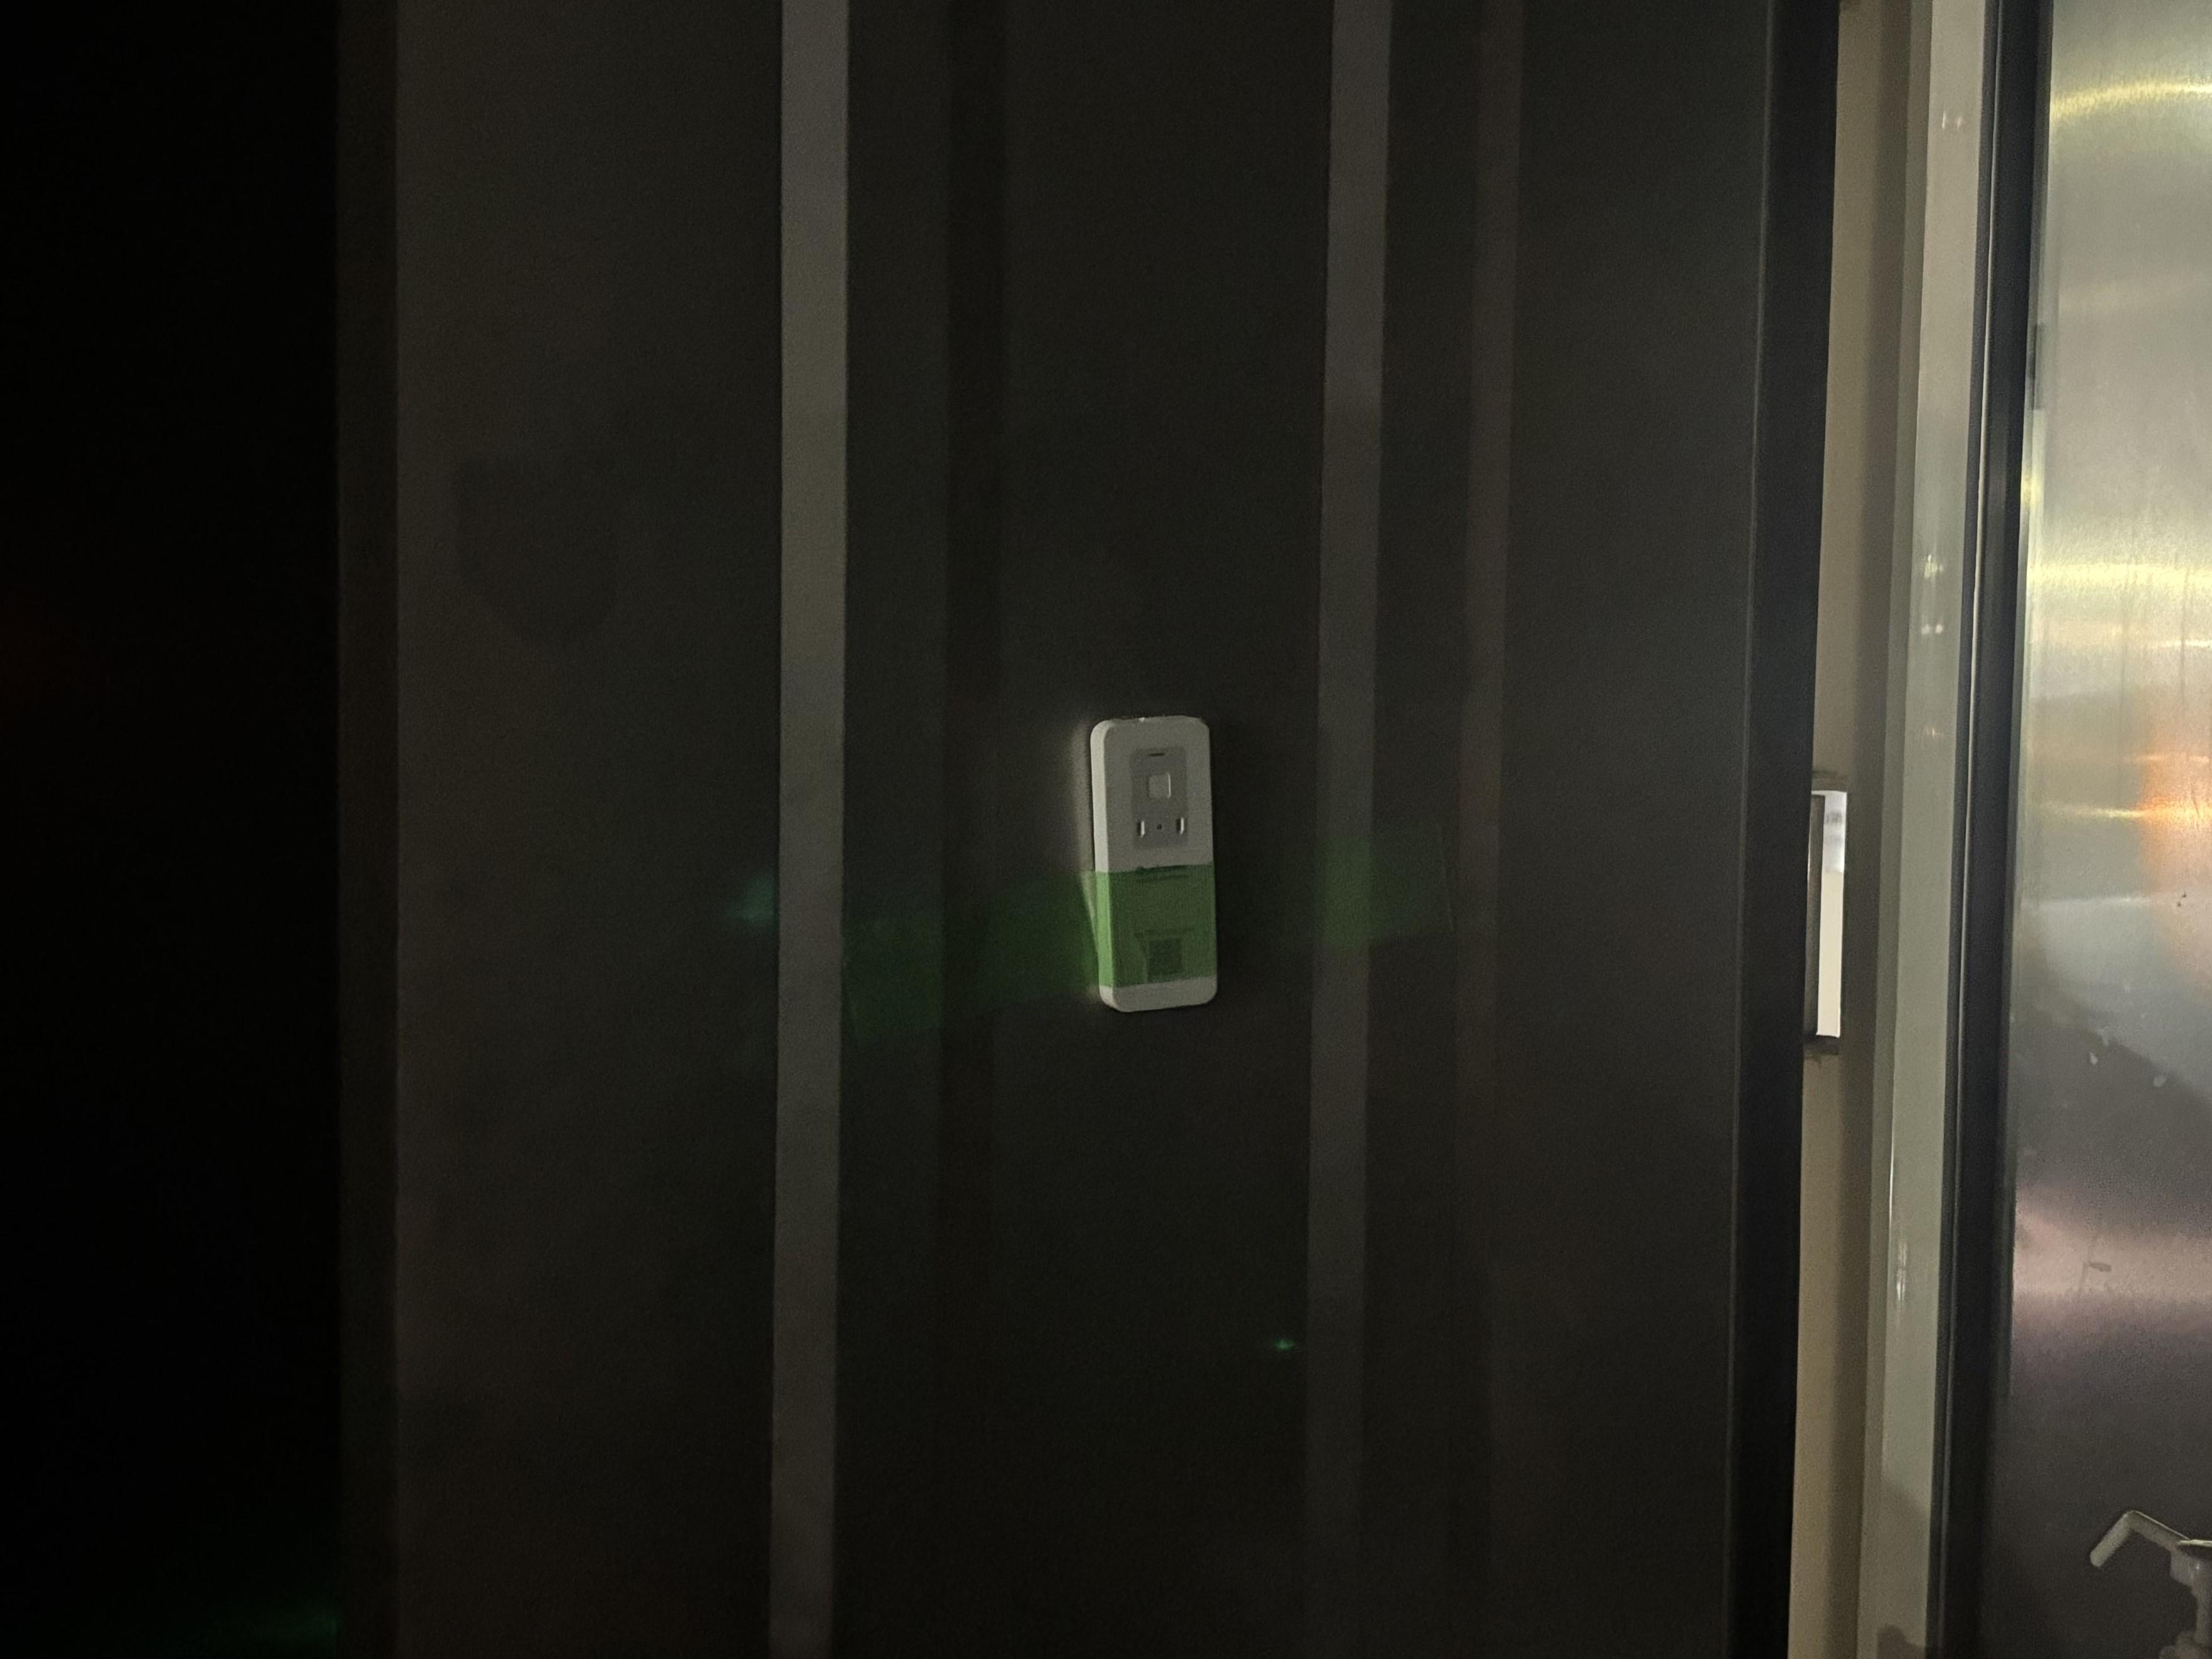
④ |
19:34 |
Close the container door. |
0.1 lx |
|
⑤ |
19:36 |
Open the container door (without using a flashlight, motion sensor light is on). |
1044 lx |
|
⑥ |
19:40 |
Device removal |
6.2 lx |
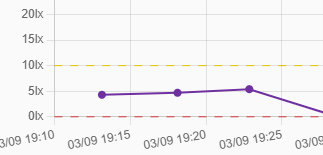
<Results on the dashboard>
Light/dark detection results
Next, we also tested the light/dark detection function under the same conditions.
<Results time series>
|
order |
time |
detail |
Light and darkness |
|
① |
19:38 |
Open the container door and shine a flashlight inside. |
Dark → Light |
|
② |
19:43 |
Device removal |
Light → Dark |
<Results on the dashboard>
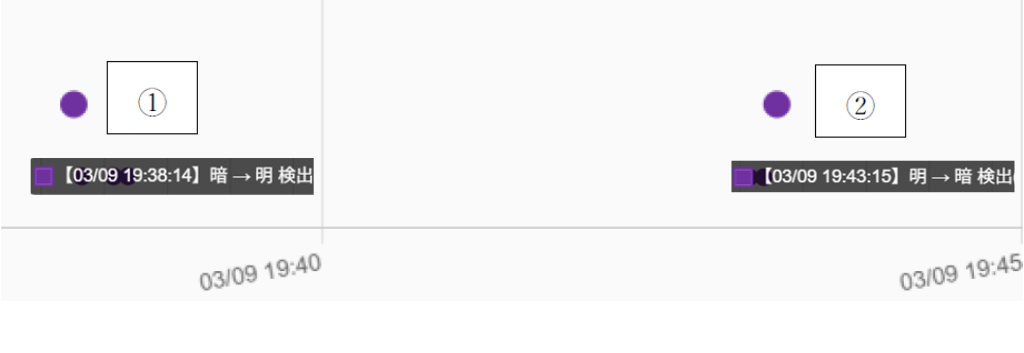
From the above, we were able to visualize, as reliable data, when the container was opened and when it was moved out of the dark. These events, which we had previously relied on intuition for, are now clearly defined.
In the event of any trouble, it enables a swift, evidence-based investigation of the cause and a highly reliable situation report.
The strength of Macnica Tracks® lies in its ability to display multiple independent data sets on a single dashboard.
Even subtle changes that might be overlooked by a single data point can be understood as a complete story of "what happened" by combining data.
For example, Macnica Tracks® allows you to view data in various combinations, as shown below.
Illuminance/Brightness x Impact: If the surroundings become bright immediately after the impact occurs, it indicates the possibility that the outer casing was damaged by the fall or collision, allowing light to enter the interior (exposure to light occurred).
Illuminance/Brightness × Temperature/Humidity: When brightness changes simultaneously with a sudden change in temperature, it accurately confirms the moment of environmental change, such as opening a container door or moving items from a cold storage facility to the outdoors.
lastly
Through this demonstration, we learned that illuminance and brightness detection are not merely auxiliary functions, but rather data that serves as a basis for decision-making.
With Macnica Tracks®, you can acquire and utilize all the necessary data in one place without imposing any special operational burden.
This demonstration experiment proved that illuminance and brightness detection are not merely supplementary logs, but extremely important "decision-making factors" for identifying the root causes of transportation quality issues.
In transportation processes that have often been a black Box, Macnica Tracks® integrates and visualizes necessary data without increasing the operational burden on field staff.
Implementing fact-based data management will not only increase transparency in logistics but also form the foundation of business reliability.
By increasing transparency in logistics and enabling evidence-based quality control, Macnica Tracks® hopes to contribute to the advancement of transportation digital transformation.
Related article


Inquiry
If you have any questions about the QTS110 or would like us to try out some experiments, please contact us using the form below.