- Semiconductor BusinessHOME
- Products and Services of Macnica,Inc.
-
technical information

-
Events and Seminars
- Handling Manufacturer
- Support
- Inquiry
- Click here to purchase products
- Semiconductor business e-mail magazine registration
![]()
![]() Narrow down by specifying conditions
Narrow down by specifying conditions
現在2189件がヒットしています。check

Introduction
Power MOS devices, including power MOSFETs, JFETs, and IGBTs of various construction materials and gate structures, are three-terminal devices in which the current flow is controlled by the gate. In most power electronics applications, the gate is driven so that the device is either fully off, blocking current flow, or fully on with minimal conduction losses. Since the transition between the on and off states generates high heat, the transition times are kept as short as possible to minimize switching power losses. This is the technique of hard-switched Switched Mode Power Supply (SMPS) design.
There are many applications where the switching transitions are necessarily proportional to the on/off states of the switch or the operating point is deliberately set within the transition region. This article will discuss the operation of both power MOS and on-semiconductor JFETs in these applications.
Defining Operating Regions
The output characteristic of a power MOS or JFET has three regions: cutoff, active, and ohmic, as shown in Figure 1 for an on-semiconductor JFET. In cutoff, very little current flows and the device is considered to be off. When the gate-source voltage is high enough, the device enters the ohmic region, the drain-source voltage V DS becomes small, and the current flow is determined mainly by the on-resistance.

Figure 1: Output characteristics of a 1200V Qorvo JFET at 125°C
The boundaries of the ohmic region are defined by:
Between the ohmic and cutoff regions lies the active region, designated as such to avoid confusion between the different meanings of the linear and saturation regions in power MOS, JFET, and bipolar transistors. Thus, operation within the active region is often referred to as the linear mode in most literature, but in this article it is referred to as the active mode. The drain current in the active mode depends primarily on the gate-source voltage, but the dependence on the drain-source voltage is also clearly shown in Figure 1, especially for low VDS .
The simultaneous currents and voltages that active mode devices support generate high power that must be dissipated as heat. Therefore, to function economically in active mode, the Forward Safe Operating Area (FSOA) must be maximized, and understanding the device limitations is essential to ensure reliable operation.
Root Cause of Power MOS Failure in Active Mode
Applications operating in active mode suffer the most from failures, even though they are operating well within the FSOA of the power MOS datasheet. The cause of failure is thermal instability, where current crowding creates hot spots.
![Figure 2: The hot spot phenomenon is clearly visible. *Temperature distribution (℃) of a 5x5 mm power MOS in [1]](/business/semiconductor/articles/146133_Qorvo_pic2.png)
Figure 2: Temperature distribution (°C) of a 5x5 mm power MOS from [1] clearly showing the hot spot phenomenon
The inevitable temperature gradient across a power device chip can lead to hot spots as current flows positively with increasing temperature. Hotter areas on the chip will concentrate more current, which will cause further heating and potentially thermal runaway failure in localized areas. In [1] the effects of thermal instability were shown graphically by measuring the temperature across a power MOS in active mode. The results are roughly reproduced in Figure 2, which clearly shows hot spots with large differences between the minimum, maximum and average temperatures. The current concentrations and temperatures in the hot spots can be very high, resulting in burnout spots and device failure.
In switch-mode applications, current crowding is usually not an issue: the active region is passed very quickly, and current in the ohmic region of operation is limited by the channel and bulk resistances, which have a corresponding high positive temperature dependence. However, active-mode operation does result in high power dissipation over a thermally critical time. Thermal instability therefore limits the true safe operating area of active-mode power devices. Fortunately, many power MOS manufacturers have recognized this and now publish FSOA curves that reduce from the constant power dissipation line on the high-voltage side of the FSOA. In this article we take this a step further and build on the work of [1-3] to estimate the actual onset of thermal instability based on published datasheet information.
Analysis of Thermal Instability in Power MOS in Active Mode
Thermal instability occurs when the power increases beyond the amount that can be thermally dissipated [4]. If electrical power and thermal power are denoted as P G and P θ, respectively, thermal stability can be expressed mathematically as follows:
Since ∂T=∂P θ ∙ Z θ and ∂P G =∂I D ∙ v DS, where Z θ is the thermal impedance (time-dependent thermal resistance), the thermal stability condition can be expressed as:
The power MOS drain current in the active area can be approximated as:
In equation (4), K MOS =μ n ∙ C ox ∙ W / (2 ∙ L), where μ n is the majority carrier mobility in the inversion layer, C ox is the gate oxide capacitance per unit area, W is the gate width, and L is the channel length. The capacitance C ox depends on the dielectric constant of the gate insulator and its thickness; it is therefore constant, as are the gate width W and channel length L. The electron mobility μ n, and hence the magnitude of K MOS, decreases with increasing temperature and drain current i D.
At sufficient drain current, the current limiting effect due to the reduction in electron mobility outweighs the increase in current due to the temperature-dependent threshold voltage. Therefore, we can roughly predict the thermally stable operating conditions of a power MOS based on the stability criterion that the drain current should not increase with temperature. As a first approximation [1, 2], we differentiate equation (4) with respect to temperature. The result is the drain current temperature coefficient (DCTC), expressed as T (I D) as a function of the drain current. If DCTC is less than or equal to zero, the power MOS is always thermally stable.
For power MOS, ∂K MOS /∂T is always negative, so the thermal instability is directly caused by the -2 √(K MOS ∙ I D) ∂V GS(th) /∂T term, specifically the threshold voltage temperature coefficient (TVTC), ∂V GS(th) /∂T. Therefore, as long as TVTC is greater than or equal to 0, the device is always thermally stable in active mode.
The stability factor γ is introduced by substituting α T (I D) into equation (3) and rearranging (called the instability factor S in [1-3]).
Rewriting equation (6) gives us a useful stability criterion:
The challenge now is to determine the DCTC curve αT (ID), which can be calculated from the device design parameters but is usually not published, or it can be measured. Fortunately, the transfer characteristics (derived from the output characteristic data) are published in most datasheets and include the required DCTC data.

Figure 3: Power MOS (a) Transfer characteristic (b) αT vs. iD derived from the transfer characteristic
The transfer characteristic information can be transposed into a graph of αT versus current, with each data point at a particular gate-source voltage, as shown in Figure 3(b), by subtracting the current at 25°C from the current at 125°C and dividing by 125 – 25 = 100. Such graphs are very useful for estimating the onset of thermal instability or for comparing the inherent stability of different power devices.
Consider the steady-state (non-pulsed) case. Z θ is simply R θJC and the published value of the junction-case thermal resistance from the datasheet is used. Using the datasheet R θJC value will result in some variation due to margin differences between power MOS manufacturers and using the maximum value from the datasheet will naturally be a worst-case analysis. However, it gives a reasonable approximation that provides important insight into the thermal stability of the power MOS based on published datasheet information. Equation (7) is evaluated for different values of v DS as follows: Line “a” in Figure 3(b) shows the value of 1/(v DS ∙ R θJC) which is always greater than the α T (i D) curve and therefore the power MOS is always thermally stable at this low drain-source voltage, even when operating below the current crossover point in Figure 3(a).
Line "b" intersects the peak of the α T (i D) curve, indicating the drain-source voltage where hot spots begin to form. Line "c" intersects the α T (i D) curve in two places, indicating the thermal instability range. Below I 1, power dissipation is low enough that current crowding is not significant. When the current exceeds I 2, hot spots form, and I 3 is the peak current reached later by the hot spot, but the device may fail first.
Extending the analysis to FSOA, the onset of thermal instability can be plotted by calculating the maximum power dissipation based on the thermal impedance and junction and case temperatures at various drain-source voltages. Then, at the same drain-source voltage points, calculate the 1/(v DS ∙ R θ) value. Finally, the drain current (power dissipation) is reduced as necessary to ensure that each adjusted 1/(v DS ∙ R θ) value is equal to or greater than the α T (i D) curve. Each point of reduced current roughly indicates the onset of thermal instability.
The current values along the horizontal axis of the α T (i D) graph are important for FSOA analysis. The curve in Figure 3(b) was constructed from data points corresponding to where the two temperature curves (in this case 25°C and 125°C) have the same gate-source voltage. The current values along the horizontal axis of the α T (i D) graph can be interpolated as the average current from the 25°C and 125°C data sets in Figure 3(a).
An example of an FSOA analysis for an 800V, 0.75Ω conventional MOSFET is shown in Figure 4. For voltages clearly above about 50V, the predicted onset of thermal instability is well below the datasheet FSOA boundary. In this example, the case temperature is kept at 25°C, which is also unrealistic. Nevertheless, important information can be gleaned from it, as it shows a rough relationship between maximum safe power dissipation and voltage, regardless of case temperature.

Figure 4: DC FSOA vs. estimated thermal stability boundaries for an 800V silicon MOSFET at T J = T Jmax, T C = 25°C
It is easy to plot a FSOA graph at different case and junction temperatures. The current on the low voltage side is limited by R DS(on) and not by power dissipation. The peak current is the maximum power dissipation, calculated as I peak = √(P D,max / R DS(on), where P D,max = (T J– T C) / R θJC. Beyond the peak, the current is simply P D,max / V DS. However, as the voltage increases, the current must be reduced to prevent the α T,max (I D) = 1/(v DS ∙ R θJC) curve from crossing under the α T (i D) curve as explained above. If we analyze in terms of pulse power, we simply replace R θJC with Z θJC in the single pulse transient thermal impedance graph at the corresponding pulse duration. Reducing the thermal impedance will shift the α T,max (i D) curve upwards along with the thermal stability curve in the FSOA graph, reducing or completely eliminating the thermally unstable operating region. For this reason, some MOSFET manufacturers do not publish DC FSOA curves, only pulsed FSOA curves.
Lowering the peak DCTC, or equivalently, lowering the magnitude of the negative TVTC, increases the operating range of thermal stability. Also, recall from equation (5) that the device is unconditionally stable for all negative values of α T (i D). Specialized linear MOSFETs have lowered peak DCTC and improved FSOA. However, power MOSs cannot reduce TVTC to zero, and therefore still exhibit thermal instability over certain ranges of operating voltages, currents, and temperatures. JFETs can have a TVTC that is zero.
Thermal stability of ON Semiconductor JFET and improved FSOA
The drain current of a JFET can be roughly approximated as I D = I DSS ∙ (1 – v GS / V GS(th))^2, which can be written in the same form as the power MOS equation (4).
The drain current of some JFETs depends strongly on the drain-source voltage in the active mode. However, equation (8) can be written as: K JFET but v DS Even though it increases with , Eq. (4) K MOS Considering that DCTC always decreases with temperature as well as TVTC, it is enough to indicate thermal stability. Therefore, if the TVTC is zero, the JFET is always thermally stable, which is the same criteria as for MOSFETs. ON Semiconductor manufactures SiC JFETs with two different gate structures: one with zero TVTC and one with low TVTC. Both types are very suitable for active mode operation. The difference in DCTC between ON Semiconductor JFETs and various power MOS devices is shown graphically in Figure 5.

Figure 5: α T (i D) vs. drain current for various devices
The peak DCTC is an indication of the inherent thermal stability of a device and is useful for rough but imperfect comparisons between device types. In Figure 5, we can see that the ON Semiconductor 1200 V SiC JFET UJN1205K is always thermally stable because its DCTC is always negative. Next is the ON Semiconductor UJ3N120035K3S, also a 1200 V SiC JFET. Its TVTC is slightly negative, so its DCTC peak is positive. According to Figure 5, the 800 V conventional MOSFET has a peak DCTC comparable to the specialized 1200 V linear MOSFET, each of which has a FSOA that ends at 800 V. However, the FSOA of these devices is quite different, as we will show later. Finally, the 1200 V SiC MOSFET, which has a similar R DS(on) to the ON Semiconductor JFET, has a relatively high DCTC.
Taking a slightly different approach than the usual fixed junction and case temperatures, we adjusted the maximum power dissipation to match the maximum power dissipation at the thermal stability boundary to produce Figure 6. That is, when operating within each of the FSOA curves in Figure 6, each device is always thermally stable and the maximum power dissipation remains constant.

Figure 6: FSOA of various devices within the thermal stability boundary
As expected, the SiC MOSFET has the lowest FSOA at high voltage, comparable to a conventional 800V MOSFET. However, unlike silicon-based MOSFETs, the SiC MOSFET and SiC UJ3N120035K3S JFET have a significant R DS(on) advantage, which correspondingly reduces the on-voltage significantly at higher peak currents. Both the linear MOSFET and the SiC JFET have a wide thermal stability boundary due to their combination of low peak DCTC and thermal resistance. Only the UJ3N120035K3S JFET has a large usable FSOA at drain-source voltages above 800V, which is advantageous for high voltage active mode applications. The UJN1205K has been omitted from Figure 6 because it has zero TVTC and is therefore always thermally stable regardless of power dissipation. Instead, we compare the UJN1205K to the UJ3N120035K3S in Figure 7 below.
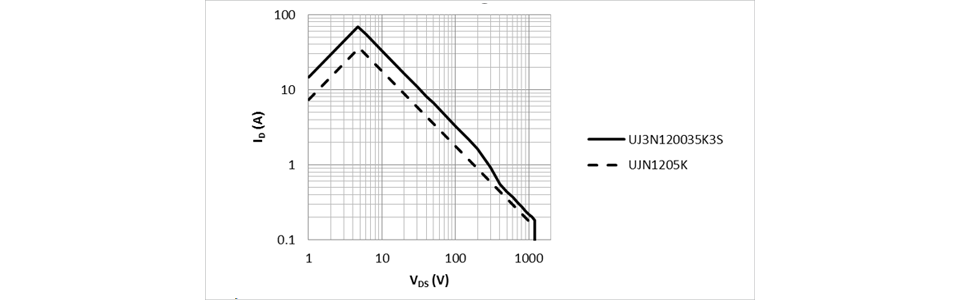
The die sizes and R DS(on) of these JFETs are very similar, but the UJ3N120035K3S has a lower R θJC due to an improved manufacturing process. In this case, the lower thermal resistance of the UJ3N120035K3S outweighs the reduced thermal stability limit, limiting the power dissipation to 220W above 400V.
As shown above, power devices that are prone to thermal instability under certain conditions can be reliably operated in active mode by keeping the FSOA low. SiC devices, unlike silicon-based devices, can be said to be able to operate safely with reduced or no margin from the maximum rated junction temperature. In any case, operating at a lower FSOA ensures that the average chip temperature is low enough that no significant hot spots form and that peak chip temperatures do not cause failure. This is typically determined experimentally by destroying multiple devices under various operating conditions and applying a statistically significant margin of safety. With DCTC analysis, such destructive testing is either less or not required and the actual FSOA can be better understood based on the physics of operation.
ON Semiconductor JFETs do not have internal body diodes, as they are actually designed for fast switching and use in MOSFET-SiC JFET cascodes. ON Semiconductor JFETs are attractive in switched mode power supply (SMPS) applications due to their efficient design and streamlined manufacturing process, and also outperform other device types in high voltage active mode applications.
Parallelization
In both SMPS and active mode applications, paralleling is often required due to heat dissipation requirements, both of which are discussed below in relation to the active area characteristics.
SMPS
Consider multiple parallel devices. Their threshold voltages vary. The device with the lowest threshold voltage will be the first to turn on and the last to turn off. So, switching losses and heat generation will be disproportionately high. When the overall power losses are high, i.e. operating at heavy load, the negative TVTC of the hottest device will further increase the dynamic current imbalance and may become self-reinforcing. This can be a reliability issue in situations where switching losses dominate conduction losses, even if the conduction losses have a positive temperature coefficient, as in MOSFETs and NPT IGBTs for example. This is one of the reasons why sufficient current margins must be applied when paralleling power MOS devices.
In ON Semiconductor JFETs, like power MOS, there is variation in threshold voltage between devices. However, due to the reduced TVTC, dynamic current sharing is improved. This does not mean that switching losses are perfectly uniform between devices, but it does mean that the hottest device is less likely to carry increasing currents during switching. This is an area ON Semiconductor This is also true for cascodes, because the JFETs in cascodes handle high voltages during switching. The cascode MOSFETs turn on or off before the JFETs complete the switching process. With regard to conduction losses, the positive temperature coefficient of on-resistance ensures thermal balance where static current imbalances do not cause a single device to go into thermal runaway. As a result, ON Semiconductor JFETs and cascodes are very thermally stable in both static conduction and switching, making them reliable when connected in parallel.
Active Mode
As with power MOS, part-to-part variations in threshold voltage and temperature dependent gain are a challenge for steady-state active mode operation of parallel on-semiconductor JFETs. A common way to solve this challenge is to use individual feedback control of each JFET using an op-amp and current sense resistor, as shown in the simplified circuit diagram in Figure 8 [5].

Figure 8: Simplified example of parallel connection of ON Semiconductor JFETs for steady-state active mode operation
Each opamp with a negative threshold voltage naturally requires a negative supply to drive the gate of the on-semi JFET.
demonstration
The prototype electronic load board consists of six independent channels, each with an ON Semiconductor UJ3N120035K3S as the JFET. The top view in Figure 9(a) shows the circuit for the six channels. Each opamp receives a command signal from the digital control card, and the cooling blower consumes only about 14W. In Figure 9(b), the JFET is seen "sandwiched" between the circuit board and the heat sink, and there is no electrical insulation between the rear drain pad of the JFET and the heat sink. Each UJ3N120035K3S is always thermally stable for any combination of current and voltage (up to BVDS) and consumes 220W of power.

Figure 9: Prototype electronic load test board. (a) Top view, (b) side view showing the JFET between the heat sink and the PCB.
In preliminary tests, by adjusting the command current as the voltage increased from 20V to 1000V, a steady 75W load was applied to each JFET, with a peak heatsink temperature of 97°C. With improved air cooling, each JFET could handle well over 100W of power, and even more with liquid cooling. At the time of writing, testing is still in progress, but the demonstration of constant load power being maintained with increasing heatsink temperature over a wide voltage range validates the theory of thermal stability of OnSemi JFETs with low TVTC.
References
[1] P. Spirito, G. Breglio, V. d’Alessandro, N. Rinaldi; “Thermal Instabilities in High Current Power MOS Devices: Experimental Evidence,
Electro-thermal Simulations and Analytical Modeling”, Proc. 23rd international conference on microelectronics (MIEL 2002), May 2002
[2] P. Spirito, G. Breglio, V. d’Alessandro, N. Rinaldi, “Analytical Model for Thermal Instability of Low Voltage Power MOS and SOA in Pulse Operation”,
Power Semiconductor Devices and ICs Proceedings, May 2002
[3] P. Spirito, G. Breglio, V. d’Alessandro, N. Rinaldi, “Modeling the Onset of Thermal Instability in Low Voltage Power MOS: An Experimental Validation”,
Proceedings of the 17th International Symposium on Power Semiconductors and ICs, May 2005
[4] P. Hover, P. Govil; “Comparison of one- and two-dimensional models of transistor thermal instability”, IEEE Transactions on Electron Devices ,
Volume 21, Issue: 10, Oct 1974
[5] R. Frey, D. Grafham, T. Mackewicz; “New 500 V Linear MOSFETs for a 120 kW Active Load”, PCIM Europe, June 2000
Inquiry
If you have any questions regarding this article, please contact us below.
On Semiconductor Manufacturer Information Top Page
If you would like to return to the ON Semiconductor manufacturer information top page, please click below.