- Semiconductor BusinessHOME
- Products and Services of Macnica,Inc.
-
technical information

-
Events and Seminars
- Handling Manufacturer
- Support
- Inquiry
- Click here to purchase products
- Semiconductor business e-mail magazine registration
![]()
![]() Narrow down by specifying conditions
Narrow down by specifying conditions
現在2184件がヒットしています。check

This is an updated version of the old title "DS-5 Utilization Techniques - How to use the trace function".
Arm® Development Studio for Intel® SoC FPGA Edition (Arm® DS ) has been changed to Arm® DS is the successor to DS-5, and usability does not change significantly. Most of the content in this series of articles can be applied to both Arm® DS / DS-5, but where there are differences, we have updated them to that effect.
***
This article provides supplementary information on how to use Arm® DS / DS-5, which can be used as a software integrated development environment for Intel® SoC FPGAs.
In this article, I will show you how to use Arm® DS/DS-5 to capture instruction traces of software running on an Intel® SoC FPGA device. By tracing the instruction execution history of the CPU with the trace function, it is possible to go back in time and check the detailed operation of the software up to the occurrence of an event such as a defect.
In the method introduced in this article, an on-chip trace memory (32KB in size) called Embedded Trace FIFO (ETF) is used as the trace data storage destination. It can be used only in a target environment capable of JTAG debugging without preparing additional equipment or hardware. See the Arm® DS / DS-5 manual for more information about the trace function, including optional settings not covered in this article.
Arm® Development Studio documentation page (Arm® Developer site)
DS-5 Documentation Page (Arm® Developer Site)
Enable trace function (DTSL configuration)
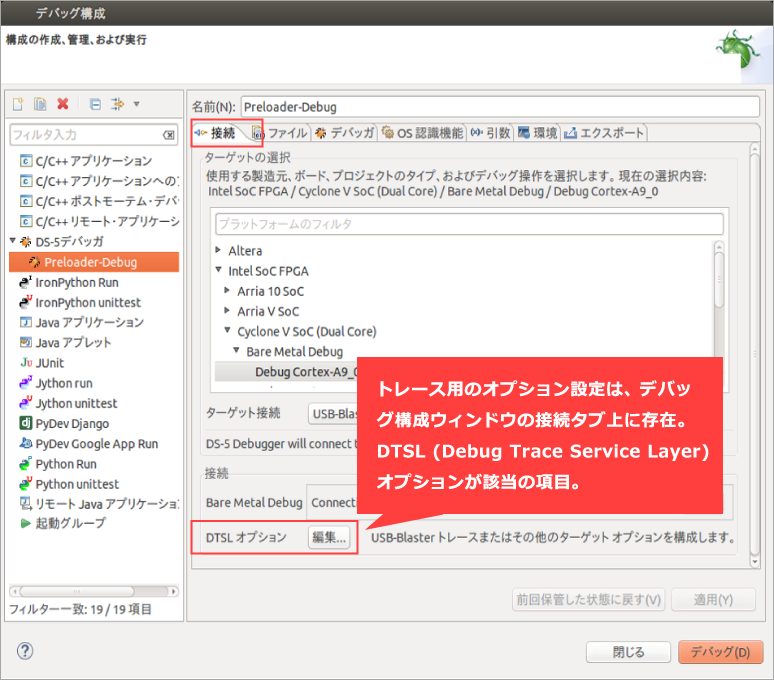
The option settings for using the Arm® DS / DS-5 trace function are set from the DTSL (Debug Trace Service Layer) option on the [Connection] tab of the debug configuration. Simply edit the DTSL options in your existing debug configuration settings to enable the trace functionality.
DTSL configuration boot
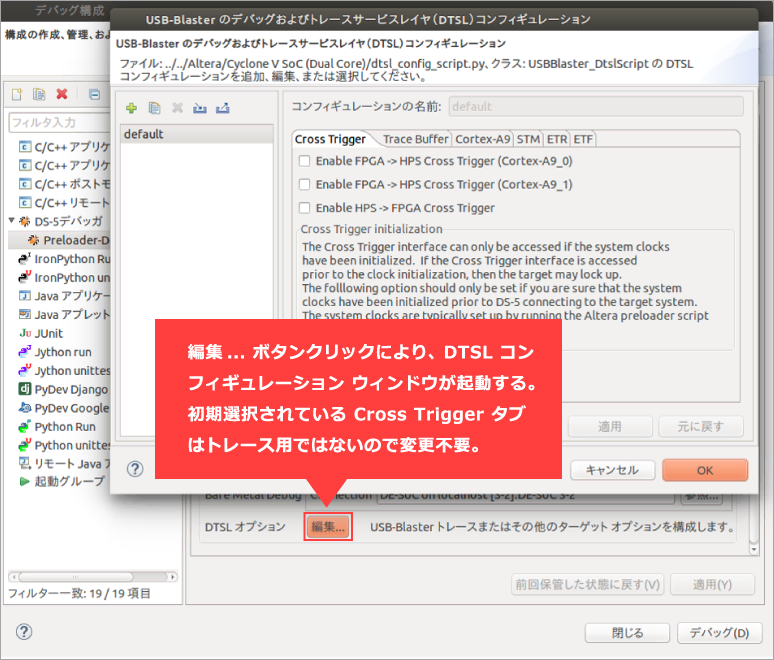
By clicking the [Edit...] button of the DTSL option, the corresponding option setting window (DTSL configuration) will start. The [Cross Trigger] tab, which is initially selected, is for setting options related to debugging functions other than tracing, so it does not need to be edited. Enable tracing by editing the options provided on the Other tabs.
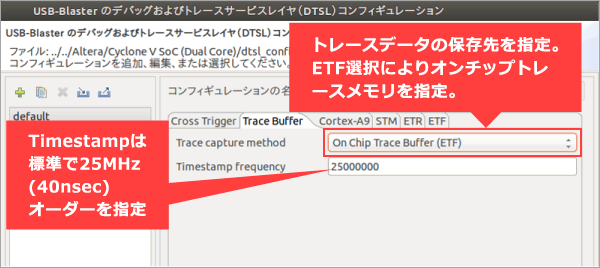
[Trace Buffer] tab
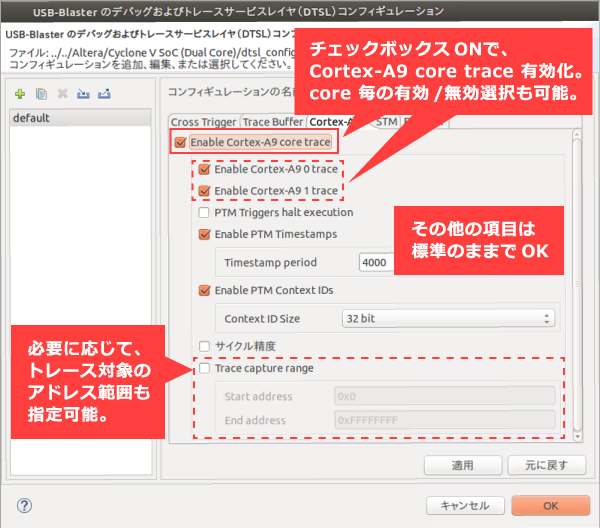
Cortex-A9 tab
[STM] tab / [ETR] tab
These tabs do not need to be edited.
The STM tab allows you to enable/disable the System Trace Macrocell. Enable this if you want to record trace events other than CPU instruction traces. Settings on the [ETR] tab are required only when ETR is selected as the save destination for the trace log. In the case of ETR, the save destination of the trace log is SDRAM, so the address of the trace log save destination is included as an optional item.
ETFs Tab
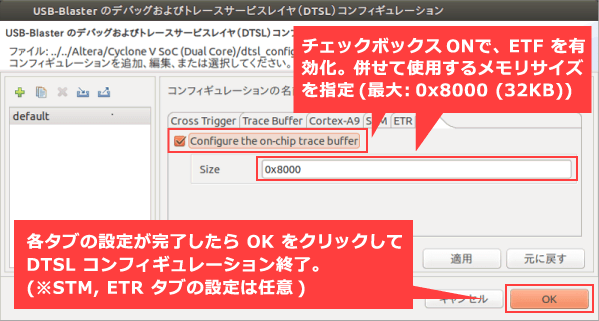
After setting options on all tabs, click the [OK] button to exit DTSL configuration. Now just start debugging.
Add trace view
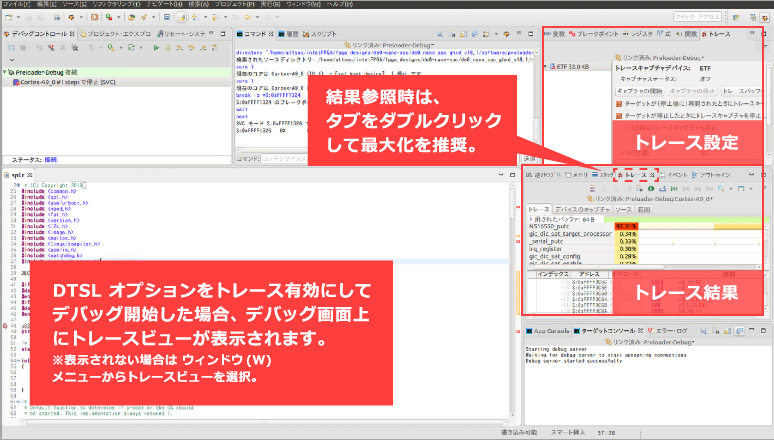
For Arm® DS, the view used by the trace function is not displayed on the standard screen layout. Add a trace view (display window for trace results) from the menu "Window → Show View → Trace" at the top of the Arm® DS screen. Similarly, a trace control view (a window for trace settings) can be added from "Window → Show View → Trace Control".
How to refer to the trace log
After starting debugging, every time the CPU stops operating (breaks), the content displayed in the Trace View is updated with the latest trace log. The Trace View is normally displayed as a sub-window, as in the image below.
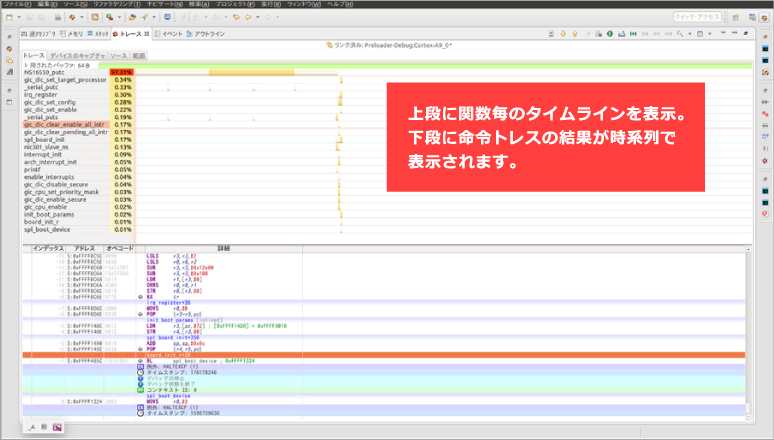
Below is an image of the trace view tab double-clicked and maximized.
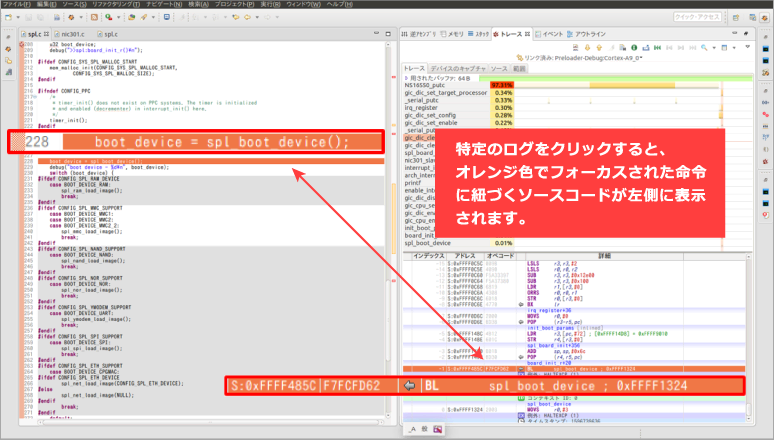
Furthermore, clicking on a specific trace log enables comparison with the source code as shown below.
So far, I have introduced how to use the trace function. It can be used with only a simple setting, so please use it when debugging.
Click here for recommended articles/materials
List of articles on Arm DS utilization
SoC FPGA related articles and resources
Intel® FPGA SoC FPGA
Intel® FPGA Development Flow/FPGA Top Page