- Semiconductor BusinessHOME
- Products and Services of Macnica,Inc.
-
technical information

-
Events and Seminars
- Handling Manufacturer
- Support
- Inquiry
- Click here to purchase products
- Semiconductor business e-mail magazine registration
![]()
![]() Narrow down by specifying conditions
Narrow down by specifying conditions
現在2149件がヒットしています。check

step response
I will describe the signal waveform when passing through the filter mentioned in Part 1.
To find the time response, we use the inverse Fourier transform.
The figures are numbered 1 and 2 consecutively.
One of them is below.
Difference between Bessel filter and other filters Part 1
Figure 10 shows the time response when a step waveform (rise time tr=0) is applied to each filter in Figure 4. (The order of the filter is 7)
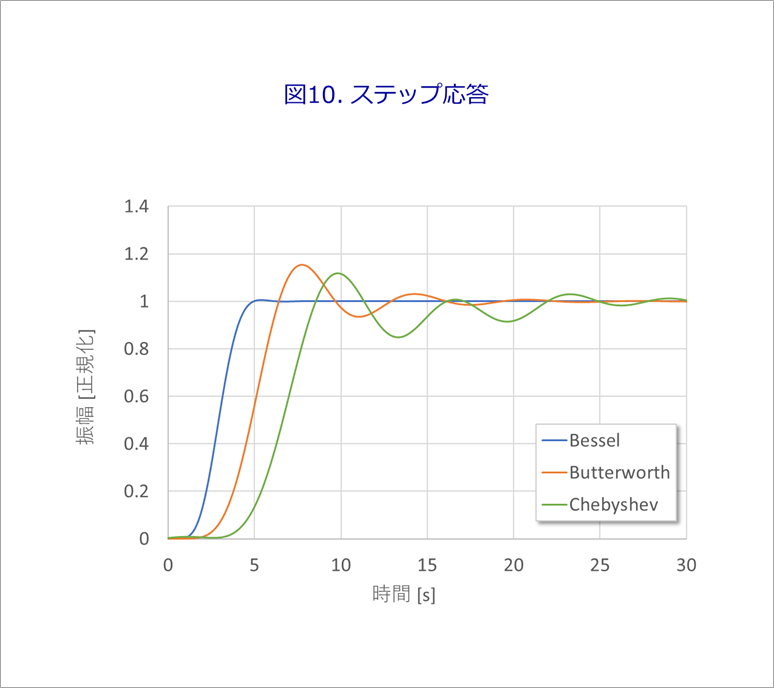
It can be seen that the waveforms of each filter are distorted corresponding to the rampage of group delay in Fig. 9.
When analyzing waveforms of reflections and crosstalk, polygonal line (ramp) waveforms are often used.
The actual waveform is not a polygonal line, but the corners change smoothly.
As shown in Figure 10, passing a stepped waveform through a Bessel LPF produces a smooth, clean waveform.
Non-Bessel filters are not suitable for this application due to overshoot and ringing.
The delay time of each waveform corresponds approximately to the group delay time in Figure 9.
Rise time of pulse waveform
The rise time of pulse waveforms is often defined as 10%-90% or 20%-80% of full amplitude, but for line ramp waveforms it is defined as 0%-100%.
Here, a ramp waveform passing through two points of 20% and 80% of the filtered waveform is estimated, and defined as 0%-100% of the ramp waveform.
Figure 11 zooms in on the rising edge of the Bessel waveform in Figure 10 and infers the ramp waveform through the 20% and 80% points.
In addition, considering the group delay, the ramp waveform is corrected so that it rises from 0 (zero).
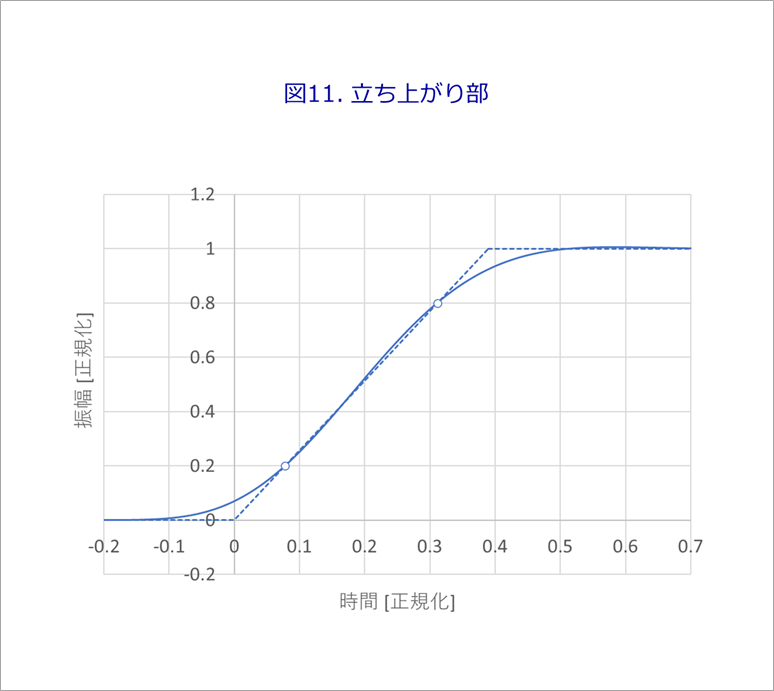
The figure normalizes the cutoff frequency fc to 1. The 0%-100% rise time tr at this time is 0.3894. fc and tr are inversely proportional to each other. That is, fc×tr=0.3894.
For example, for a rise time of 0.5, fc=0.3894/0.5=0.779.
This fc×tr product has values between 0.38 and 0.39 for Bessel's 2nd to 8th orders. [Footnote 5]
Figure 12(a) shows the rising waveforms when the order n in Figure 10 is varied from 2 to 8.
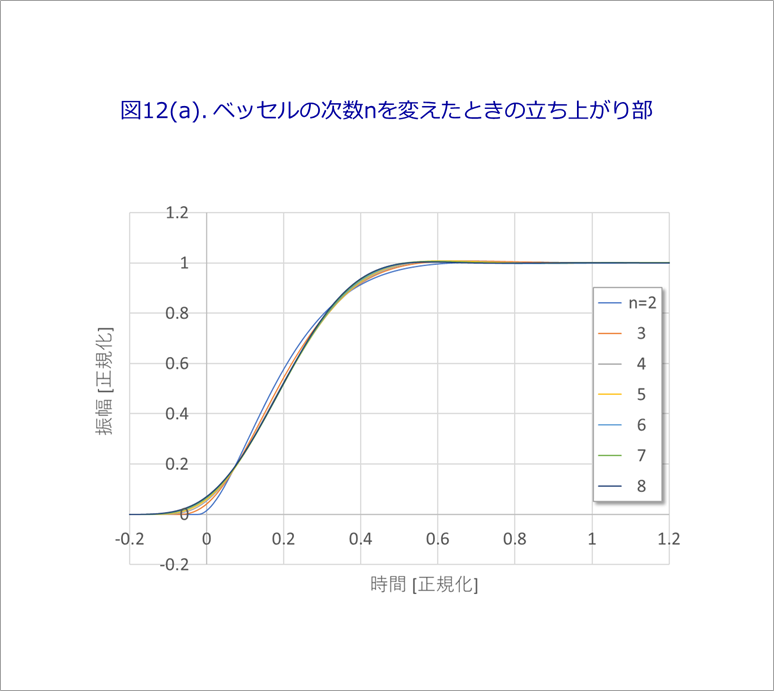
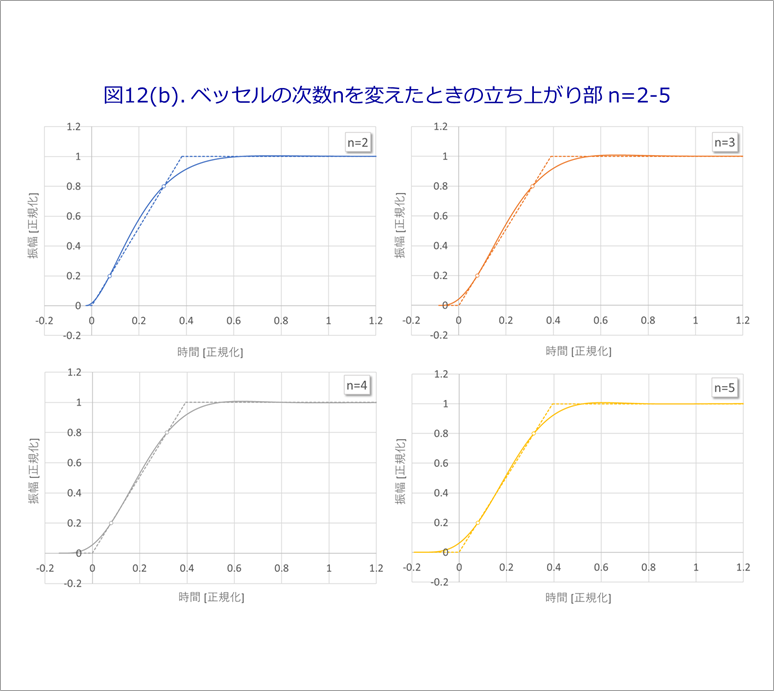
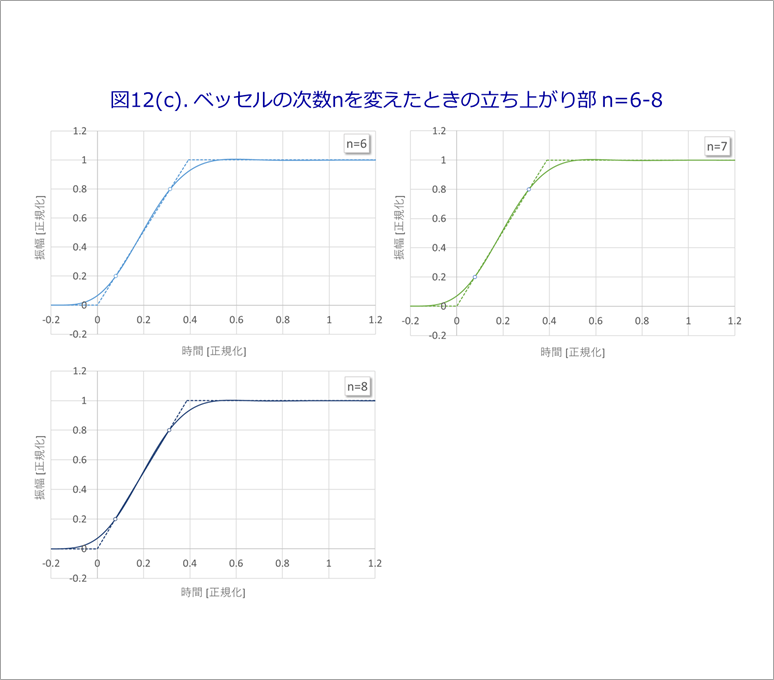
At n=2, the linear portion of the rise is slightly swollen, but at n≧3, the 20%-80% portion can be regarded as almost straight.
Figure 12(b) shows the plots for n = 2-5, and Figure 12(c) shows the plots for n = 6-8.
The above normalizes the frequency to 1. Below is an example of actual time and frequency.
For 0.5ns rise time, fc=0.3894/0.5ns=779MHz.
Figure 13 shows the frequency characteristics at this time.
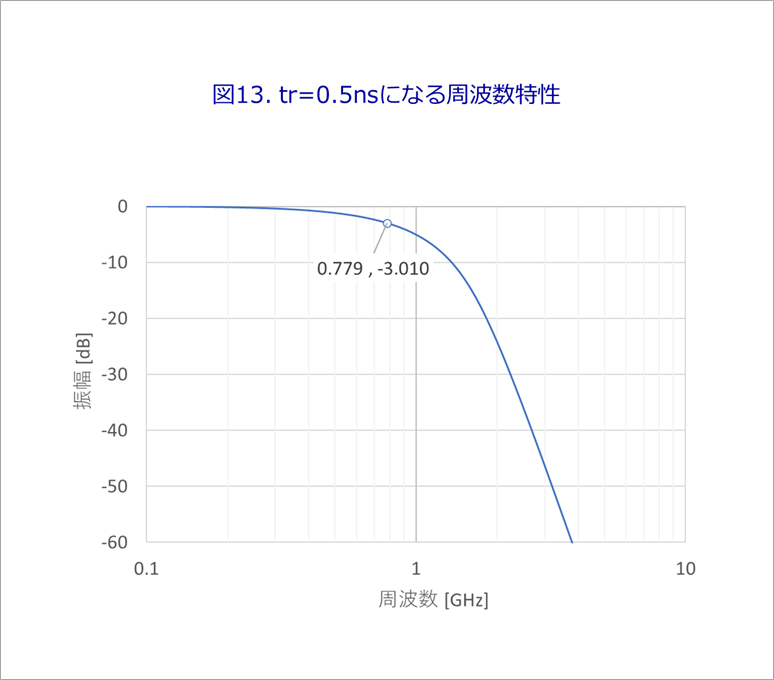
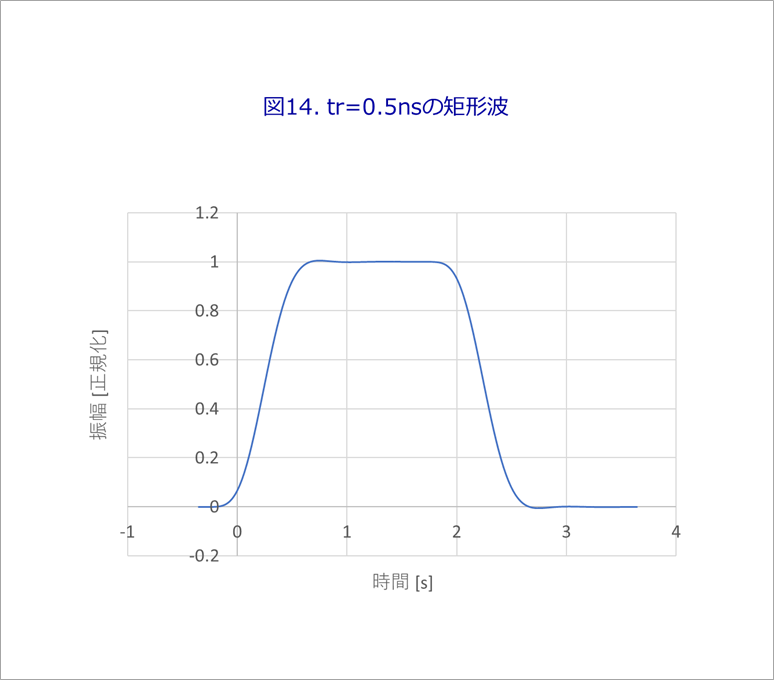
Figure 14 shows the response when a square wave with zero rise time is passed through the characteristic in Figure 13, and Figure 15 is an enlarged view of the rising portion.
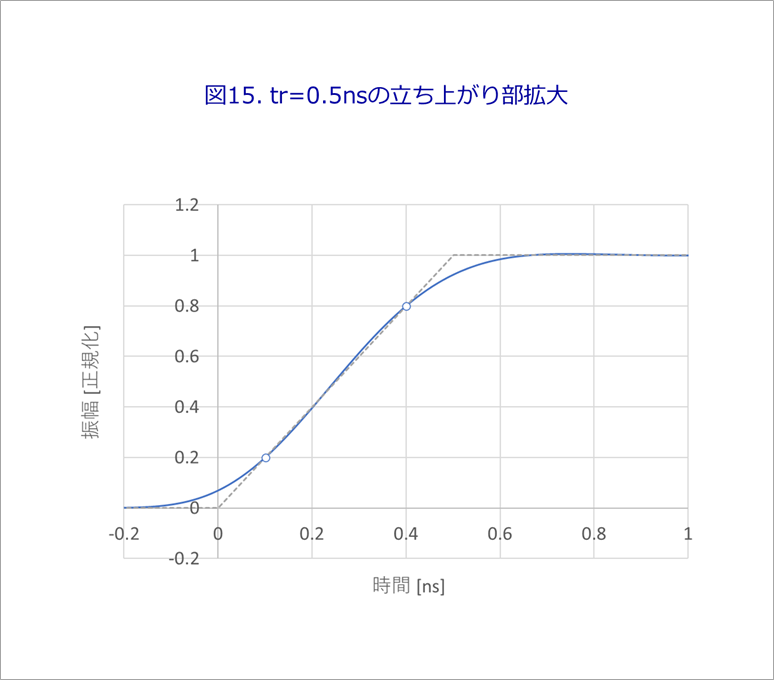
As described above, for the time response of the waveform of the polygonal line, if the signal source is a step waveform with zero rise or a square wave that has been passed through a Bessel filter, it is possible to obtain a time response that is closer to the actual time. increase.
Also, for example, the observed waveform of an oscilloscope with a frequency band of 7 GHz uses a 7th-order Bessel filter as an anti-aliasing filter. It will be time.
When a pulse waveform with a finite rise is observed with a certain bandwidth oscilloscope, the rise time is larger than that of the original waveform.
This observed rise time is empirically said to be the sum of the squares of the rise time of the band and the original rise time.
Figure 16 is the result of verifying this.
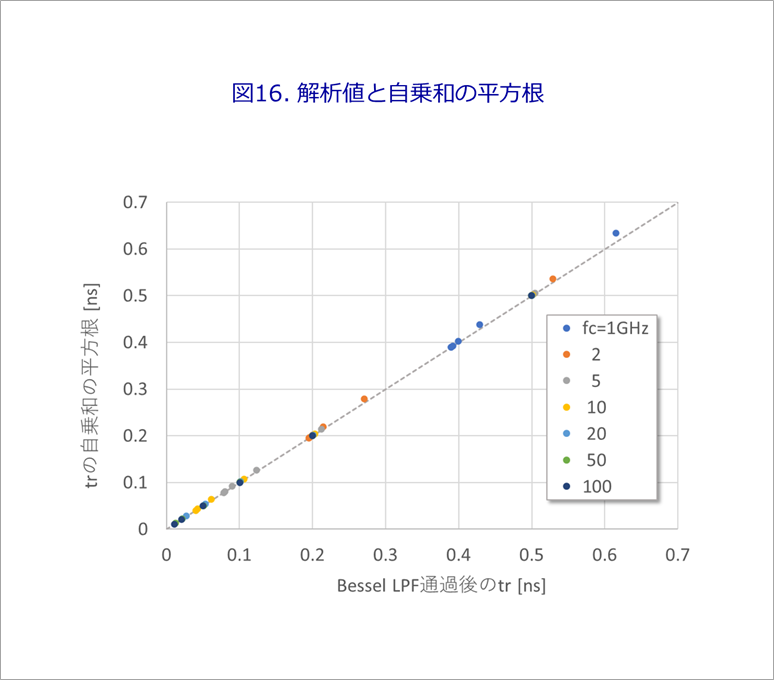
If the rise time of the pulse waveform is tr0, the rise time when this waveform is passed through the Bessel filter is tr, and the rise time determined from the oscilloscope bandwidth is tr1 (=0.3894/band), the horizontal axis is tr and the vertical axis is is the square root of the sum of squares, or √(tr0^2+tr1^2).
It turns out that it almost agrees with the empirical sum of squares.
Here, tr0 = 10ps to 500ps, and the bandwidth of the oscilloscope (fc of Bessel filter) was calculated from 1GHz to 100GHz.
Footnote 5
fc×tr is often said to be 0.35, but this represents the case of 10% to 90% when the step waveform is passed through the first-order delay circuit of CR.
It's easy to find, so please do the math.
This calculation is
Oscilloscope bandwidth and signal rise time
said to
In this article, tr is defined as 0%-100%, so 0.38 to 0.39 is about 0.3 when multiplied by 0.8.
What is Yuzo Usui's Specialist Column?
It is a series of columns that start from the basics, include themes that you can't hear anymore, themes for beginners, and also a slightly advanced level, all will be described in as easy-to-understand terms as possible.
Maybe there are other themes that interest you!