- Semiconductor BusinessHOME
- Products and Services of Macnica,Inc.
-
technical information

-
Events and Seminars
- Handling Manufacturer
- Support
- Inquiry
- Click here to purchase products
- Semiconductor business e-mail magazine registration


 Narrow down by specifying conditions
現在2259件がヒットしています。check
Contents of Episode 2
In the first episode, I introduced the configuration of a hybrid inference environment and the extent to which daily operations can be handled with OpenWaite's LLM, along with the results of my own practical work. Of the 411 requests, 402 (approximately 98%) were completed on-premises, and only 9 were escalated to the Frontier model.
This episode will address the remaining two questions: performance and cost. First, we will quantitatively measure how many agents a single GPU server can support using public benchmarks. Then, we will estimate, based on actual operational data, how many users would need to use an environment with an initial investment of 100 million yen to recoup the cost.
Performance Measurement: How many people can one NVIDIA DGX™ B200 support?
As the number of users increases in the future, you might be wondering how many users this server can handle while maintaining its response speed. However, measuring performance with your own tests will yield results that vary greatly depending on the conditions you set. You can artificially improve the numbers by shortening the prompt, repeatedly sending the same message to build up the cache, or allowing the model output to finish quickly. Such measurement results are not useful for readers to make informed decisions.
Using an agent involves a series of long prompts, and the nature of the load differs from that of chat-based benchmarks. Therefore, this time we used the "AgentX MVP" benchmark [1][2] published by SemiAnalysis, which reproduces an actual agent session.
AgentX MVP is a benchmark that plays back 393 actual Claude Code sessions in the order and intervals they were recorded. Rules such as "do not cut off the output midway," "maintain the recorded intervals," and "do not inflate the effect of caching" are fixed by the tool, and the user performing the measurement cannot change the conditions afterward. The results include a judgment (submission_valid) indicating whether the measurement followed the rules.
Measurement method: Measure by playing an actual Claude Code session.
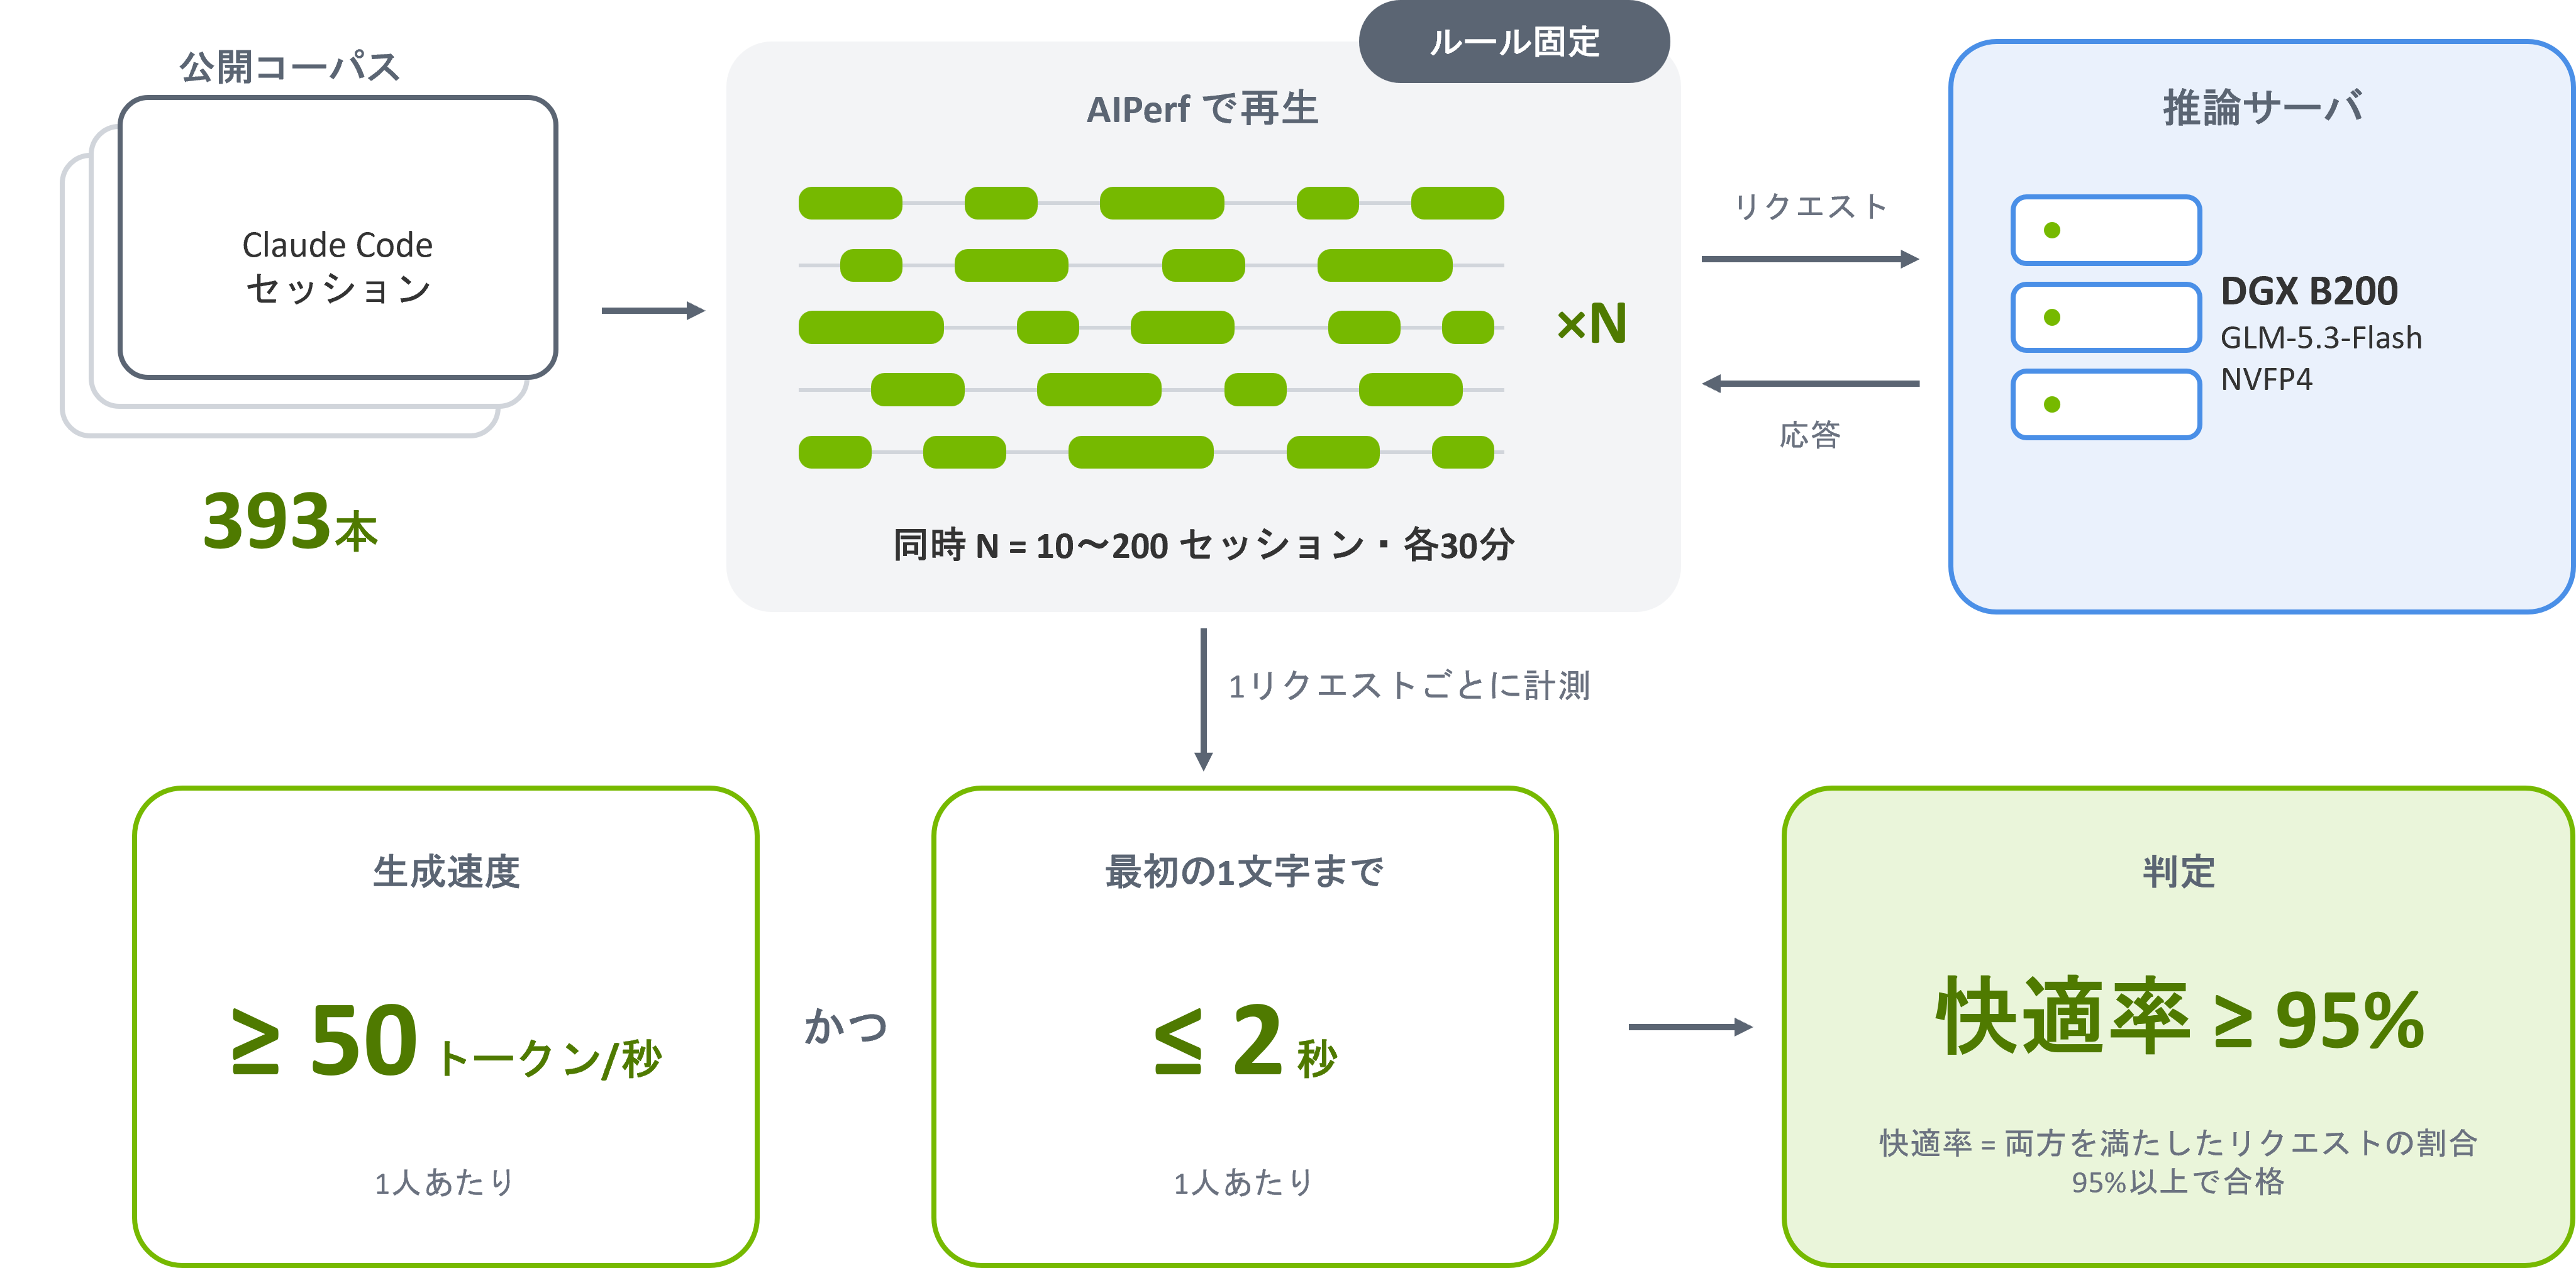
The overall measurement process is shown in the diagram above. N conversations that replay actual sessions are executed simultaneously (N simultaneous sessions), and a new session is assigned each time a conversation finishes, maintaining a state where N conversations are always in progress. For example, 50 simultaneous sessions is equivalent to the load of 50 agents running in parallel at all times.
Between conversations, tools are executed, intervals mimicking human actions are simulated, and requests mimicking subagents are sent. Therefore, the number of requests the inference server is actually processing simultaneously (number of concurrent requests) increases or decreases relative to the number of concurrent sessions. From now on, one conversation will be considered as one user, and N concurrent sessions will be treated as N concurrent users. As soon as one conversation ends, the next conversation begins, and since N people are constantly working, the load is heavier than in actual use.
The evaluation criteria (SLOs) were defined as follows before measurement: AgentX MVP only fixes the execution conditions (such as the session playback order and interval), and "what is considered comfortable" is determined by the person performing the measurement.
🔷 Comfortable = Over 95% of requests meet the criteria of "50 tokens / second or more per person and within 2 seconds for the first character".
The 50 tokens / second benchmark was set based on the output speed of the cloud API introduced in Episode 1 (approximately 55 tokens / second with Opus 4.8). The idea is that if the same speed as when using the cloud can be maintained, the usability will not decrease even when switching to on-premises. The 2-second benchmark will vary depending on the use case, but this time it was set assuming the use of an agent that runs for multiple turns while calling tools, rather than a simple one-question-one-answer process. These metrics should be changed as appropriate to suit the actual use case. Measurements were taken by changing the number of simultaneous sessions to six levels: 10, 30, 50, 100, 150, and 200.
Measurement conditions: Hardware and execution environment
The measurements were performed under the following conditions [3][4]:
Item conditions
|
Item conditions |
Item conditions |
|
hardware |
One NVIDIA DGX™ B200 (running on NVIDIA Run:ai) |
|
model |
nvidia/GLM-5.3-Flash-NVFP4 |
|
Inference engine |
vLLM (prefix cache enabled, KV cache is FP8) |
|
TP |
8 |
|
benchmark |
AgentX MVP (inferencex-agentx-mvp scenario in AIPerf 0.13.0) |
|
Corpus |
semianalysis_cc_traces_weka_062126 (393 sessions by Claude Code) |
|
Number of simultaneous sessions |
Six levels: 10 / 30 / 50 / 100 / 150 / 200 pieces |
|
Measurement time |
30 minutes each (1,800 seconds) |
|
Random seed |
42 |
|
Measurement date |
September 17, 2026 |
Measurement results: Meets the standard for up to 50 people simultaneously.
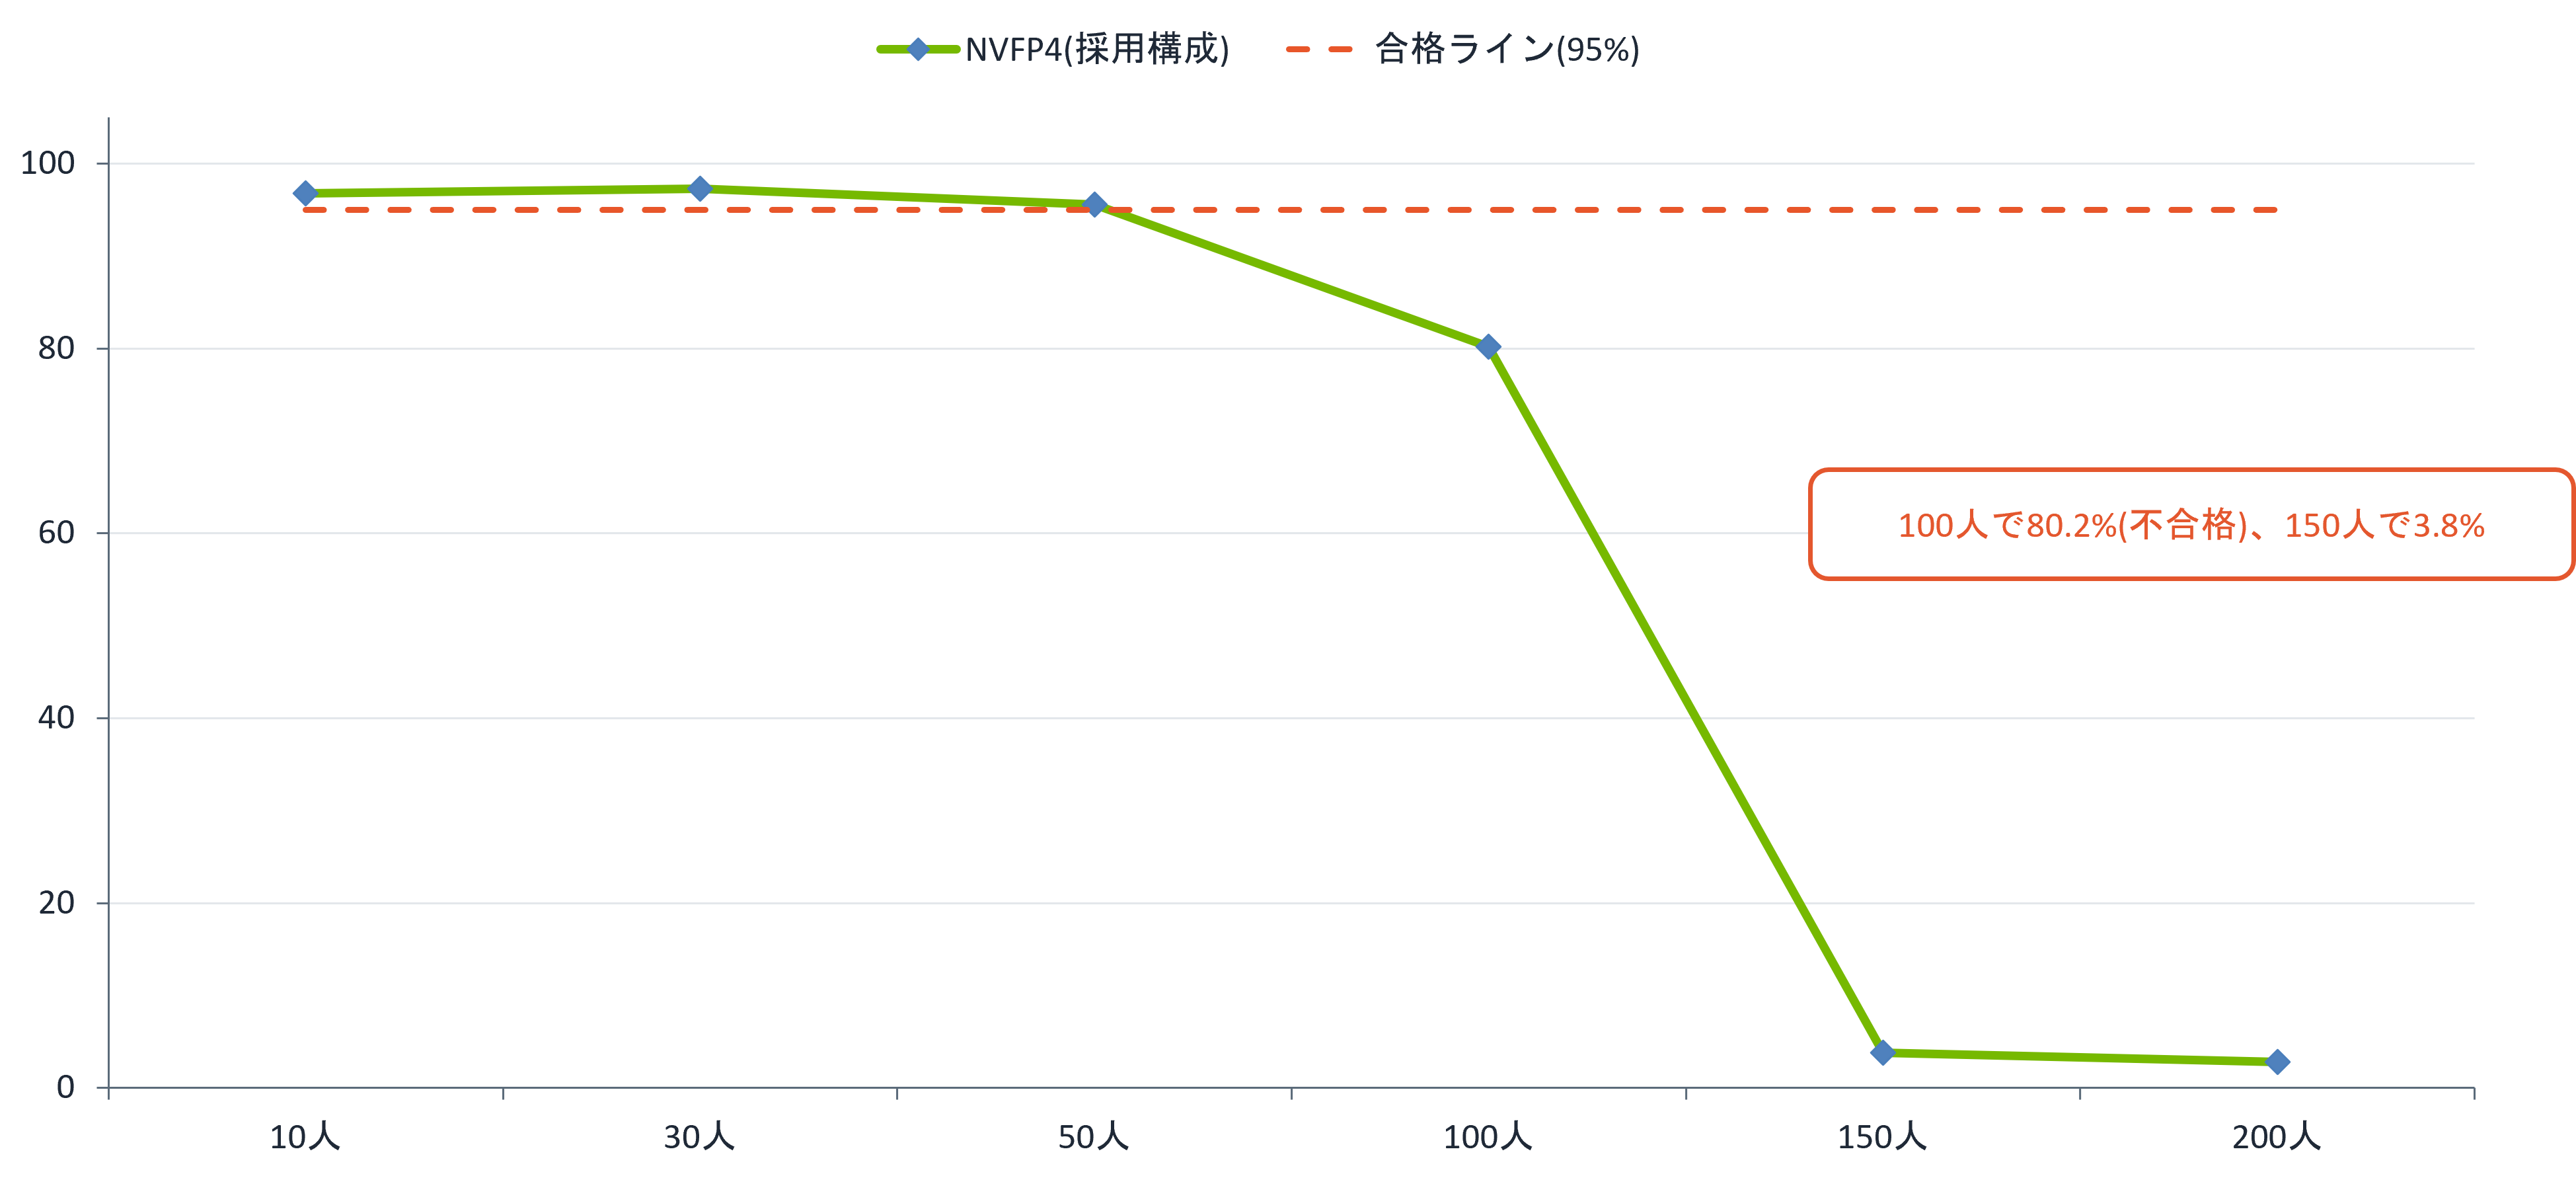
The comfort rate for each number of simultaneous users is shown in the figure above. For 10 to 50 simultaneous users, the comfort rate remained above 95%, meeting the standard. For 100 simultaneous users, it dropped to 80.2%, falling below the standard, and for 150 simultaneous users, it fell to 3.8%. Below, we will examine the results for 50 simultaneous users, the maximum number that met the standard.
|
Index |
average |
|
Generation rate per person |
Approximately 100 tokens / second, approximately 0.59 seconds |
|
Waiting time until the first character |
Approximately 0.59 seconds |
The comfort rate was 95.6%, meeting the standard. Generation speed and latency are distributed per request. The generation speed averaged approximately 100 tokens / second, more than double the standard (50 tokens / second). Latency also averaged approximately 0.59 seconds, significantly below the standard of 2 seconds. The comfort rate represents the percentage of requests that met both the generation speed and latency conditions.
In a test with 50 simultaneous users, 1,840 requests were processed in 30 minutes. The average input per request was approximately 108,000 tokens (median approximately 83,000 tokens), and the average output was approximately 910 tokens (median 347 tokens), a load typical of agent usage, where long inputs are returned with short outputs. Due to intervals between conversations, the average number of concurrently processed requests was around 10. The measurements confirmed that the speed is sufficient for an environment used daily by 30 users.
Furthermore, the prefix cache hit rate measured on the inference server side was 94.3% with 50 concurrent users. Even with 10 to 100 concurrent users, the hit rate remained high at 93-96 %, indicating that the beginning of the same prompt is repeatedly used when using agents. This value will be used as a basis for later cost estimations.
The figures shown here are obtained with a typical configuration (vLLM + quantization model), not the result of optimization. New models are released quickly, and conditions vary depending on the actual SLA, the number of users, and the use case, so we recommend measuring benchmarks in your own environment when considering implementation. The specific configuration and measurement method will be explained in Episode 3.
Conversion from concurrent users to total users
The number of concurrent users and the number of users are different. Even if there are 30 users, not all of them are simultaneously requesting work from an agent for extended periods.
Therefore, we use the percentage of users who are using the service simultaneously during peak hours (peak simultaneous usage rate = number of simultaneous users during peak hours ÷ total number of users) to calculate the pass rate. If we estimate the peak simultaneous usage rate to be a generous 50%, a pass rate of 50 simultaneous users corresponds to a scale of 100 users. If we assume 30%, it would be approximately 170 users. However, it is important to note that 100 simultaneous users would fall below the standard.
The current 30 users are estimated to be around 10 to 15 concurrent users, so there is ample processing capacity. This distinction between "concurrent users" and "number of users" is also relevant to cost estimation.
Cost estimate: How many users are needed to break even?
Now, let's move on to another question: cost estimation. For an environment with an initial investment of 100 million yen, the question is how many users it would take to break even compared to the annual cost of using the same amount of data via an external API.
The calculations will be organized in the following order:
1. Assumptions for the calculation: Actual operational data and annual costs on the on-premises side.
2. Estimate: Annual cost of processing the same amount using an external API (with and without prompt caching)
3. Estimated results: Comparison of annual costs for external APIs and on-premises solutions for each number of users.
4. Reference: Annual costs if agent usage expands further
5. Values and points to note that cannot be expressed numerically.
Since the team's operations are entirely on-premises, the calculations will also be based on the assumption of on-premises operation only.
The calculations are based on API unit prices confirmed on September 15, 2026, and the exchange rate as of September 2026. Since exchange rates and unit prices fluctuate, please check the assumptions and calculation formulas rather than the amounts themselves, and substitute them with your company's figures. The calculation process will be explained in Episode 3.
|
premise |
value |
|
money order |
1 USD = 160 JPY |
|
Annual business days |
240 days |
|
Cash hit rate |
There are two options: 90% (standard) and 95%. |
|
Initial investment (equipment such as GPU servers) |
100 million yen will be depreciated in the straight line over 5 years. [5] |
|
Running costs (electricity bill, etc.) |
18 million yen / year (our estimate) |
Assumptions for the calculation: Actual operational data
|
item |
Achievements |
|
Number of users |
Approximately 30 people |
|
Number of requests |
Approximately 4,300 cases per day (approximately 1.027 million cases per year) |
|
Token amount |
Annual Input: Approximately 131.7 billion / Output: Approximately 540 million (compiled from NVIDIA NeMo™ Switchyard metrics) |
|
Comparative unit price |
Claude Opus 4.8 API standard pricing (Input $5 / Output $25 per MTok)[6] |
|
Cash price per unit |
Read (hit): $0.50 / Write (5-minute cache) $6.25 per MTok [6] |
The reason we're using Opus 4.8 for comparison pricing is, as mentioned in the first episode, because GLM-5.3-Flash received the same overall score as Opus 4.8 from a third-party organization.
The annual cost for the on-premises side is as follows:
Initial investment of 100 million yen: 20 million yen / year with straight-line depreciation over 5 years [5]
• Running costs (our estimate): 18 million yen / year
Total: Approximately 38 million yen / year
Calculation: If the same amount is used with an external API
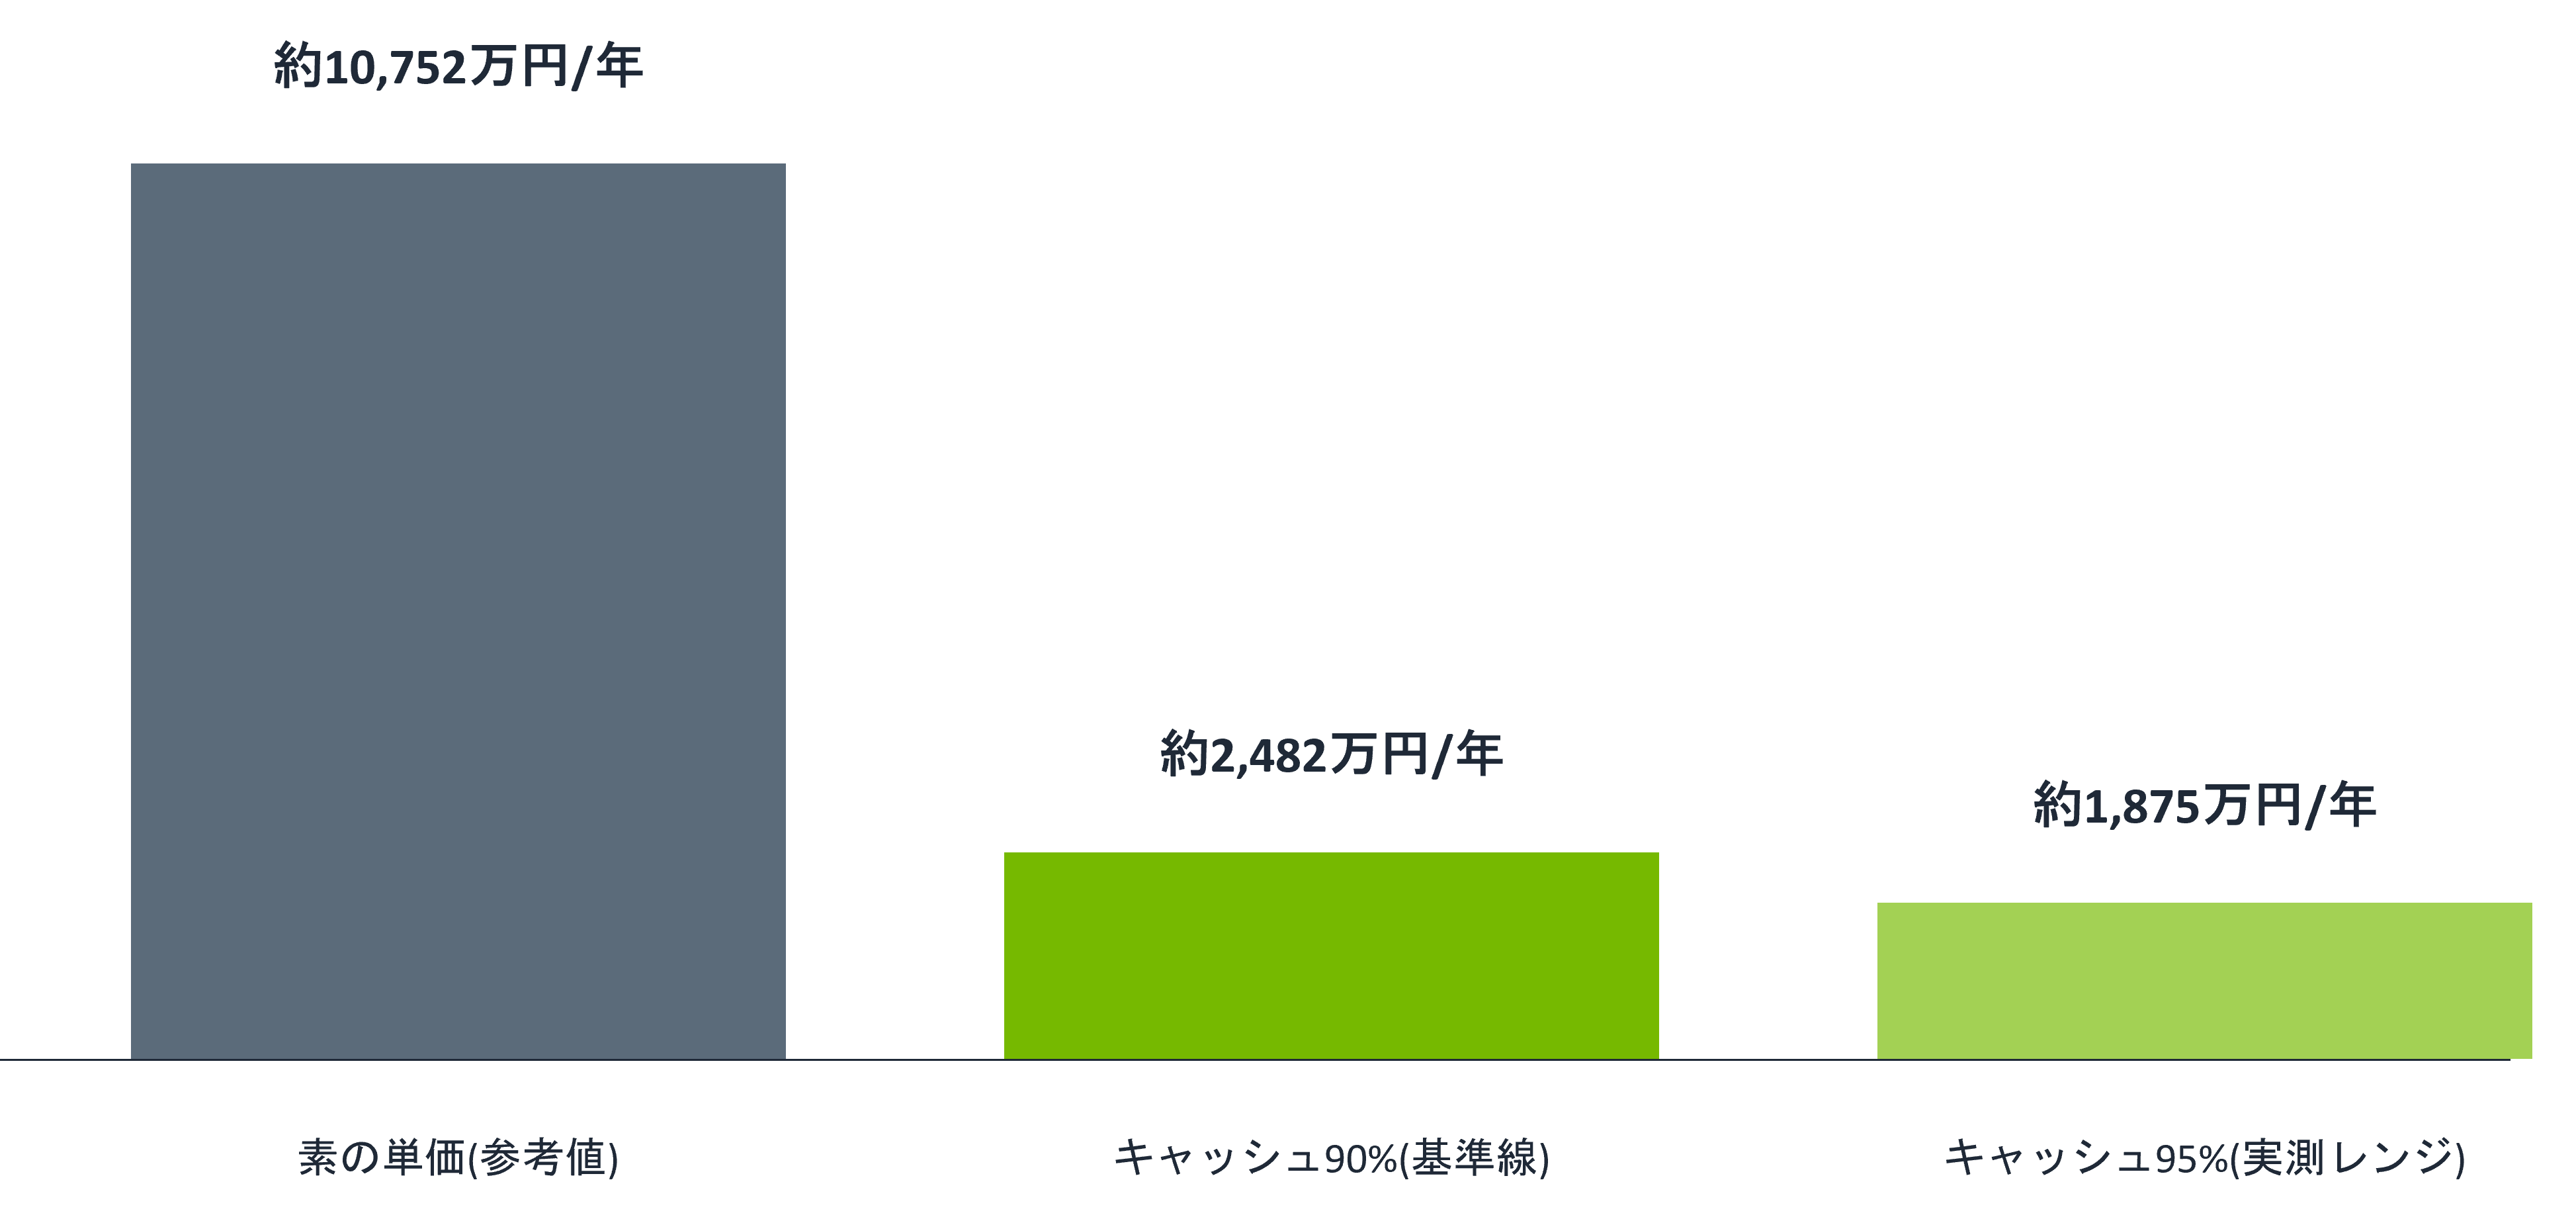
Based on the assumptions in the previous section (evaluating the actual usage of approximately 30 users at the Opus 4.8 unit price), we will estimate the annual cost. If all inputs are paid at the standard unit price ($5) without using any prompt cache, the annual cost would be approximately 107.5 million yen. However, since the agent's clients automatically use prompt cache, the actual billed amount will be less than this. The amount considering the cache was calculated using a read unit price ($0.50) for inputs that hit the cache and a write unit price ($6.25) for inputs that did not hit the cache.
|
Cash hit rate |
Annual APIequivalent |
Comparison with no cache |
|
None (for reference) |
Approximately 107.5 million yen / year |
− |
|
90% (standard) |
Approximately 24.8 million yen / year |
▲77% |
|
95% (a value close to the actual measurement in performance testing) |
Approximately 18.8 million yen / year |
▲82% |
Performance measurements showed a cache hit rate of 93-96 % on the inference server side. This is because the beginning of the same prompt is repeatedly used when using the agent. Even considering caching, processing the same amount using an external API would cost around 20 million yen per year.
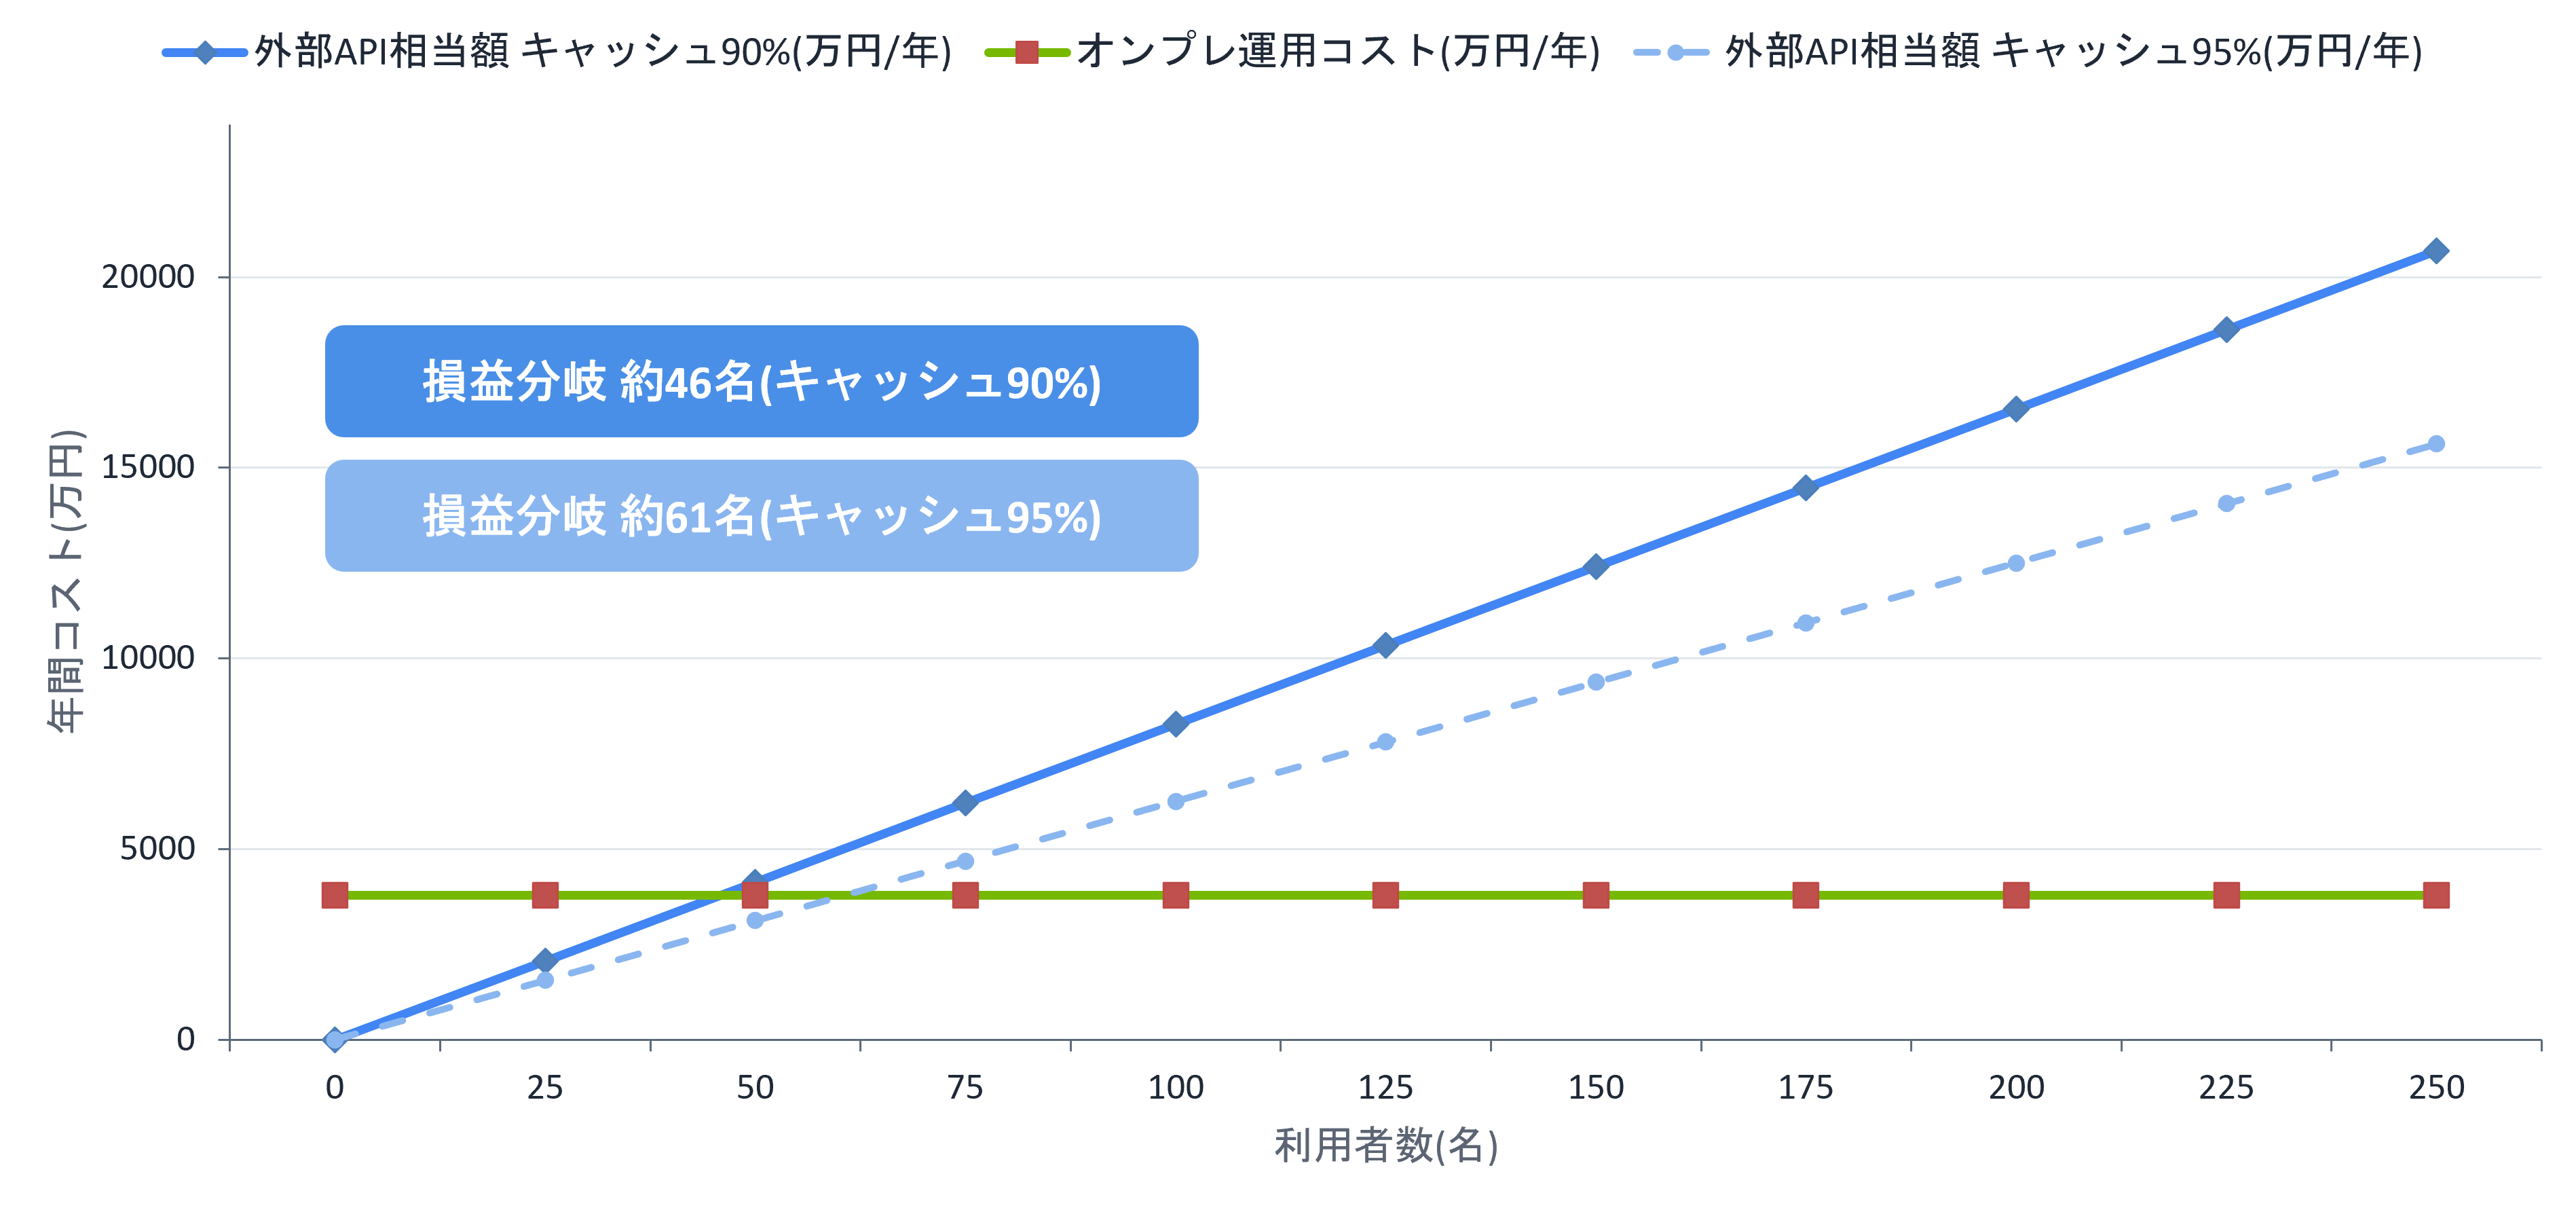
Estimated result: Approximately 45-60 people
We compare the annual on-premise cost (approximately 38 million yen) with the equivalent external API cost per user (based on actual usage for 30 users, proportionally allocated to the number of users). Cache hit rates were calculated using two scenarios: 90% and 95%.
In the case of a 90% cash hit rate (benchmark)
|
Number of users |
Number of simultaneous users (Peak simultaneous usage rate 30 ~ 50%Assumption) |
APIequivalent amount / year |
On-premisesTCO/year (Including depreciationfruit) |
Annual difference |
initial 1 The billion yenHarvest period * |
|
30 people (currently) |
10-15 people |
Approximately 24.8 million yen |
Approximately 38 million yen |
▲13.2 million yen |
Approximately 15 years (cannot be recovered within the 5-year service life) |
|
50 people |
15-25 people |
Approximately 41.4 million yen |
Approximately 38 million yen |
+3.4 million yen |
Approximately 4 years and 3 months |
|
60 people |
18-30 people |
Approximately 49.6 million yen |
Approximately 38 million yen |
+11.6 million yen |
Approximately 3 years and 2 months |
|
100 people |
30-50 people |
Approximately 82.7 million yen |
Approximately 38 million yen |
+44.7 million yen |
Approximately 1 year and 6 months |
|
150 people |
45-75 people |
Approximately 124.1 million yen |
Approximately 38 million yen |
+86.1 million yen |
Approximately 11 months |
If the cash hit rate is 95%
|
Number of users |
Number of simultaneous users (Peak simultaneous usage rate 30 ~ 50%Assumption) |
APIequivalent amount / year |
On-premisesTCO/year (Including depreciationfruit) |
Annual difference |
initial 1 The billion yenHarvest period * |
|
30 people (currently) |
10-15 people |
Approximately 18.8 million yen |
Approximately 38 million yen |
▲19.2 million yen |
Unrecoverable |
|
50 people |
15-25 people |
Approximately 31.3 million yen |
Approximately 38 million yen |
▲6.7 million yen |
Approximately 7 years and 7 months (unrecoverable within the 5-year service life) |
|
60 people |
18-30 people |
Approximately 37.5 million yen |
Approximately 38 million yen |
▲500,000 yen |
Approximately 5 years and 2 months (unable to recover within the 5-year service life) |
|
100 people |
30-50 people |
Approximately 62.5 million yen |
Approximately 38 million yen |
+24.5 million yen |
Approximately 2 years and 3 months |
|
150 people |
45-75 people |
Approximately 93.8 million yen |
Approximately 38 million yen |
+55.8 million yen |
Approximately 1 year and 4 months |
*The "Recovery Period for Initial 100 Million Yen" and "Annual Difference" in the table are calculated using different methods. Also, amounts are rounded to the nearest 100,000 yen.
• Recovery period for the initial 100 million yen:
This is the number of years obtained by dividing the initial investment of 100 million yen by the annual savings calculated as "API equivalent amount-running costs of 18 million yen". Depreciation expenses are not deducted because they are the initial investment of 100 million yen divided by the number of years, and deducting them here would result in counting the same 100 million yen twice.
Annual difference
This is the difference when comparing annual costs, including depreciation. A positive result means that on-premise is more advantageous in total cost over the 5-year useful life.
The break-even point where annual costs including depreciation are balanced is approximately 45 users with a cash hit rate of 90% and approximately 60 users with a cash hit rate of 95%. To recover the initial investment in 3 years, approximately 60 users are needed at 90% and approximately 80 users at 95%. On the other hand, the scenarios in this table fall within the range confirmed by performance measurements. The current 30 users are estimated to be around 10 to 15 concurrent users, leaving ample headroom in terms of performance. The result of achieving the standard with 50 concurrent users corresponds to a scale of 100 users (peak concurrent usage rate of 50%) to 170 users (peak concurrent usage rate of 30%), so the 50 to 100 user scenario can be easily accommodated. The 150 user scenario also falls within the range that meets the standard, with 45 concurrent users if the peak concurrent usage rate is 30%.
Reference: When used continuously under the same load as the benchmark.
As a guideline for what to expect if agent usage becomes more widespread, we will estimate the performance under the same load as the performance measurement benchmark, but over a longer period of time. The conditions are as follows:
|
item |
conditions |
|
load |
AgentX MVP: Usage pace per person for 50 simultaneous users (meeting the criteria). |
|
Operating time |
8 hours per day x 240 days per year (for reference, we also calculated 24 hours x 365 days) |
|
Unit price and cash |
Claude Opus 4.8 API, 90% cache hit rate |
The results of the calculation are as follows:
• The average annual API usage per person is approximately 3.15 million yen (90% cash).
With 50 users, the annual cost is approximately 158 million yen. The difference compared to the cost of on-premise operation (approximately 38 million yen per year) is approximately 120 million yen per year, meaning the initial investment of 100 million yen can be recovered in less than a year.
Furthermore, if agents continue working even at night and on holidays, operating 24 hours a day, 365 days a year (4.56 times the above), it would amount to approximately 14.4 million yen per person per year (90% cash), and approximately 720 million yen per year for 50 users. This pace represents a load approximately 3.5 times that of current actual usage (compared by annual input tokens per person).
However, the use of agents working continuously is already becoming a reality. In May 2026, NVIDIA announced the NVIDIA Factory Operations Blueprint (FOX) as a reference design for building a “factory management agent” that would constantly monitor factory conditions and oversee numerous specialized agents. [7] As agents continue to work in place of humans, the cost of external APIs will reach hundreds of millions of dollars per year, and the difference with on-premises solutions with fixed initial investments will widen in proportion to usage.
Values and points to note that cannot be expressed numerically
There are values that don't show up in the calculation of costs. One is the ability to use it without worrying about usage limits. You can finally perform the tasks that you couldn't do due to limits, which was the starting point of this series. Another is that you don't have to send confidential data externally. For business operations where sending data externally is not permitted, on-premises is the only option, even before comparing costs.
Furthermore, the risks associated with reliance on cloud APIs are eliminated here. Even if the provider changes specifications or discontinues services, the on-premises environment can be controlled by the company, ensuring the continuation of essential services. The fact that it is less susceptible to external API failures or price increases is also a value from the same perspective.
There are some points to note. Maintenance personnel costs and operational man-hours are not included in the estimates. Also, the recovery calculation is heavily influenced by the cache hit rate. A lower hit rate will lead to profitability sooner, while a higher hit rate will delay it. It is also important to note that there are difficult tasks that cannot be handled with the on-premises model alone. If GPU idle time can be utilized for nighttime batch processing, recovery can be accelerated.
Summary
In this article, we examined the capabilities of on-premises environments from two perspectives: performance and cost.
In terms of performance, using the publicly available benchmark AgentX MVP, we achieved a comfort rate of 95.6% with 50 simultaneous users, meeting the standard. The average generation speed per person was approximately 100 tokens / second, and the average waiting time to the first character was approximately 0.59 seconds. Based on a peak concurrent usage rate (30-50%), this translates to a capacity of 100-170 users.
In terms of cost, we compared the costs of on-premises operation and external APIs based on actual operational data from 30 users. The break-even point is approximately 45 users with a 90 % cash hit rate and approximately 60 users with a 95 % cash hit rate. The cost advantages of on-premises operation become clear when the number of users exceeds 100.
Furthermore, performance measurements have confirmed that the system works within the range from the break-even point up to a scale of 170 employees. The challenge going forward lies not so much in the technical aspects, but rather in how to proceed with internal deployment. While it is important to test on a small scale and verify the technical effectiveness, when making investment decisions, it is essential to consider how far company-wide deployment can be expected in the future.
Furthermore, if agents continue to work through nights and holidays, the cost of external APIs could reach several hundred million yen annually, further widening the advantages of on-premise solutions.
On the other hand, difficult tasks or tasks with high decision-making risk are best handled by a closed Frontier model. Because these tasks are infrequent, API charges are minimal. We believe that a division of labor, where routine operations are handled on-premises and only highly complex tasks are outsourced to the Frontier model, is effective in terms of both cost and quality.
Supporting this division of labor is the hybrid inference platform, the theme of this series. We encourage you to build one in your company and promote the company-wide use of generative AI.
For those who want to actually try out the environment described in this series before making an investment decision, Macnica 's AI TRY NOW PROGRAM is a convenient option. This program allows you to test the latest AI software, including AI agent platforms, before implementation, and the testing covered in this series was also conducted in the AI TRY NOW PROGRAM environment (see Episode 1).
During the production deployment phase, Macnica has extensive experience in deploying GPU clusters to major domestic HPC and enterprise clients. Based on the in-house operational know-how introduced in this series, we will support you from environment construction to operation. In the construction phase, we will provide comprehensive support from pre-deployment design such as physical and logical design, port mapping, and SoW definition, to racking and wiring, hardware verification, firmware updates and OS installation, cluster configuration including job schedulers and NCCL, as well as system reviews, training, and the creation of handover documents. In the operation phase, in addition to Run:ai operation, LLM deployment, and performance measurement, you can also consult with us on building hybrid inference environments, the theme of this series, and on utilizing agents such as NVIDIA NemoClaw.
Please feel free to contact us for consultations, from the verification phase to full-scale implementation.
In Episode 3, we will explain the details of the environment we built (routing benchmarks) for engineers.
References
- [1] SemiAnalysis, “InferenceX by SemiAnalysis — Open-Source Agentic Inference Benchmark”
- [2] SemiAnalysis, “cc-traces-weka-062126” (Hugging Face dataset, 393 Claude Code sessions)
- [3] NVIDIA, “InferenceX AgentX MVP Benchmark — NVIDIA AIPerf Documentation”
- [4] ai-dynamo, “AIPerf” (GitHub)
- [5] National Tax Agency, “Table of Useful Lives of Major Depreciable Assets”
- [6] Anthropic, “Pricing — Claude Platform Docs”
- [7] NVIDIA Blog, “NVIDIA Factory Operations Blueprint Gives Factories a New AI Brain”
Inquiry