
![]()
![]() Narrow down by specifying conditions
Narrow down by specifying conditions
現在1890件がヒットしています。check
at the data center As the need for broadband increases, long-distance transmission400G Consideration is underway. As communication traffic increases, WDM (Wavelength Division Multiplexing) technology, which simultaneously transmits multiple wavelengths over a single optical fiber, is being used. like thisWDM technology When constructing a long-distance transmission line using It is necessary to confirm which band of light is being sent correctly.An optical spectrum analyzer works well.
There are probably many people who have a vague understanding of the usage and advantages of optical spectrum analyzers, but would like to know in what kind of environment they can actually be used and how to use them in concrete terms. In this article, we used II-VI (former Finisar) optical spectrum analyzer "WaveAnalyzer 200A" (hereafter WA200A) to verify the operation of 400G OpenZR+, which has become a hot topic these days. In the first half, we introduce the waveforms actually observed by the Company, and in the second half of the article,will explain in detail how to operate the WA200A.
How to measure 400G ZR+
Using the WA200A, I actually observed the spectrum of II-VI 's 400G ZR+.
400G ZR+ is II-VI 's latest optical transceiver module. The high Tx output power of 0dBm or higher enables simplified metro networks without transponders.
By using WA200A, you can check the waveform of this 400G ZR+.
Measurement system
This time, as shown in Fig. 1, the 400G ZR+ is inserted into the PPG built-in evaluation board, and it is configured to connect to the WA200A with the LC-APC connector.
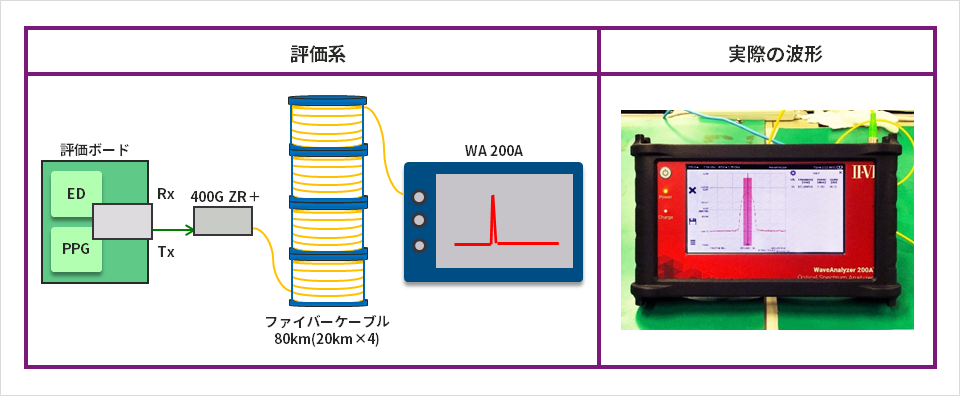
(Fig. 1) Evaluation system and actual waveform
Measurement example by WDM analysis
Figure 2 shows how the 400G ZR+ waveform is displayed. Waveforms are displayed at a high resolution of 1.75 GHz, and optical power and OSNR can be checked.
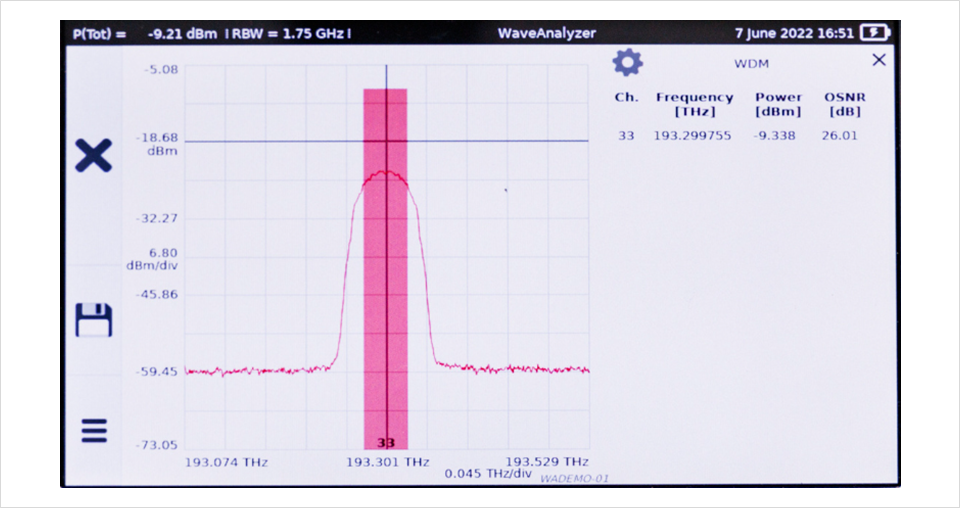
(Fig.2) Waveform of 400G ZR+ in WA200A
What is WA200A in the first place?
WA200A is a measuring instrument that can observe the optical spectrum as described above. The horizontal axis can be set to frequency [THz] (or wavelength [nm]), and the vertical axis can be set to the logarithmic scale [dBm] (or true value [mW]) of the absolute value of power.
Features of WA200A
The features of the WA200A used this time are as follows.
- Compact and easy to carry, but with all the functions you need on-site
- A spectrum analyzer made with DC operation in mind and a rich UI
- High performance and high resolution despite being usable like a power meter
- Since the channel number of the waveform is also displayed on the screen, it is obvious which waveform is broken.
WA200A spec table
|
spectrum measurement |
Frequency range THz |
191.9 – 196.2 |
|
wavelength range nm |
1527.8 – 1568.8 |
|
|
Frequency resolution GHz |
1.75 |
|
|
Wavelength resolution pm |
15 |
|
|
repeat drawing speed |
1 or more times per second |
|
|
input power |
Max total power dBm |
27 |
|
Max power density dBm/6.25GHz |
0 |
|
|
Environmental condition |
Temperature range °C |
5 – 35 |
|
Humidity range % |
10 – 85 |
|
|
interface |
optical input |
FC/APC |
|
Network |
Ethernet |
|
|
storage |
USB 2.0 master |
|
|
Mechanism condition |
Dimensions mm |
255 × 140 ×30 |
|
Weight kg |
1.2 |
Specifications are subject to change in the future.
Appearance of WA200A
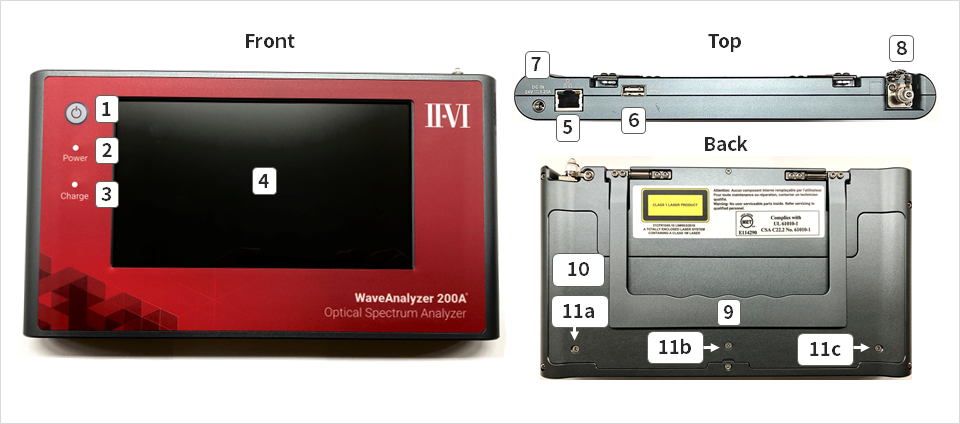
➀Power button
➁Power LED
③Charge LED
④Screen
⑤ Ethernet port
⑥ USB port
⑦ Power port
⑧ Optical signal input port
⑨ Stand
(10) Battery cover
(11) Battery cover screw
on-screen actions
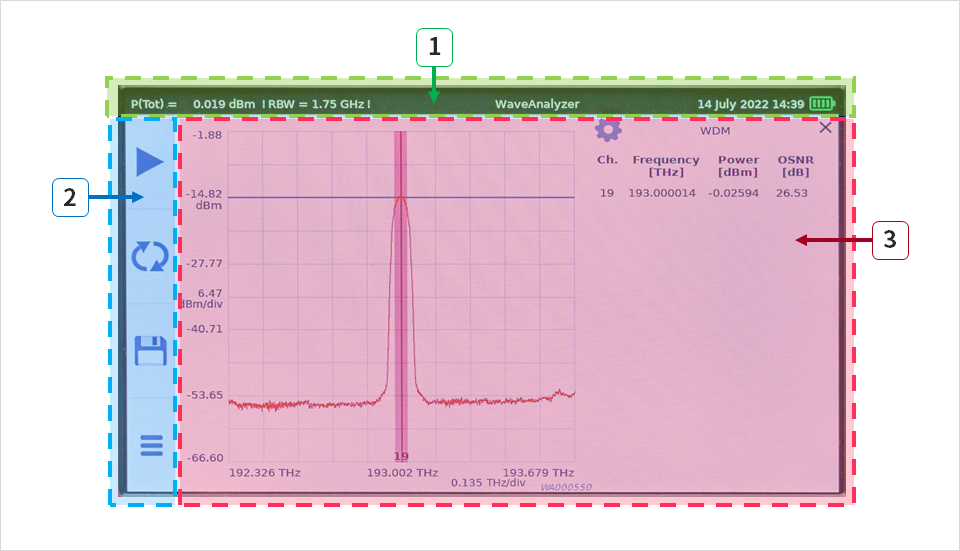
(Fig.4) Screen of WA200A
(1) Status bar
The status bar shows the following information:
・Total input power
・Resolution bandwidth
・Measurement settings
·date
・Battery charging status
②Menu bar

[Scan]
Perform a single sweep and display the spectrum.

[Repeat Scan]
Repeat sweeps, updating the spectrum display each time

[File operation]
Go to lower file operation menu.

[Settings]
Go to lower settings menu.
From the second layer of the [File Operation Menu], you can do the following.

[Waveform save]
Saves the waveform displayed on the display to the internal storage.

[Save image]
Saves the image displayed on the display to internal storage.

[Waveform readout]
Reads out a saved waveform.

[Export file]
Transfer files saved in the internal storage to an external USB memory.
From the second level of Settings, you can:

[Display settings]
Set the measurement method and graph display method.
[Horizontal axis unit] You can select from nm or THz.
[Unit of vertical axis] You can select from dBm or mW.
[Hold mode] You can select from maximum value, hold at minimum value or hold off.
[Averaging] Averaging can be performed from 2 to 64 points.
[Resolution bandwidth] Can be set to a high precision resolution bandwidth of 15 pm (1.75 GHz).
[Reference Display] References can be displayed.

[analysis]
You can select the analysis mode of WDM or wavelength meter.
[WDM] The following items can be set from the gear icon on the left of the WDM page.
In addition, it is possible to save the frequency, optical power, and OSNR of each channel as a CSV file from the item [Save tabular data].
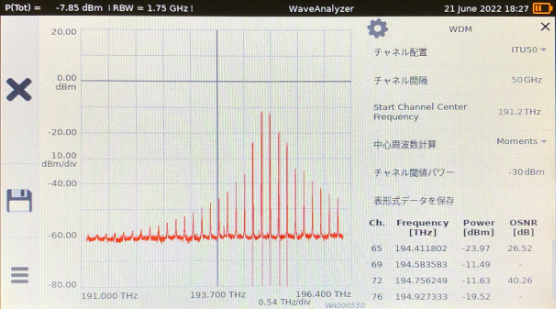
[Channel placement]
[Channel spacing]
[start channel frequency]
[Center frequency calculation]
[Channel threshold power]
Save tabular data
[wavelength meter]
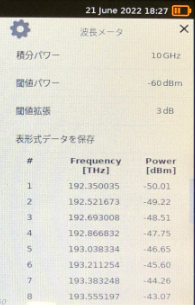
[integral power]
[Threshold power]
[Threshold Extension]
Save tabular data

[Settings]
Set the brightness of the display, date and time.

[Help]
You can learn how to use the WA 200A.
(3) Graph area
The graph area where the measurement results are displayed is a touch screen, allowing intuitive operation like a smartphone.
・Drag: You can drag the graph with one finger.
・Zoom in/Zoom out: You can zoom in and out on the graph with two fingers. When done on the X-axis or Y-axis, it is possible to enlarge or reduce only the target axis.
・Marker: By pressing and holding one finger, you can display the marker. This marker can also be moved by dragging.
・Auto scale: Double-tap the graph area to automatically adjust the vertical and horizontal axes.
Voice of the customer who adopted us
We have received positive feedback from customers who have actually used the WA200A, and we would like to introduce some of them.

Although it can be used like a power meter,
Necessary items firmly from the operator's point of view
It was comprehensive, and I was surprised at how authentic it was.

Can be used without special knowledge.
As long as you know the channel, even a newcomer
Troubleshooting can be done!
I am happy that it is small and can be carried around.
Please contact us
In this article, I explained an example of 400G ZR+ spectrum measurement using the WA200A and how to operate the WA200A. I would appreciate it if you could give me a concrete usage image of how to actually use it and what kind of operation it can do.
If you have any questions or concerns, please contact us using the form below.