
Introduction
In this article, following the 9th and 10th articles, we will introduce the procedure for creating a dashboard for visualizing network operations using the Open Source Software (OSS) tool Grafana.
There are other articles related to Open Networking, so please see the article that interests you from the "List of articles" below.
What is a dashboard
A dashboard is a tool that displays acquired data in various formats, such as graphs and tables, and visualizes them collectively on a single screen.
In order to create a dashboard, it is necessary to connect with the data source that stores the data, and Grafana mainly uses data sources such as InfluxDB and Prometheus. Examples of visualization on the dashboard include white Box switch traffic flow, interface status, and hardware resource information, making it easier for administrators and operators to understand the status of the monitoring system.
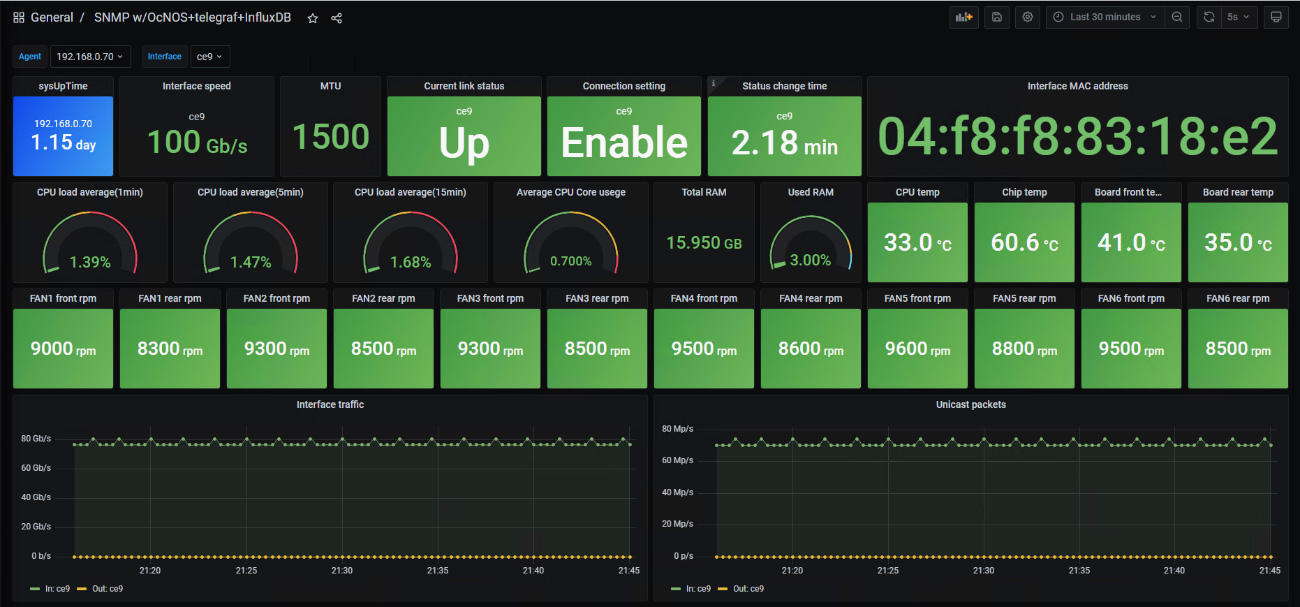
Figure 1: Grafana dashboard visualization example
Preparing to create a dashboard
Grafana To create a dashboard with Grafana and a data source. Grafanaand the correlation diagram of the data source isArticle 9 of Figure 1(Visualization environment configuration diagram)are posted on the website, so please take a look at them from time to time. This time InfluxDB We'll show you how to work with us.
① After logging in to Grafana from a web browser, select [Data Sources] from the setting mark "⚙" on the left of the top menu.
② Select [Add data source] on the upper right
③ Select [InfluxDB]
④ Enter the IP address and TCP port number of the server in the [URL] field in the green frame below.
* You can check the TCP port number in the InfluxDB configuration file (influxdb.conf).
⑤ Enter any database name in [Database] in the yellow frame below.
⑥ Press [Save&Test] in the purple frame below to save the settings.
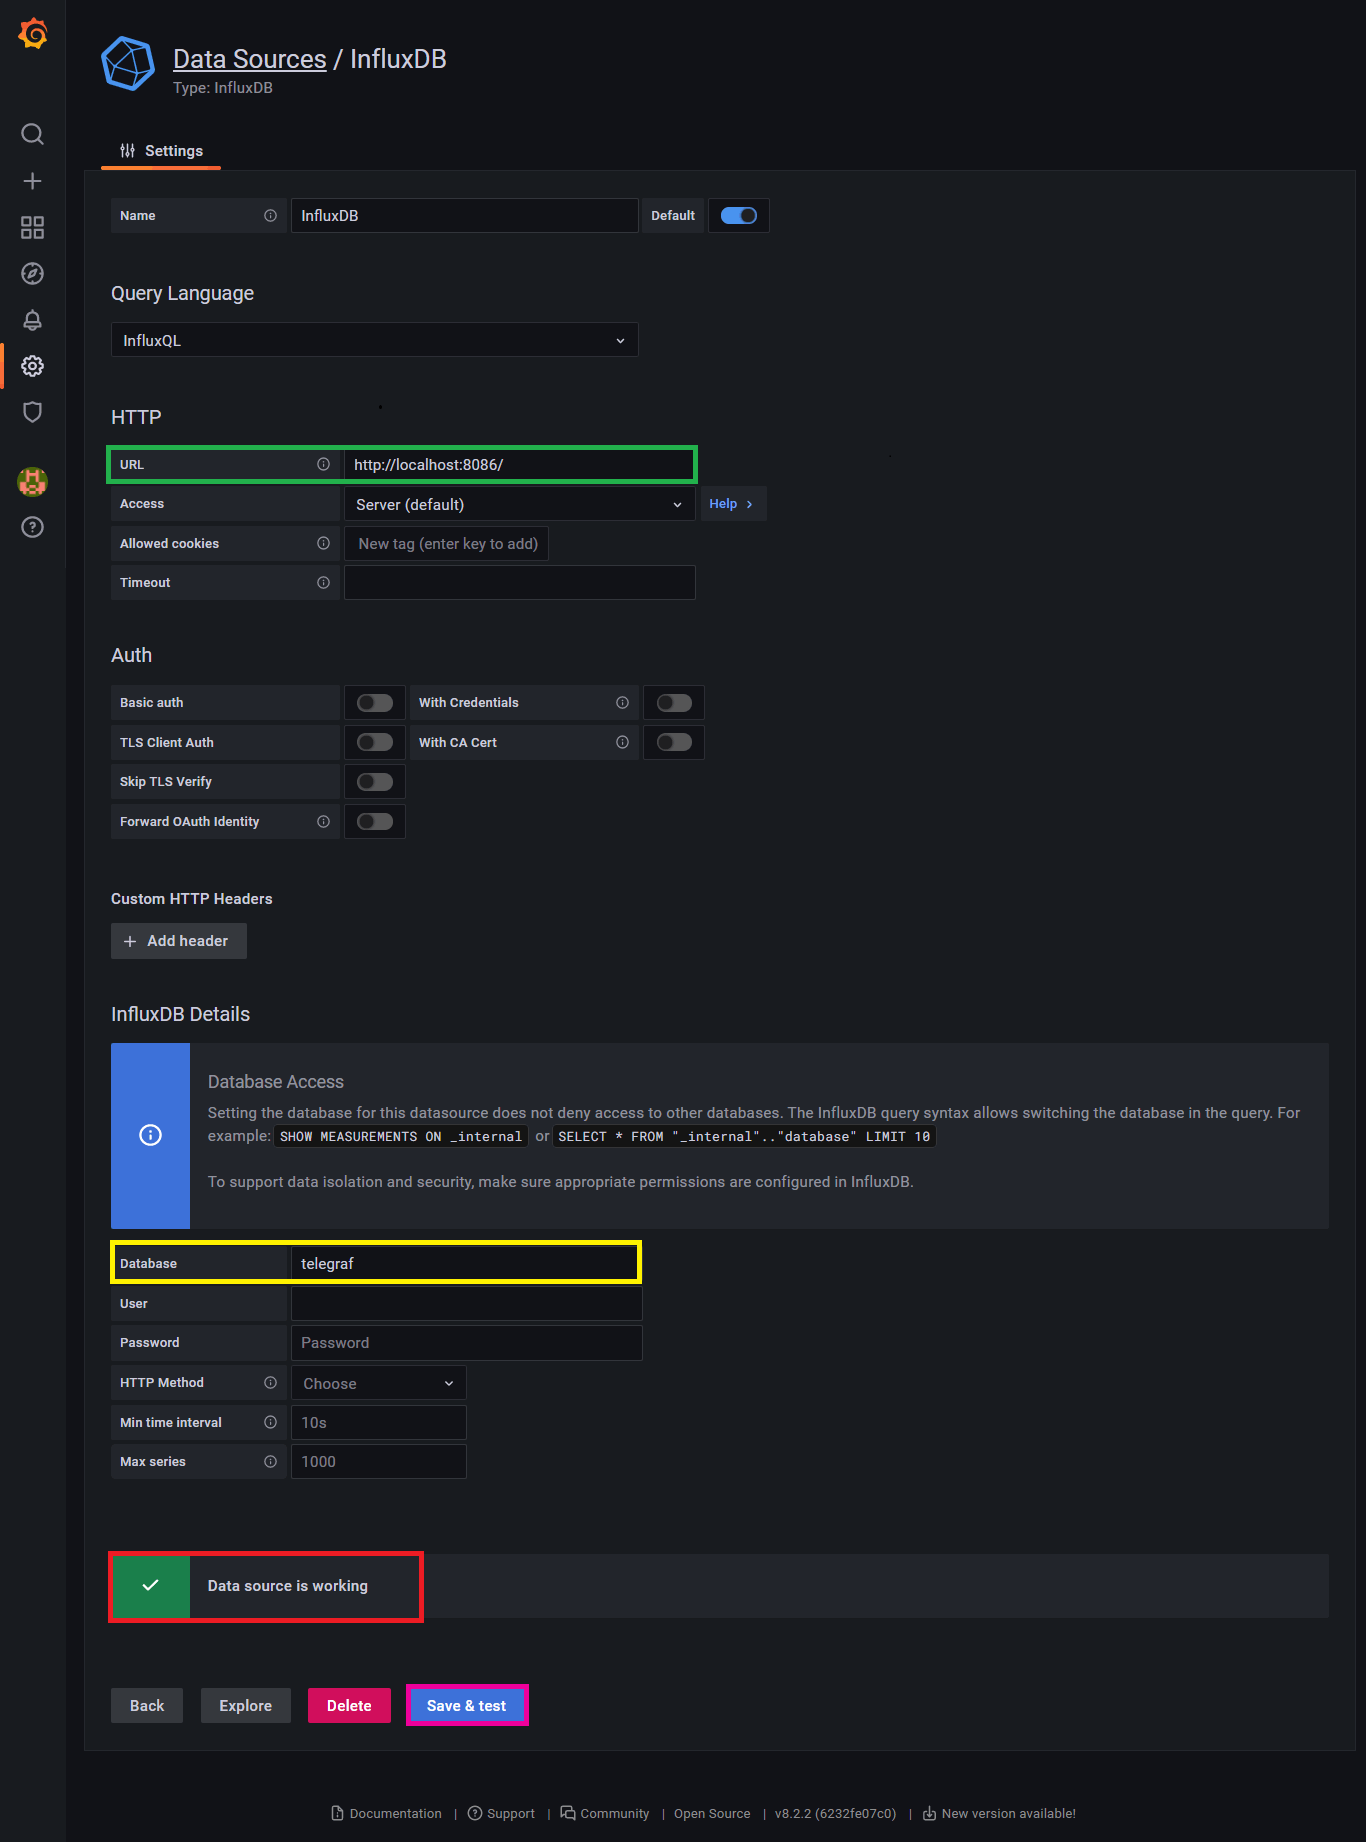
Figure 2: InfluxDB integration setting screen
If there is no problem in linking with the data source, [Data Source is working] will be displayed as shown in the red frame above.
Dashboard creation
Below are the steps to create a dashboard.
① Select [Manage] in the mark of four squares on the left of the top menu
② [New Dashboard] choose
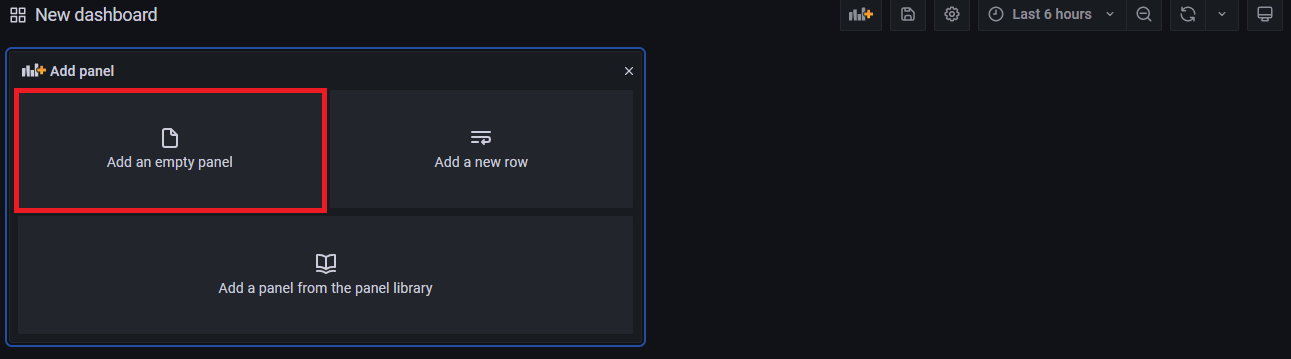
Figure 3: Dashboard creation screen
On the dashboard creation screen, you can add a panel (data display) by selecting [Add an empty panel] in the red frame above. The figure below shows the screen for adding a panel, and the query part in the red frame allows you to set the data acquisition, and the yellow frame allows you to set the name of the panel, the display format (graph, table, etc.), the unit of the axis, etc.
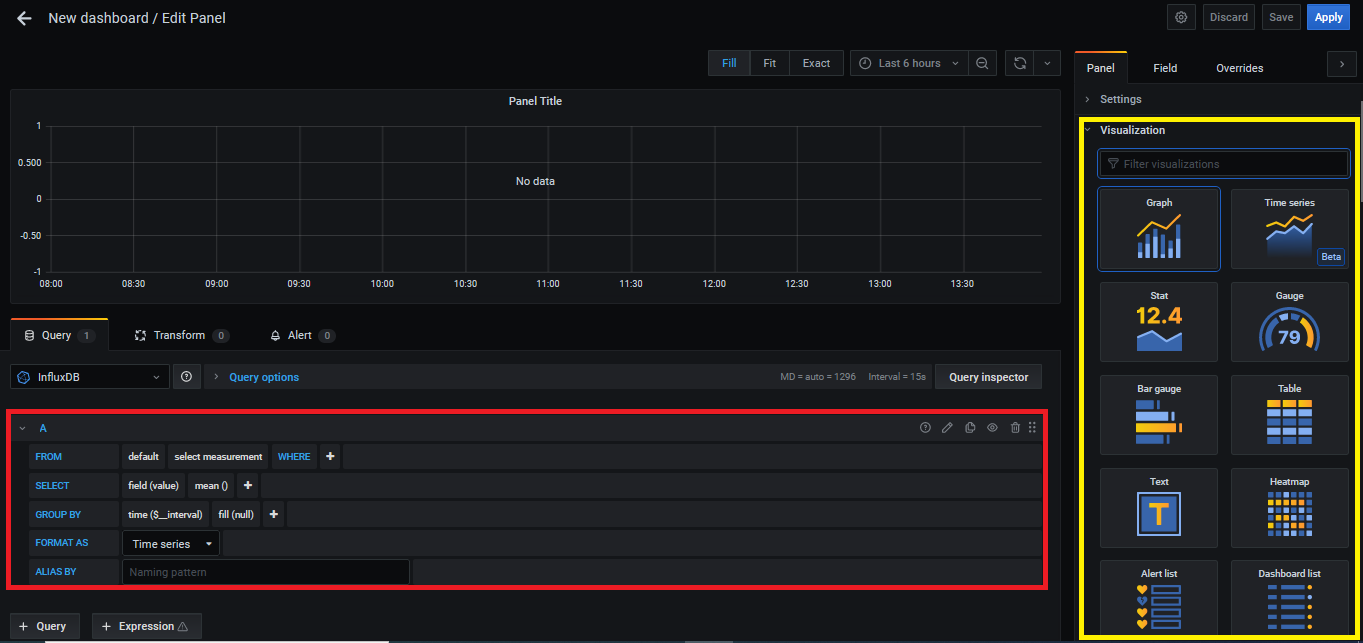
Figure 4: Panel add screen
Panel data acquisition settings
next Grafana from To get data into InfluxDB settings of (below query) I will describe the method. When linking with InfluxDB, queries are set in pull-down format and description format. Queries in InfluxDB use a language similar to SQL called InfluxQL (Influx Query Language).
For the purposes of this article, here are some important InfluxDB terms:
・ measurement:SQL corresponds to the table in
・ tag: Items used for data searches and conditions when acquiring data
・ field: data value
・timestamp: the time when the data was saved
The figure below shows the query setting screen, but the role of each item (clause) in blue on the screen is described. For FORMAT AS and ALIAS BY clauses, the explanation is omitted in this article.
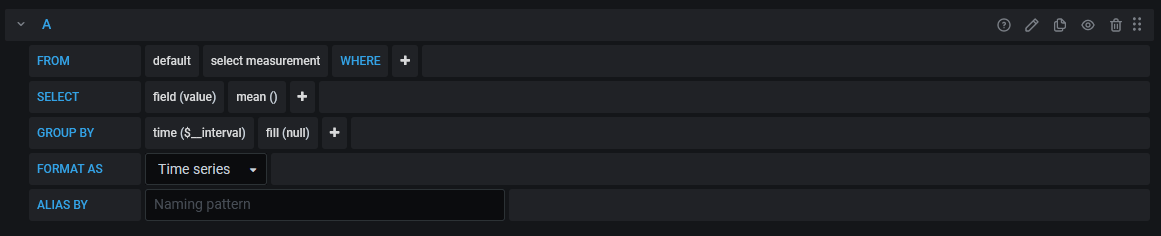
Figure 5: Query settings screen
FROM, WHERE 句
The FROM clause determines from which measurement (hereafter the table) the data will be retrieved. By specifying a conditional expression in the WHERE clause, you can acquire only the data that matches the set conditions. Use tag and variables described later in the conditional expression.
SELECT-clause
In the SELECT clause, set the acquisition of single or multiple tags and fields. You can also get the average value and total value of all saved data. The values of tag, field and timestamp are stored in the table for each time series. The table below is an example of saved data.
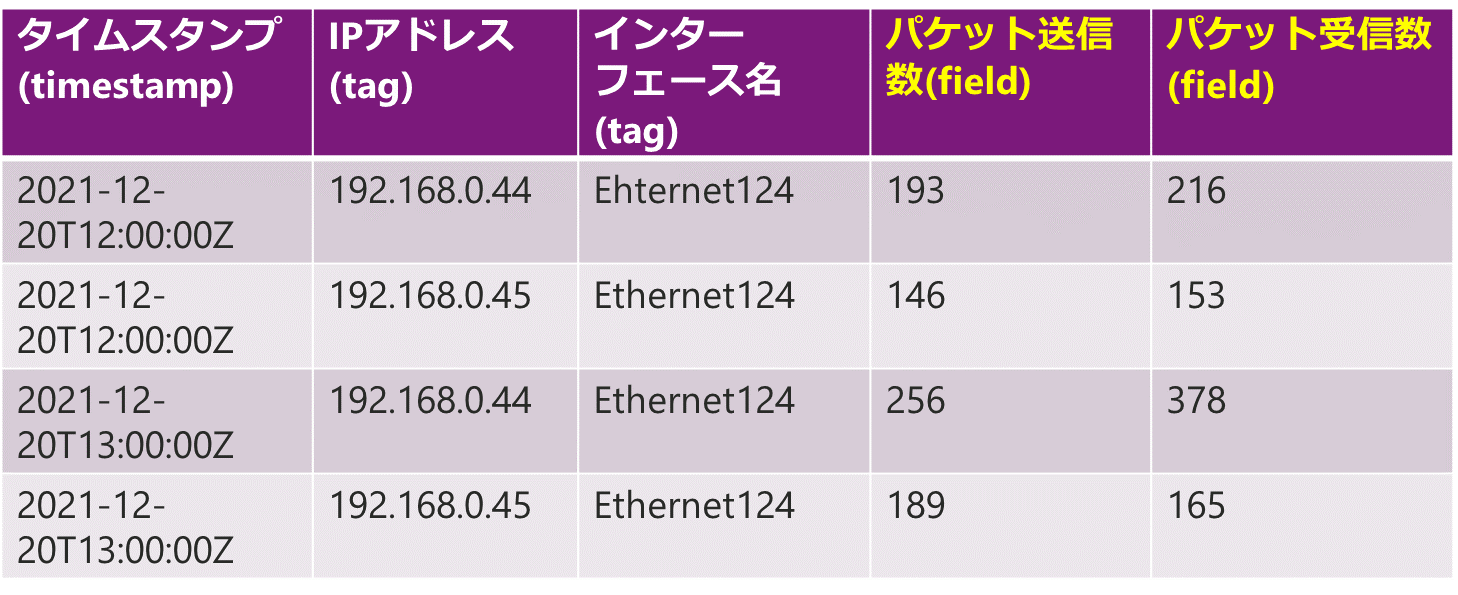
Table 1: Table data storage example
GROUP BY clause
In the GROUP BY clause, you can divide into groups based on the specified tag. The result of grouping the above table by IP address (tag) and totaling all data is as follows. When grouped by interface name (tag), total values grouped by Ethernet124 are output.
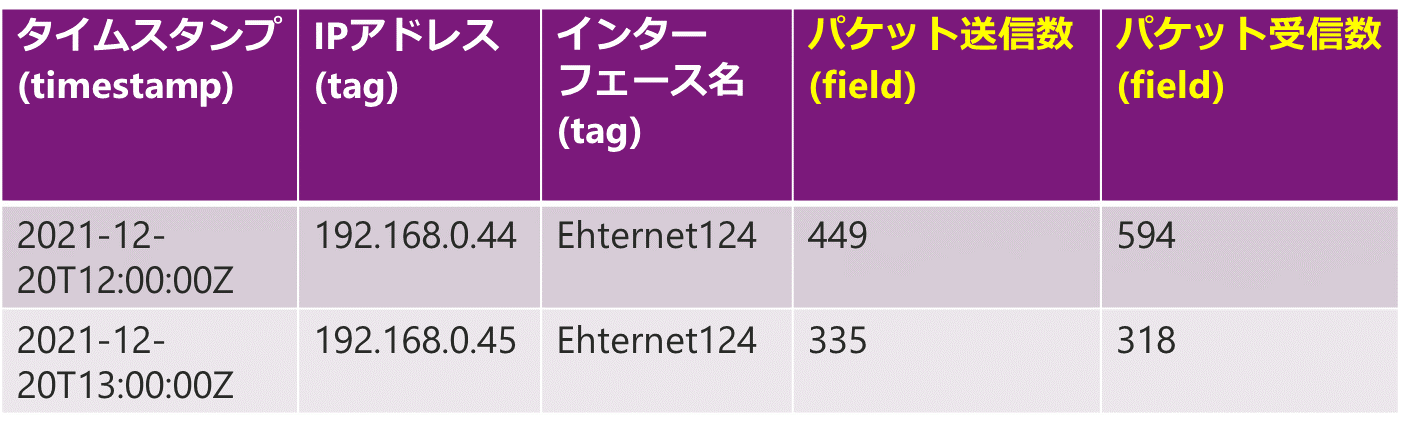
Table 2: Example of grouping the data in Table 1 by IP address
Configuring variable filtering
With Grafana, you can switch the display contents of multiple dashboards by filtering with registered variables. listed below In the example, filtering is performed using all device interface names as variables, Switch the contents of the dashboard.
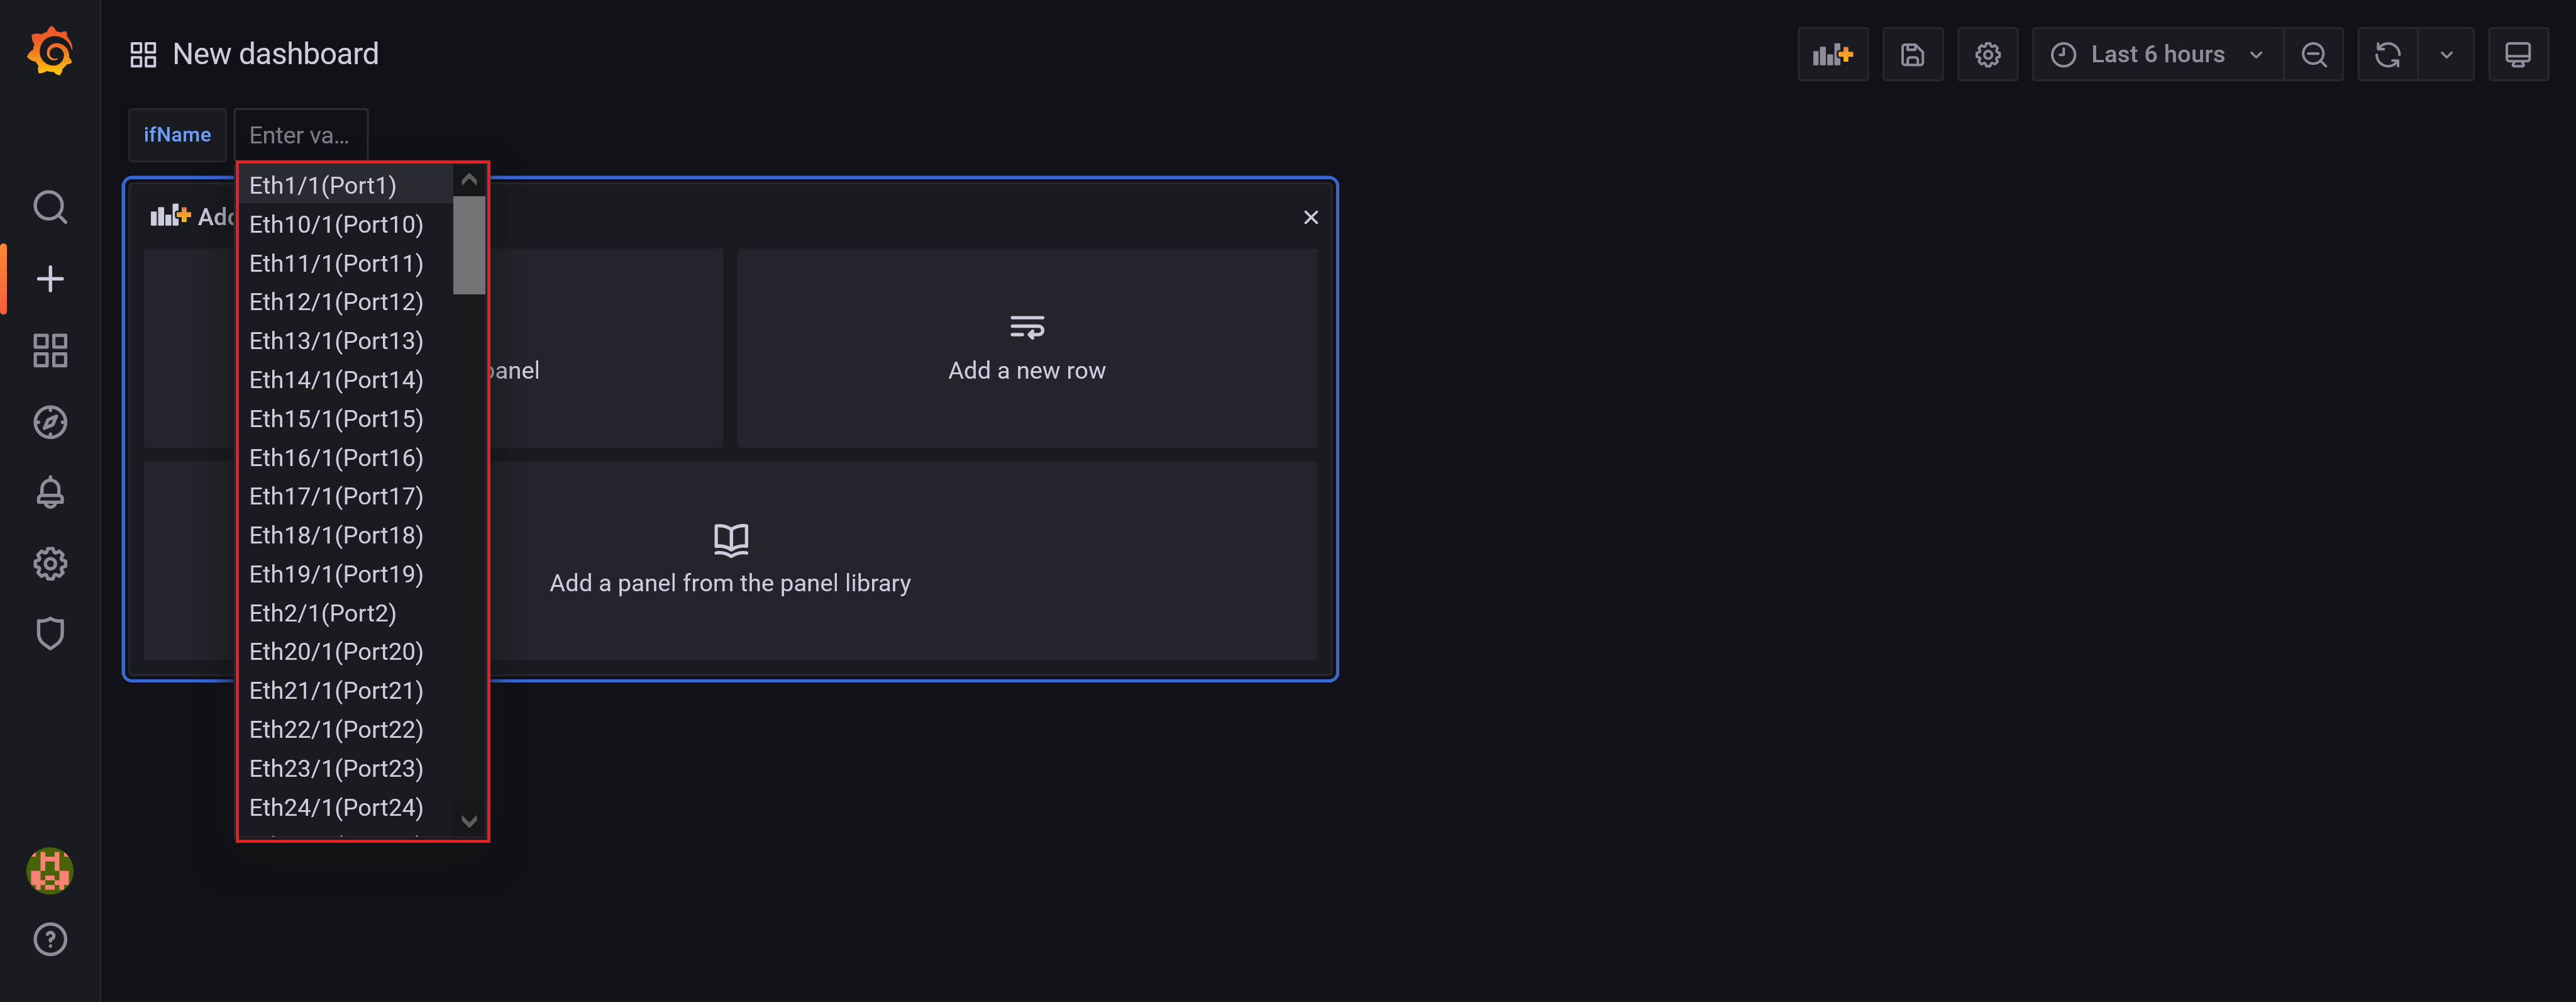
Figure 6: Results of variable filtering reflection
How to create variables
① Click [Dashboard Settings] choose
② Click [Variables] choose
③ [Add variable] choose
④ Enter any variable name in [Name] in the yellow frame below
⑤ Specify the conditional statement for data acquisition in [Query] in the red frame below
* The conditional statement specified on the screen will be the operation of acquiring a list of tags of [ifName] from the table [ifTable], and the results will be displayed in [Preview of values].
⑥ Press [Update] in the purple frame below.
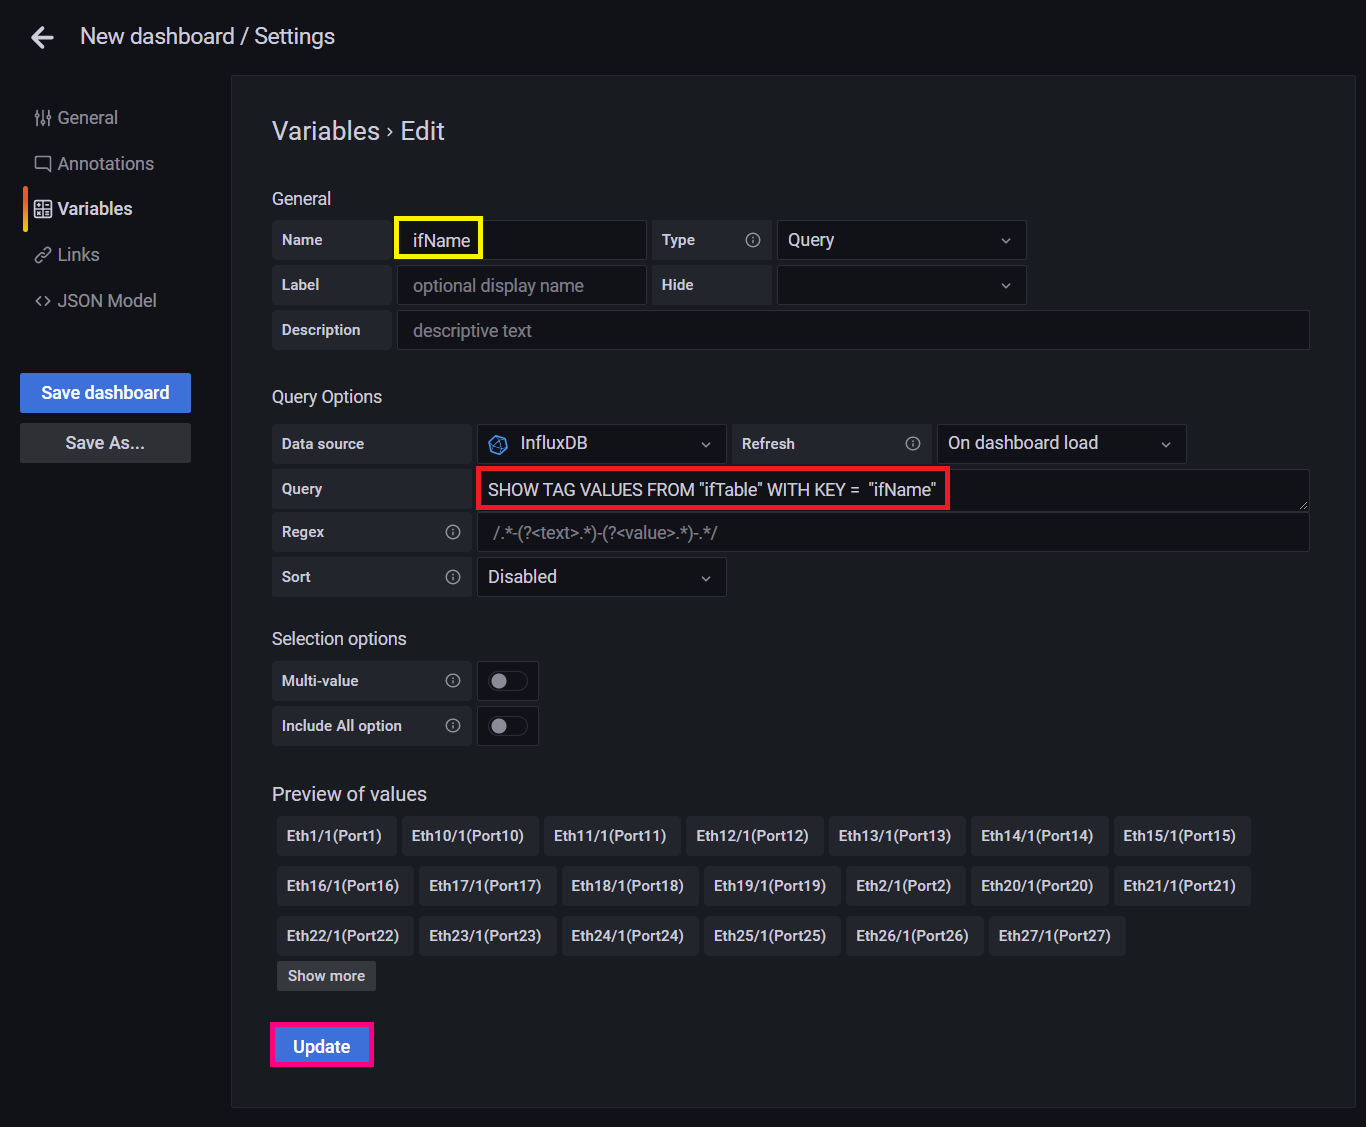
Figure 7: Variable creation screen
After completing the settings, when you return to the dashboard screen, variables will be added in the pull-down menu format as shown below. This variable can be set in each panel's query. The above is an introduction to the dashboard creation procedure for visualizing network operations with Grafana. The change in the panel due to variable filtering is posted in the 9th article, so please take a look.
At the end
Macnica offers a service that provides a remote environment where you can actually experience open networking and perform testing and verification. This service allows you to verify the operability of the network OS and test a combination of network OSs, white Box switches, and optical transceivers from various manufacturers.
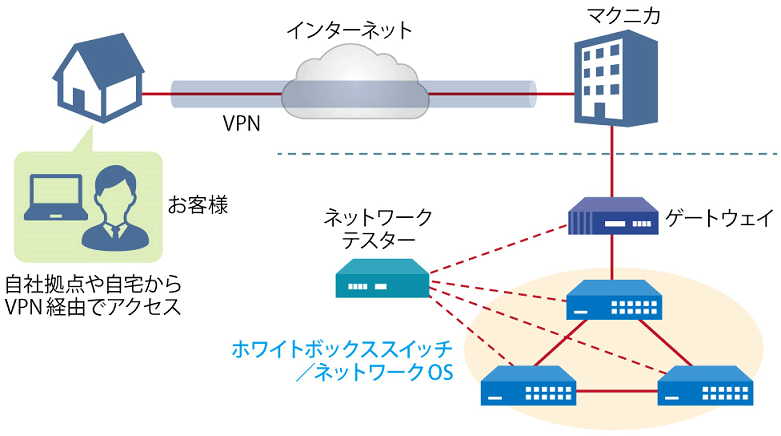
Remote verification service image diagram
It is a service that allows you to easily test open networking, and the basic configuration is free of charge.
You can check the downloadable materials for available network OS and white Box switches, specific use cases, and how to apply. The materials can be downloaded from the URL listed in the information email by answering the questionnaire from the "Macnica Network OS Remote Verification Service" below.
These people are using the remote verification service.

Here are some testimonials from people who have actually used the service.
Furukawa Network Solution Co., Ltd.
“Recently, the number of remote service environments is increasing, but I was impressed with the ease of access to the evaluation equipment.
The materials you provided were easy to understand, and we were able to proceed smoothly with the intended verification. ”
Related information
![[Part 9] SNMP visualization of white Box switches using SONiC - Grafana x InfluxDB - Thumbnail image](/business/network/columns/84d7a7525020782725001d27311eddde_1.png)
![[10th] Thumbnail image of SNMP data visualization method using OSS ~Grafana x OcNOS~](/business/network/columns/2d131c51f152619d14c0af446a1ddc71_1.png)
![[Part 12] Thumbnail image of network visualization of white Box switches using SolarWinds](/business/network/columns/2de63c6f822a4f2a5ee40e1b4037719f.png)
Click here for list of materials

In addition to introducing products handled by Macnica,
We publish materials related to open networking, such as BGP cross network automatic construction files and network operation test evaluation reports.
Click here for details
Product Page Top
Edgecore Networks
We continue to be a pioneer in open networking by developing and selling products related to OpenNetworking/white Box switches.

Aviz Networks
We are pioneers of SONiC, an open source network operating system, providing observability, configuration automation tools and support from a team of SONiC experts.

IP Infusion
As a market leader among open networking providers, we provide reliable network solutions to over 600 customers, including carriers, service providers, and data centers.
Inquiry
If you have any questions regarding this article, please contact us below.
Macnica
In charge of OpenNetwork
Contact us by phone:
045-470-9831
Email us:
projectmonstar@macnica.co.jp