We will deliver the importance of "visualization of business processes", which we would like to work on as the first step to promote DX, in two parts, the first part and the second part.
This article in the second part is mainly about understanding the current situation, which is an important step in the DX project.
How to correctly recognize "As-Is"
1. data driven thinking
In order to correctly recognize "As-Is", it is important to visualize business processes based on quantitative data. By visualizing the current situation based on data, data-driven thinking that leads to subsequent measures becomes extremely important. For example, in the case of sales, there are quite a few companies that set KPIs according to business processes, such as the number of business negotiations, leads, and estimates, and visualize them using Excel or BI tools. , why the KPI is set to that number, and how to improve this KPI, there are many cases that rely on experience and intuition.
The KPIs that are currently set are actually a part of the business process. and put the KPI in it
Finding insights to improve is key.
2. Find hidden insights in your processes
For example, if shortening the time it takes to submit a quote is a major factor in advancing business negotiations, you will need to accurately grasp the time stamp for each process and take steps to shorten it.
In general, submission of an estimate involves processes such as confirming the delivery date with the manufacturing department and approving the price with the superior, and communicating with the superior and other departments using various solutions such as email, SFA, and groupware. should be trying to By properly visualizing who is doing what process, including information gathering and approval work for creating quotations, you will be able to improve the time to submit quotations, which is the final KPI.
In order to find new insights that have not been felt as an issue until now, we should start by visualizing the business process, and that visualization is the first step to a successful DX conversion.
The first step in how to proceed with a DX project is from "understanding the process"
Analog visualization is also necessary
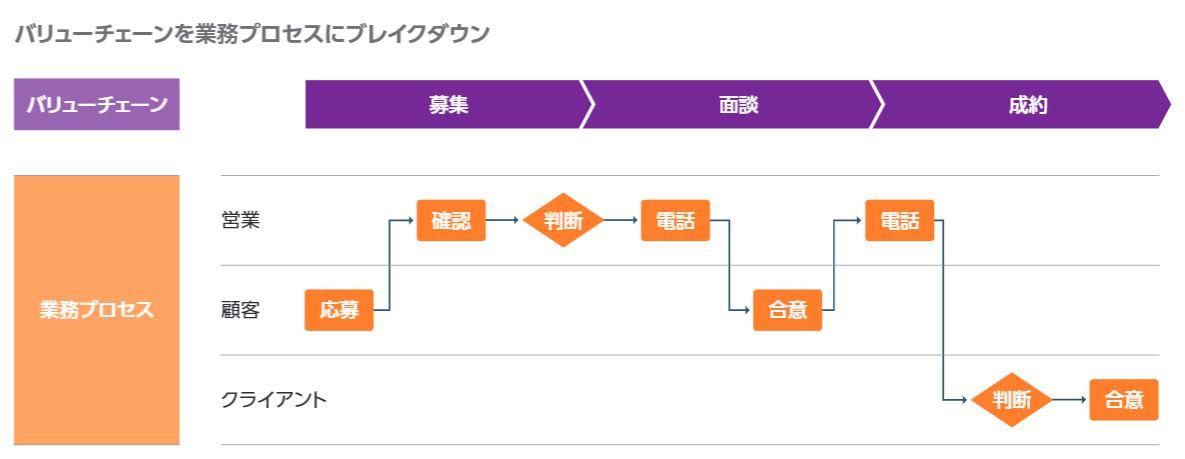
I mentioned the importance of data-driven thinking, but first of all, it is important to take a firm look at the value chain and business processes using an analog method. In many companies, it seems that the process is put into business procedure manuals, etc., or the business process is procedureized in the head based on the experience accumulated on a daily basis. First, let's start by dropping these into common systemized information.
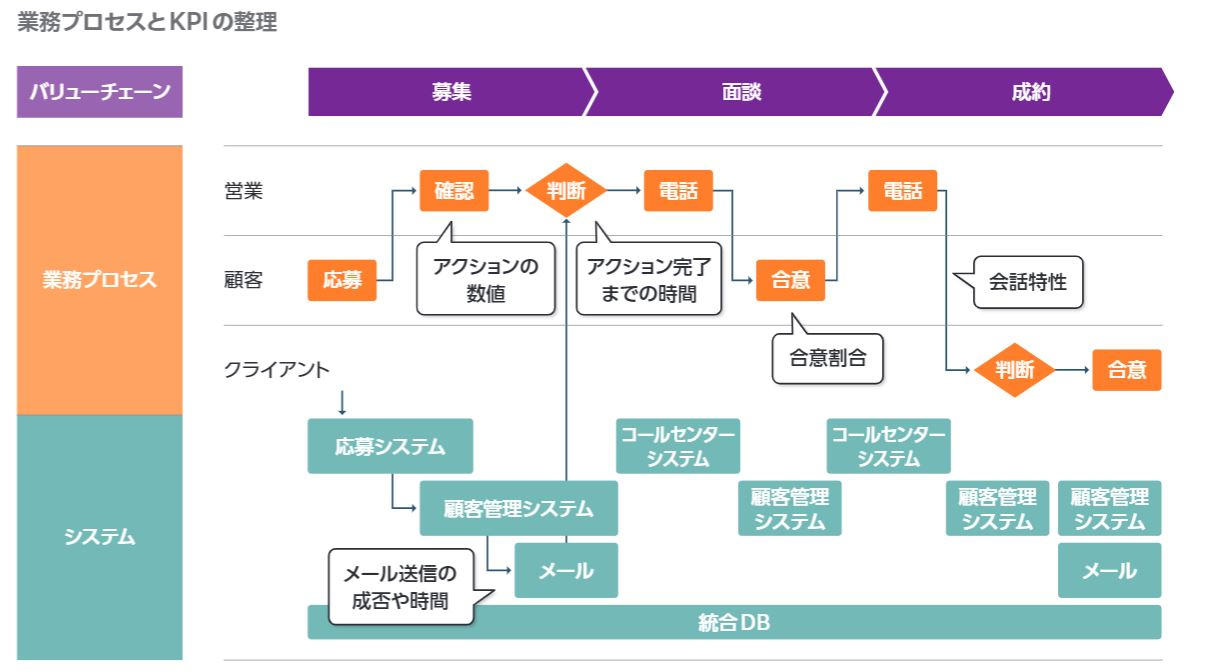
Specifically, after conducting interviews with the people involved in the business, we decided to use UML and other business process modeling methods to create diagrams and visualize who is involved in which process. Become. For this visualized business process, there are many cases where systems are used for each task. If you map and organize the systems you are using against this diagram, you will be able to see what data can be acquired from which system.
At this point, not only does it become clear from which system the numbers set as KPIs for each process should be obtained, but it is also possible to determine the time required to complete the work from the time stamps of each system. This makes it easier to visualize measures and improvement measures for achieving KPIs as hypotheses. Based on the information obtained, KPIs will be set again, and the PDCA cycle will be implemented while monitoring them, leading to improvement processes. By doing so, it will be possible to promote measures that lead to cost reduction by maximizing sales and improving operational efficiency, which was the purpose of DX conversion.
Visualize tacit knowledge
However, it cannot be said that the "As-Is" can be fully grasped only by the visualization of the process described above. This is because it does not include information that has been treated as tacit knowledge, such as communication that occurs in the process and success stories in each process.
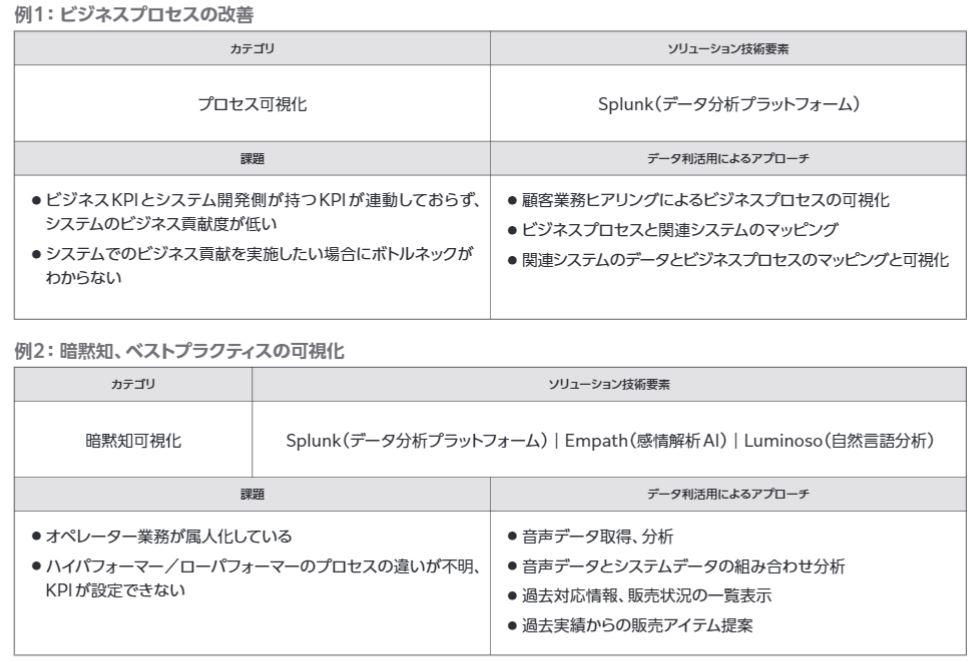
If we can visualize tacit knowledge, which has not been the subject of analysis until now, as data, we will be able to obtain new ideas. For example, in order to solve the problem of not being able to use customer voices in a timely manner due to slow deployment from call center support to other departments such as sales, we collect voice data of operators and customers, analyze emotions, and convert it into text. Then, we will carry out natural language analysis. By visualizing not only the content, but also what kind of words and emotions customers with a high sense of warmth are using in their conversations, and the trends in words and emotions uttered by operators with high customer satisfaction, as data, it is truly DX. It will be possible to formulate concrete measures for achieving this.
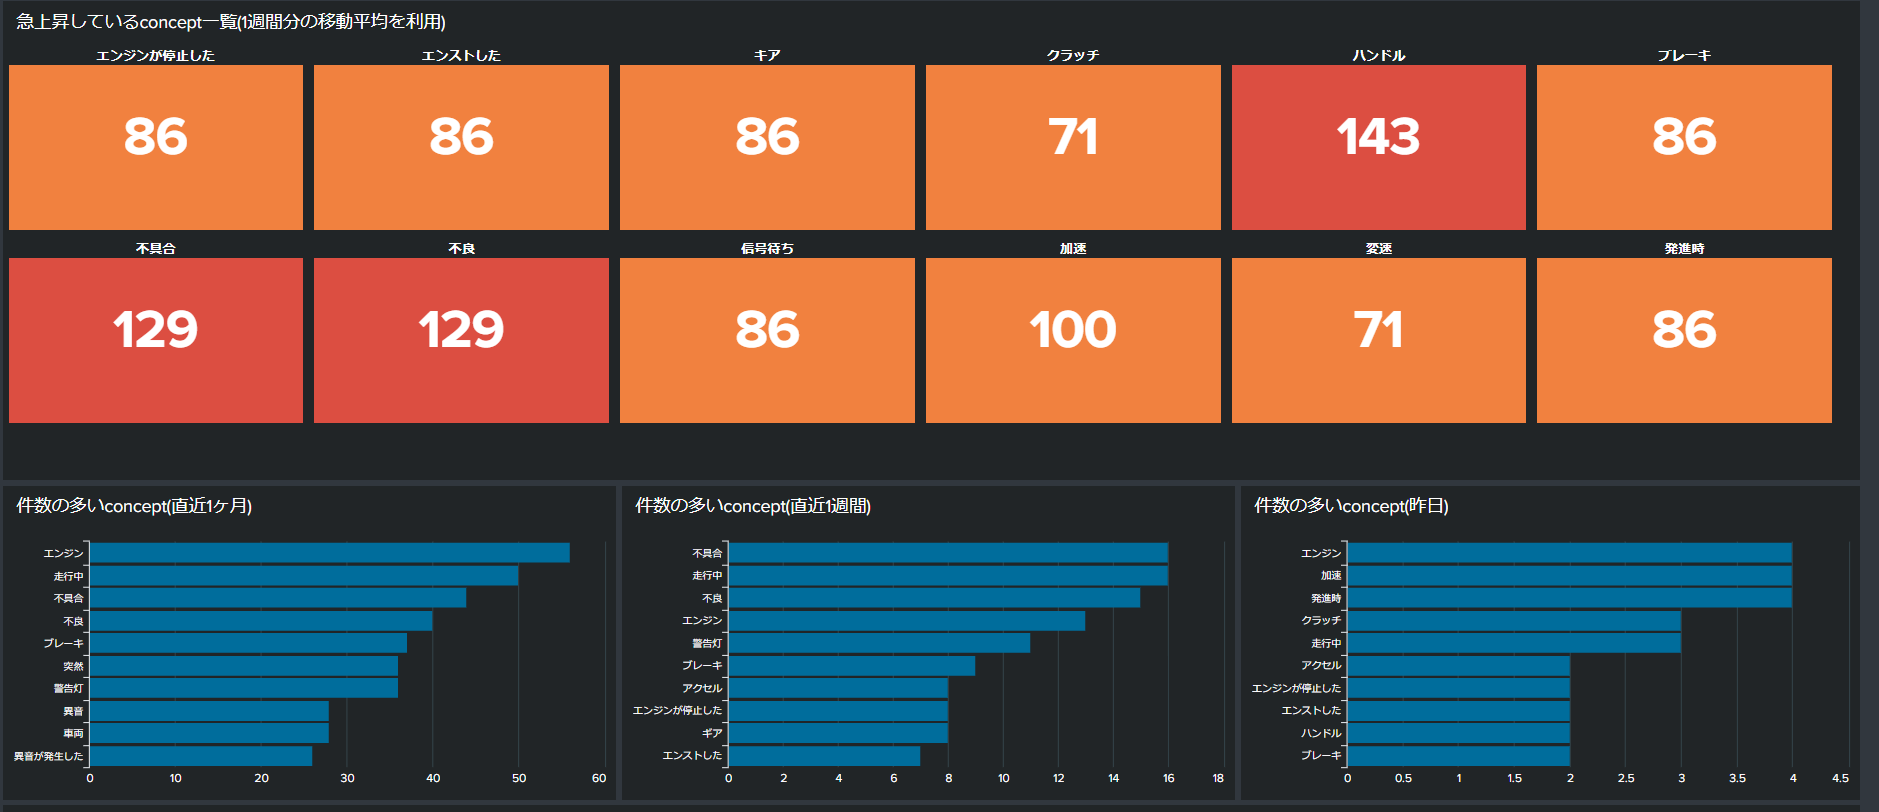
What is important here is to make improvements through process visualization and rapid PDCA, based on hypotheses that lead to improvements. This is where an integrated log platform that can analyze and visualize the logs of each system in a correlated manner becomes effective, and Splunk is the most convenient to use. Splunk, an integrated log management platform, is a solution that has strengths in big data analytics and more. It is used as a SIEM that quickly responds to security incidents by collecting and managing logs from various security-related sensors, including operation monitoring using system logs.
A feature of Splunk is that it can import data without defining a schema in advance, including structured and unstructured data, and it is possible to correlate and analyze multiple logs based on unique keys. . In addition, since it has a structure that can process a large amount of logs quickly, it will be possible to quickly analyze a large amount of logs across multiple systems.
The charm of Splunk that can capture all kinds of data
1. No data preprocessing required
The biggest attraction of Splunk for process visualization is that even if the data required for monitoring is of poor quality, it can be incorporated into the system without worrying about the format. Once you have your data in Splunk, you can improve its quality by giving it a strong meaning.
With general log management products, data cannot be imported unless it is converted into a structure suitable for the product, and preprocessing such as data processing and conversion requires a lot of time. In some cases, it may be necessary to modify the application itself, which is the source of the data to be acquired, so there may be issues in terms of cost. Originally, it would be necessary to run a quick PDCA cycle to verify hypotheses, but it would be difficult to run the PDCA cycle effectively and effectively because the preprocessing would just take extra time and effort. In that respect, Splunk makes it possible to analyze immediately without the hassle of preprocessing.
2. easy-to-understand dashboard
Another important point is whether or not it can be converted into a dashboard in a form that can be understood by human eyes. In the case of normal log management products, it is necessary to perform preprocessing such as converting IP address information into names in another system such as Excel and then importing it so that it is possible to find out who did the work. With Splunk, you can easily output information that can be seen by the human eye just by looking up the conversion table. It can be said that Splunk's unique appeal is that it can import data without preprocessing.
3. Good at unstructured data
In addition, there are many cases where insights are hidden in unstructured data such as access logs and natural language, and Splunk's advantage is that it can effectively utilize data that cannot be structured by RDB.
DX support solutions provided by Macnica networks
Splunk can aggregate the information collected from each system, assign meaning to it, and create a dashboard. There are quite a few situations where it becomes. Splunk has also taken into consideration such external cooperation, and it is easy to make full use of the latest technology. There is also an increasing number of ways to use Splunk again as a dashboard to display the results after collecting information on each process with Splunk and analyzing it with other tools. However, know-how and experience are required to cooperate with external services and select the analysis method suitable for your company.
At Macnica networks, we not only have a wealth of examples as a partner of Splunk, but also collaborate with various third-party tools to identify your company's issues, select the optimal method, and create samples using Splunk etc. We will work together with you to ensure the success of your DX project, including building a system that involves the organization, and supporting PDCA for improvements.
In actual use cases, we support DX in contact centers by linking Empath's emotional analysis AI and Luminoso's natural language analysis AI with Splunk, and utilize image analysis technology called Deep Vision AI. By flexibly combining various technologies, such as behavioral analysis based on location information, we can support your company in achieving its desired DX success.
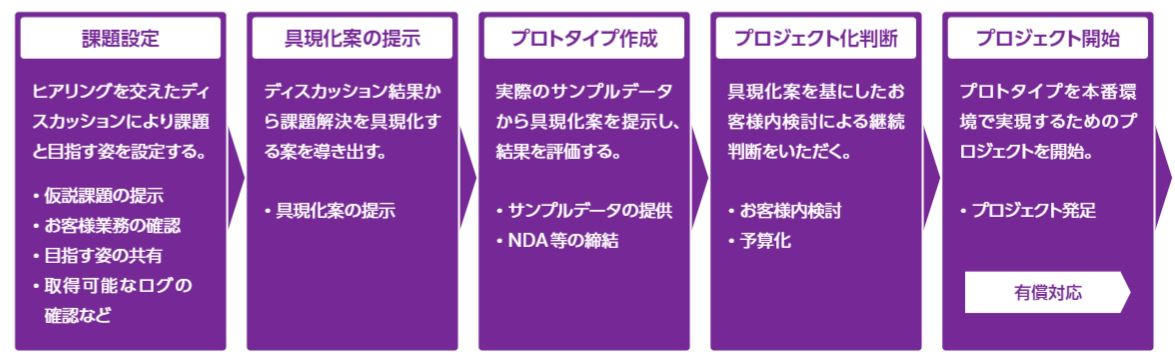
At Macnica networks, we set issues to promote DX and present concrete measures, and at the stage of creating a prototype, we judge based on hypotheses whether the project will produce results or whether it should be turned into a project in the first place. . We have a system in place to support the "first step of DX conversion" up to the start of a project with a sense of speed.
Please feel free to contact us.
The content introduced in this article can also be read in full in the white paper.
We also have various on-demand videos, so please take a look if you are interested.
[On-demand video]