Application for evaluation machine
The secret of Koga's concentration revealed by measuring his brainwaves, heart rate and acceleration during the NASCAR race!

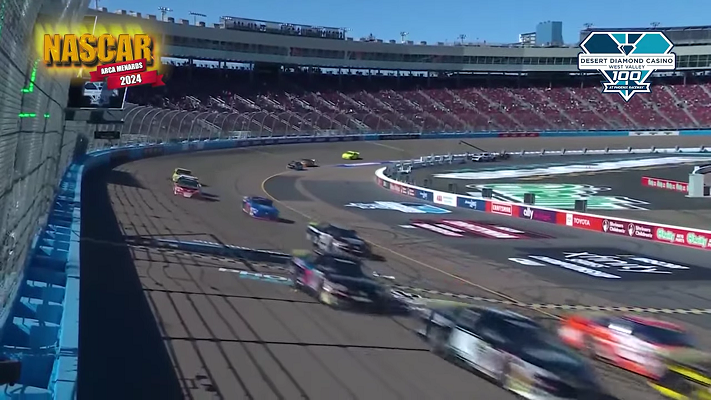
On November 8, 2024, at the NASCAR Arca Menards West held in Phoenix, Arizona, USA, Koga's brainwaves were measured during the race, revealing his incredible concentration and how it changed. In addition to brainwaves, acceleration and heart rate were also measured this time to investigate the load on the body and its impact.
EEG measurement results (overall)
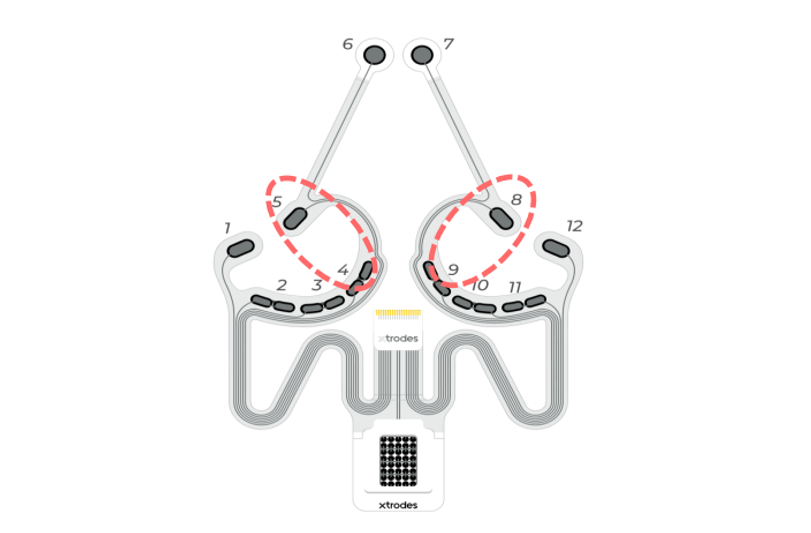
In this race, just like the previous Sonoma race, a sticker-type electroencephalograph was used to score Koga's concentration from his brainwaves during the race. The following results were confirmed after comparing the race events with Koga's memories.
Conclusion
We were able to confirm that numbers 1 and 2 were the same as the previous Sonoma race, while number 3 was a new measurement result.
1. Maintaining concentration when driving at high speeds We confirmed a tendency to maintain high levels of concentration when completing laps at high speeds.
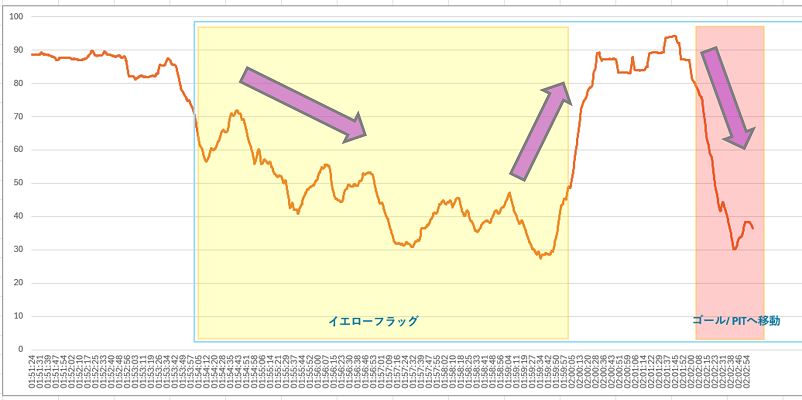
2. Loss of concentration during yellow flags
There was a tendency for concentration to decrease when the yellow flag was issued, and increase when the race was restarted after the yellow flag was lifted.
3. Brain activation immediately after turn 4
It was confirmed that the left hemisphere of the brain was activated when exiting Turn 4, improving the driver's ability to make situational judgments and avoid danger.
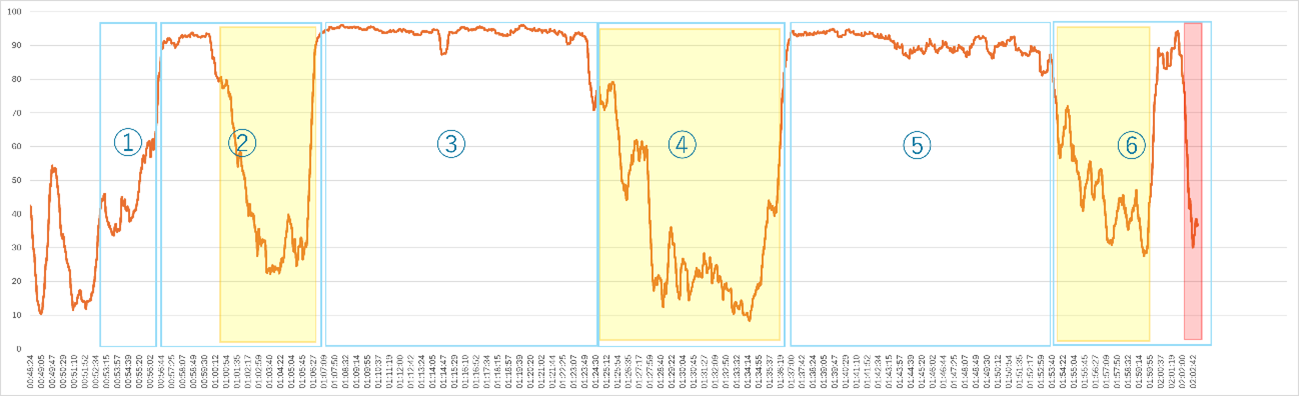
Below are details on each point ①~⑥
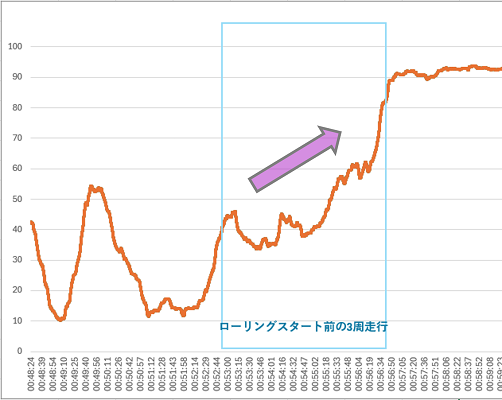
①Before the rolling start (11:41-11:44)
As the car took to the track and completed the three laps before the first rolling start, Koga's concentration was seen gradually increasing.
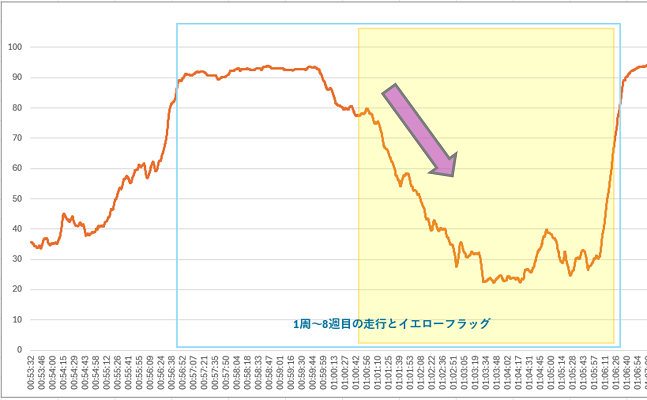
②First yellow flag (11:48-11:54)
The first 8 laps went smoothly, but #71 spun around turn 1 and the left rear tire burst, bringing out the yellow flag. At this point, we can see that Koga's concentration was dropping.
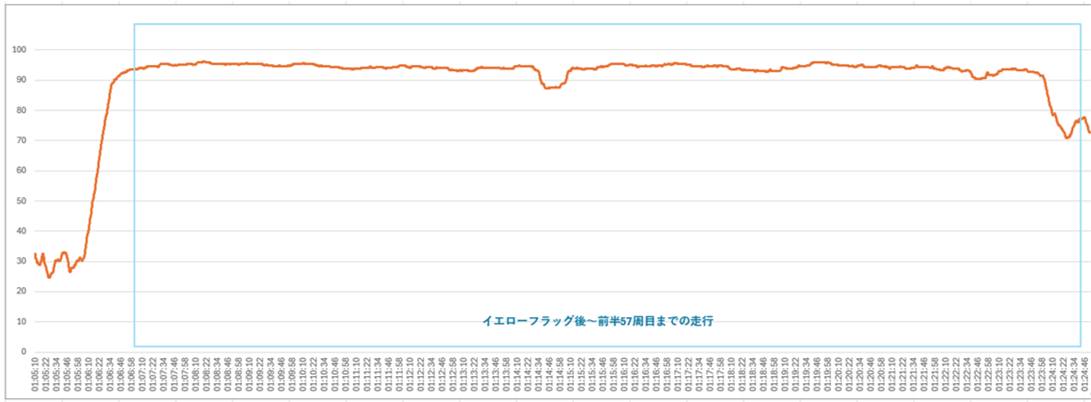
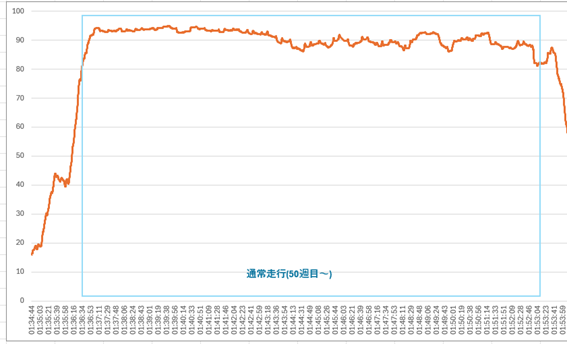
3) Normal driving (11:54-12:12)
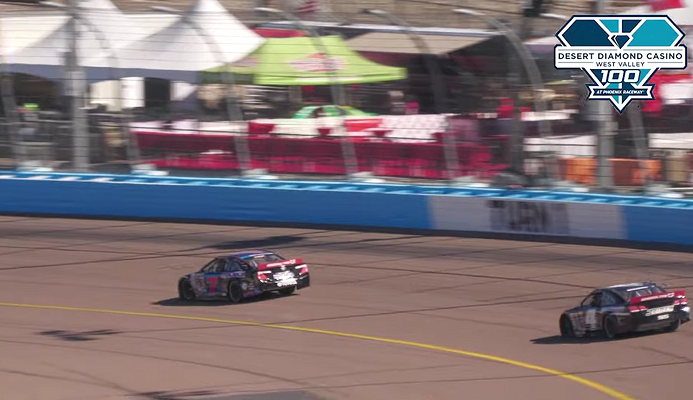
After the yellow flag was lifted, he maintained a high level of concentration while driving at high speeds (approximately 300km/h), and recorded the highest score of the day, 96, on the 18th lap.
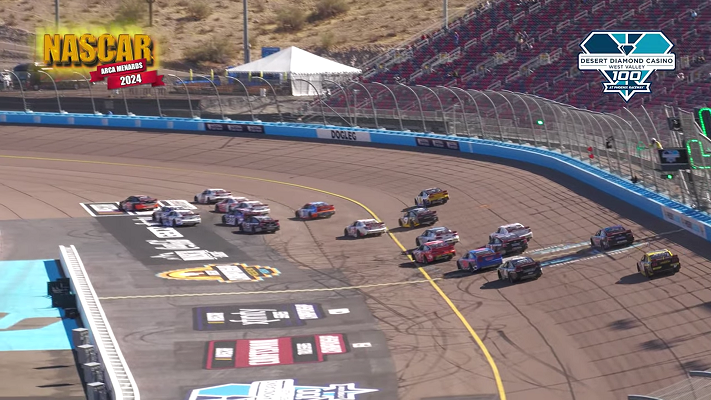
④Second yellow flag and pit stop (12:12-12:24)
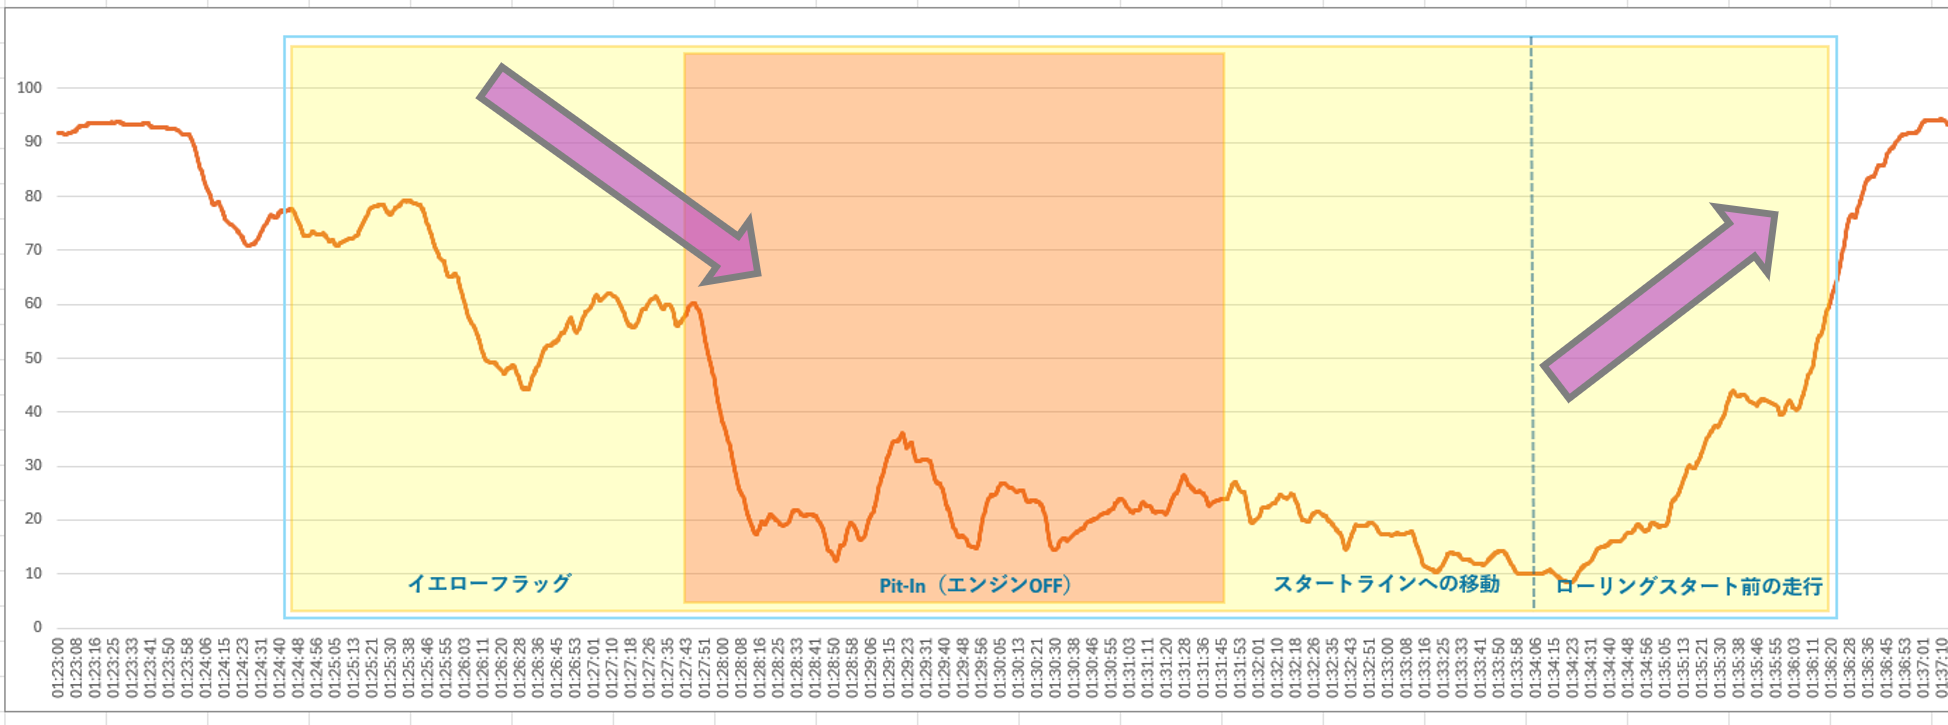
After 50 laps, the yellow flag came out and the team's concentration continued to drop until they entered the pits. After a five-minute break in the pits, the team returned to the track, showing signs of improving their concentration and preparation.
⑤50th to 92nd laps (12:24-12:41)
Although there were some small lapses in concentration in the last 50 laps, Koga said he "took a risk and drove at full speed," and it is possible that the strain on his entire body was an contributing factor.
⑥Final yellow flag to goal (12:41-12:50)
The yellow flag was raised on lap 92. During the six-minute break, my concentration dropped from 70 to 30, but then it returned to a high level again during the final eight laps, and I was able to finish safely.
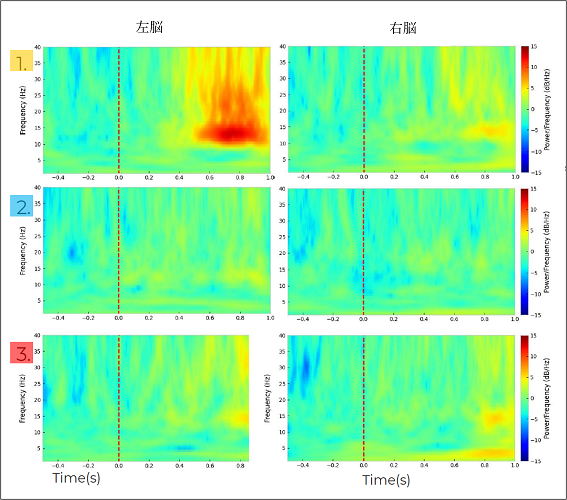
Investigating brain activity in each section
As a new initiative, we attempted to capture the characteristics of brain responses for each corner, and found that brain waves in the left hemisphere were highly activated in the alpha and beta bands around the time of exiting TURN4. A previous paper * suggests that activation of these areas indicates the exertion of sensory-motor control and concentration control, and we can surmise that this is a state in which situational judgment and danger avoidance abilities are improved, in other words, the functions that support safe and efficient driving operations are most active immediately after TURN4.
*References
1. Toshihito Ikenishi (Tokyo University of Agriculture and Technology, Graduate School of Engineering) (March 2014)
"A study on estimating the driver's intentions using electroencephalogram analysis and brain current source estimation method when the driver is operating the vehicle ahead," Doctoral dissertation, Graduate School of Engineering, Tokyo University of Agriculture and Technology
https://core.ac.uk/download/pdf/236111607.pdf
2. Haranaka, Y., Ishiai, Y., and Kurihara, R. (March 2010)
"An example of brainwave activity in the prefrontal cortex while driving on a circuit."
https://www.jstage.jst.go.jp/article/jsaeronbun/41/2/41_2_551/_pdf/-char/ja
Supplementary Note: 1. Mechanical Analysis
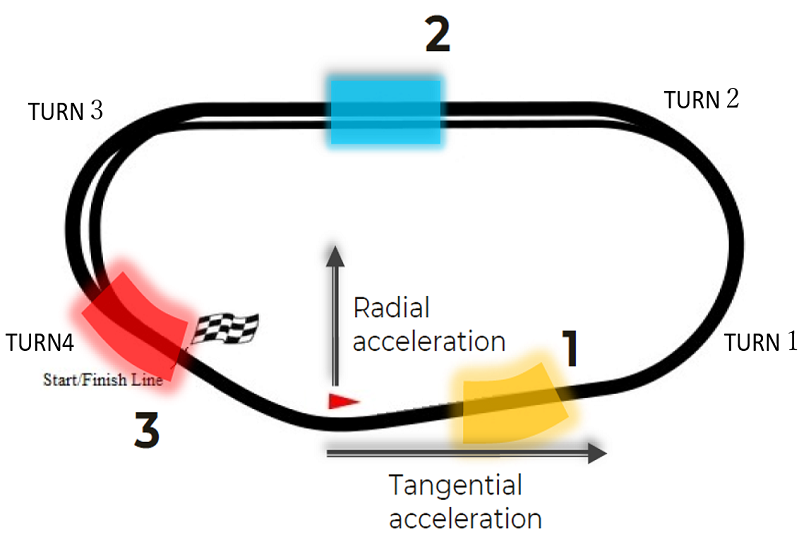
As one method of analyzing the dynamics of Koga's vehicle movement and the strain on his body, we attempted to measure tangential acceleration (Tangential Acceleration/[g]) and radial acceleration (Radial Acceleration/[g]) using an IMU (Inertial Measurement Unit) attached to an EEG recorder.
*Tangential acceleration represents the change in speed, while radial acceleration represents the change in direction of travel.
The measurement results showed that section A, which corresponds to TURN 3 to TURN 4, showed the greatest change in radial acceleration, indicating that this is where the load on the body is the highest.
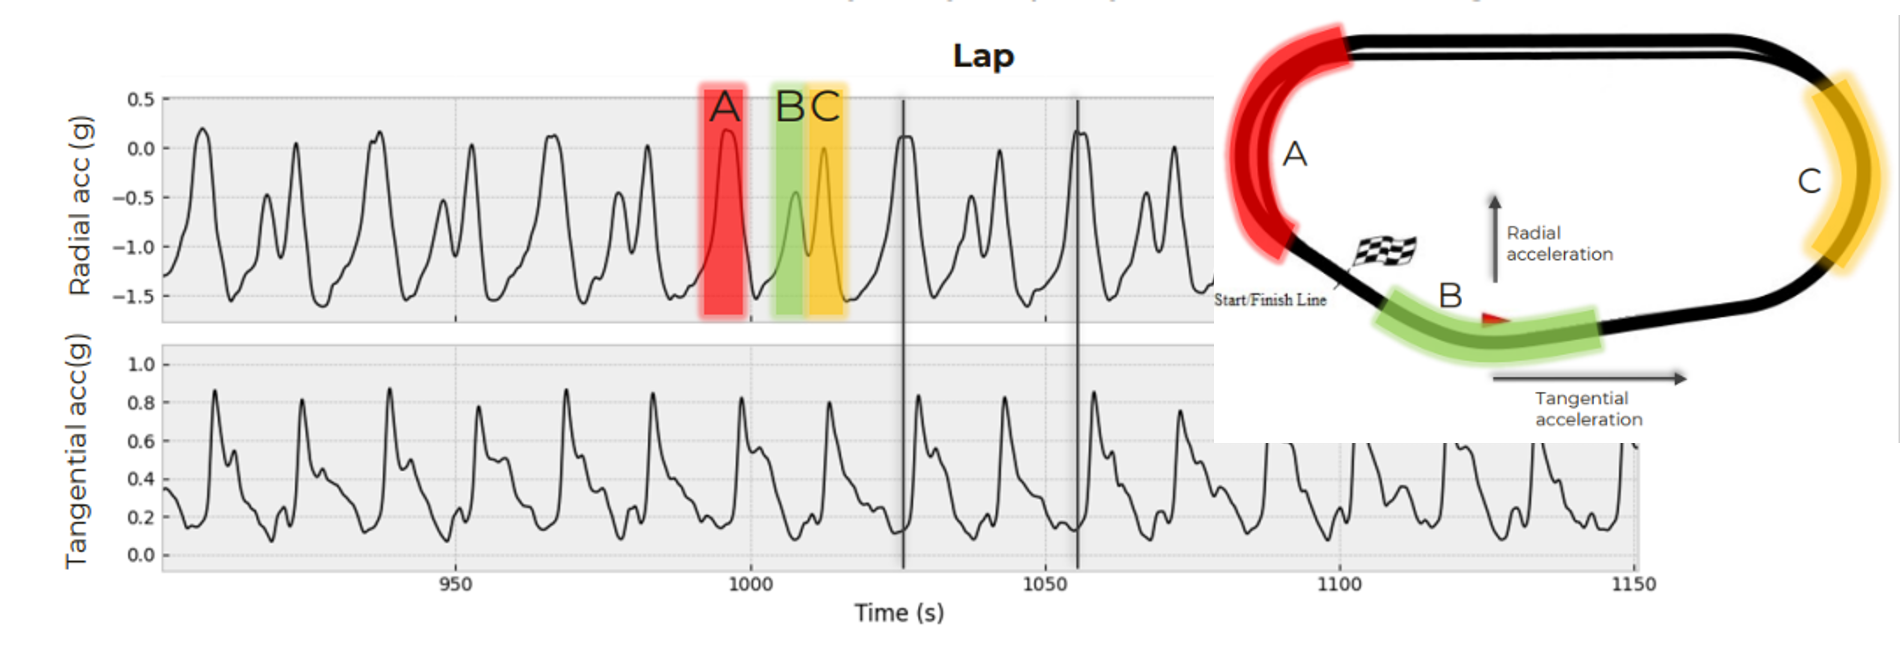
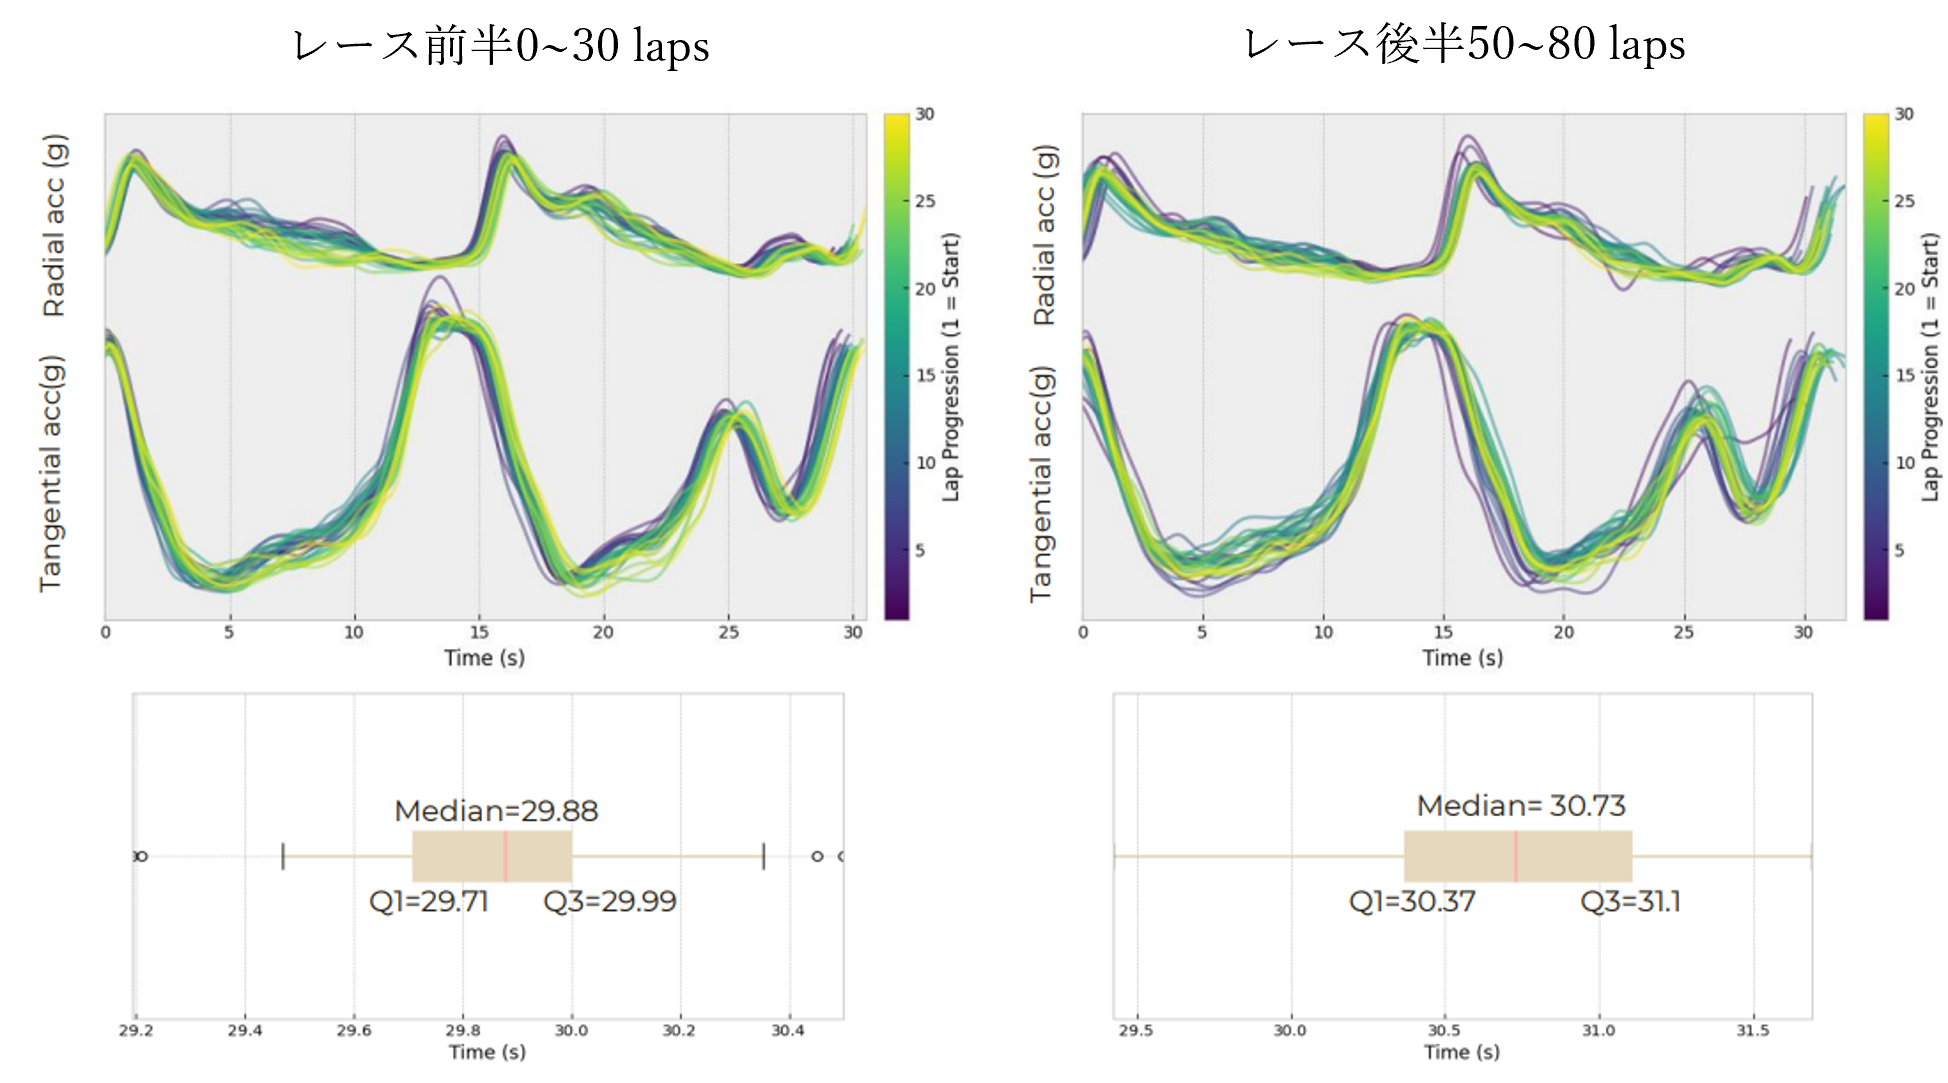
Furthermore, by analyzing the values for each lap, we were able to measure how Koga's driving had changed. In particular, in a review immediately after the race, Koga said, "On the 51st lap, my brakes locked and I started to slip, which was frightening." This was also captured in the acceleration data, suggesting that this measurement method may be effective in detecting specific events.
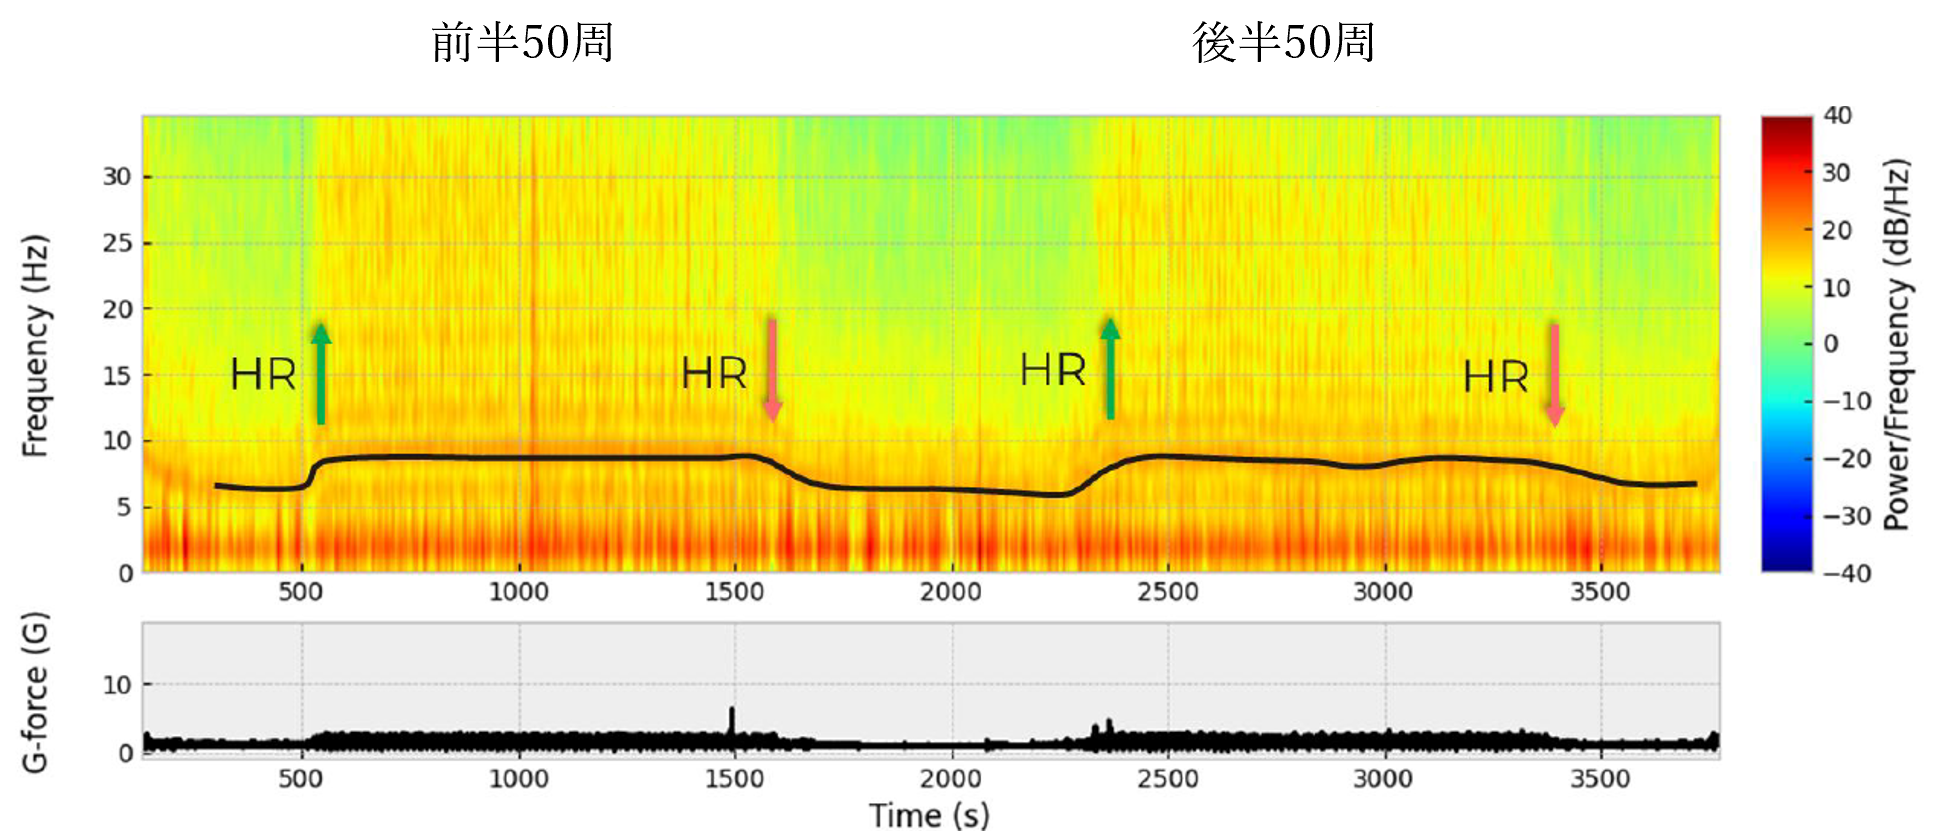
Supplementary Note 2: Heart rate measurement
When we compared heart rate [dB/Hz] and gravitational acceleration [g] during the race, we found that heart rate was high during the race, when the body is under a lot of strain, while heart rate variability was low during the breaks.
Anticipation for future mobility
Following the last SONOMA, we measured Koga's brainwaves during a NASCAR race and were able to obtain more data than we expected. The results of this measurement not only provide insight into the individual driver's abilities, but also have the potential to contribute to future vehicle designs that pursue safety and efficiency.
We plan to continue collaborating with Koga to advance technological development that utilizes brainwave data.
Comment from Koga
This time, while the other drivers' engines were equipped with injectors, Koga's car was the only one equipped with a carburetor, and it was a frustrating race as he was left behind on the straights after the corners.
Summary
Macnica will continue to sponsor NASCAR driver Takuma Koga in 2025, as it did last year.
We plan to use what we learn from measuring EEG during the two main races in 2024 to continue collecting and analyzing further data in 2025.
Related information
A first in NASCAR history! Brainwave measurements during a race!? -Details of measurement data-
A first in NASCAR history! Brainwave measurements during a race! ~A big investigation into what happens to professional racers' brainwaves during the race~
Takuma Koga announces his participation in the 2025 NASCAR season
free demonstration
What is "objective content evaluation" based on brain waves?
I would like to visualize people's unconscious emotions and cognitive states based on brain waves.
I'm sure there are many things you don't know, so why not measure your brain waves and experience what it's like?
After the actual measurements, we will share examples of how AI has been used in our activities so far, so that we can better utilize AI using brain waves at our customers' sites.
We will support you from proposal to implementation and operation.
Document download
We have information related to Brain Tech, such as catalogs and white papers, so if you would like to know more, please download the materials here.
Inquiry
If you have any questions regarding this article, please contact us below.
 Latest Information
 Case Study
 Blog
Blog Document List