

Hello, this is Ikeda from Macnica. My job is usually to use data to solve problems.
This time, Solving Macnica 's internal staffing issues Use of mathematical optimization developed for Web app We will introduce the prototype.
When trying to solve a real-world problem with mathematical optimization, even if you talk to people in the field beforehand to determine the optimization conditions, you will find that the conditions need to be changed or added each time you talk. I tended to lose it.
Therefore, the project early at the timing practically available on site And, Detailed settings are Field personnel only can be changed from the screen for web apps like prototype for optimization by making really necessary conditions I decided to find out.
The source code is published on GitHub, so if you are interested, please try it yourself.
table of contents
- Why did you need a staffing web app?
- Web application function introduction
- System configuration for internal use
- About development
- At the end
series articles
- Staffing DX ~Part 1~: DX of staffing starting with Python and mathematical optimization
- Staffing DX ~Part 2~: ?This article
- Staffing DX ~Part 3~: How to proceed with a staffing DX project and communication with on-site personnel
1. Why did you need a staffing web app?
In a certain back-office department within Macnica, there was an imbalance in working hours for clerical work.
We decided to use mathematical optimization technology to change the allocation of personnel from fully manual operations based on intuition and experience to partially automated operations based on logic.
For the theory and implementation of the mathematical optimization itself dealt with here, please refer to the previous article DX of staffing starting with Python and mathematical optimization.
It is difficult to accept the results of mathematical optimization as they are and fully automate staffing, and we found that it is necessary to make fine adjustments according to the situation at that time.
Therefore, we decided to develop a web application that can easily change the placement conditions from the screen.
2. Web application function introduction
The role of this web application is to output the optimal staffing table by inputting information about employees and duties.
First of all, I will introduce the operation of the web application with a video.
In the following, I will explain using the screenshots in the video.
* All information such as personal names and business names that appear in blog articles and videos are samples for explanation.
Video part 1
Video Part 2 (continued)
"Twemoji" © Twitter (Licensed under CC BY 4.0)
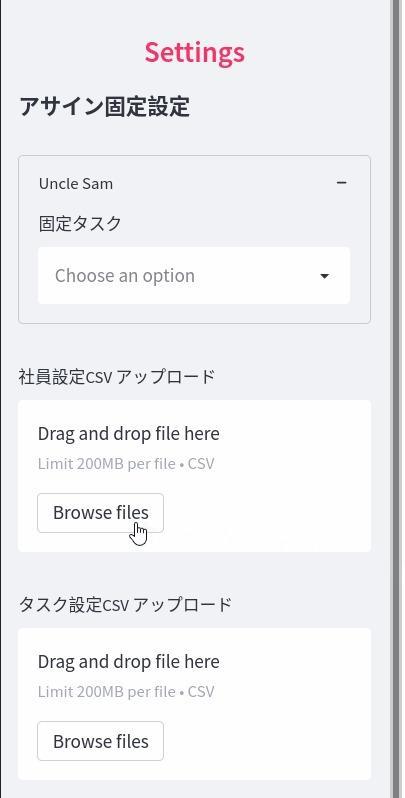
Loading a setting CSV file
Upload the following two types of CSV files for settings from the web screen.
- A CSV file containing employees' available working hours
- A CSV file containing the default values for the time and number of people required for the work (task) to be assigned
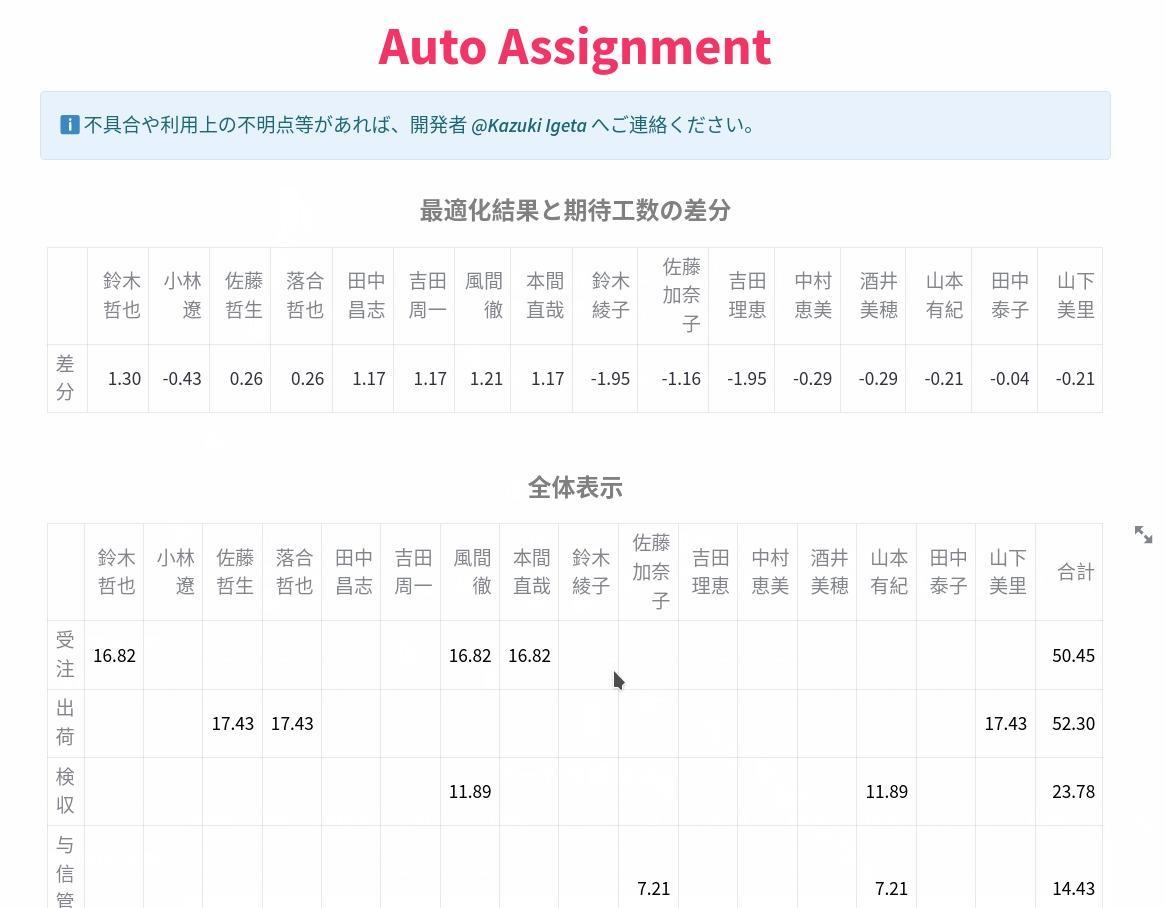
Based on the uploaded settings, a mathematically optimized staffing table will be displayed.
The difference between each employee's workable hours (expected man-hours) and assigned work (task) amount is first displayed at the top.
Below that is What and how much was allocated to whom indicates Placement table is output.
"Twemoji" © Twitter (Licensed under CC BY 4.0)
Partially fixed staffing
It is not realistic to reassign all employees in the relevant department at the same time due to the handover of duties.
Some employees need to have existing jobs fixed, or new jobs they want certain employees to experience.
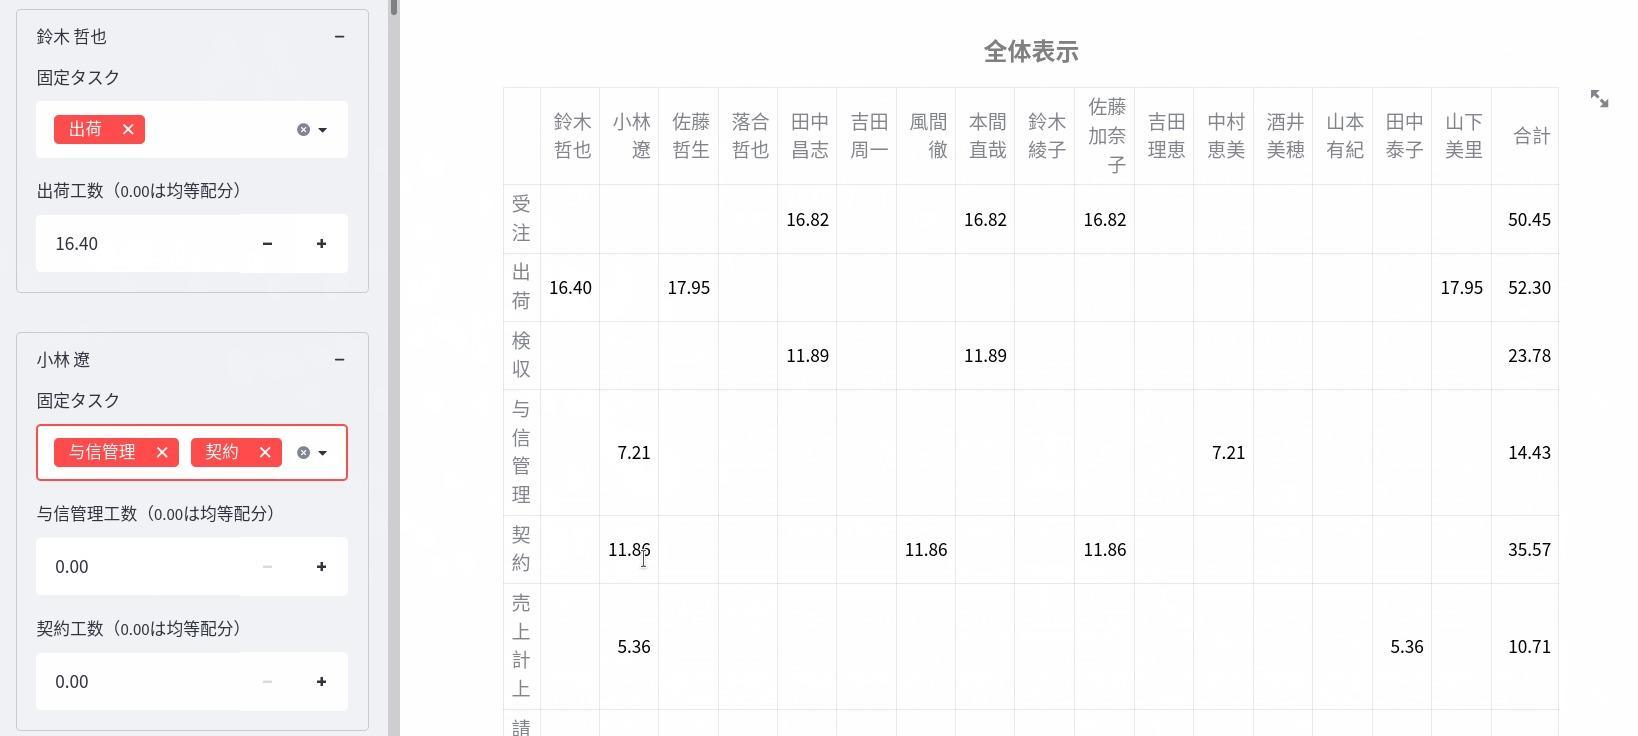
Therefore, by changing the settings from the sidebar on the left side of the web application screen, we made it possible to fix the work for each employee.
The working hours assigned to fixed tasks are automatically determined, but it is also possible to assign arbitrary working hours from the sidebar.
In the image below, the sidebar is configured to assign Tetsuya Suzuki a fixed 16.40 hour allocation for shipping and Ryo Kobayashi for credit management and contracts. The optimized placement table shown on the right side of the image reflects the setting changes.
By using this sidebar, we made it possible for employeesto think about placementwhile changing various conditions for optimizing staff placement at the site.
As a result, we were able to mitigate the following problems mentioned at the beginning.
Even if we tried to decide the optimization conditions by talking to the people in the field in advance, we tended to find that the conditions needed to be changed or added each time we spoke.
3. System configuration for internal use
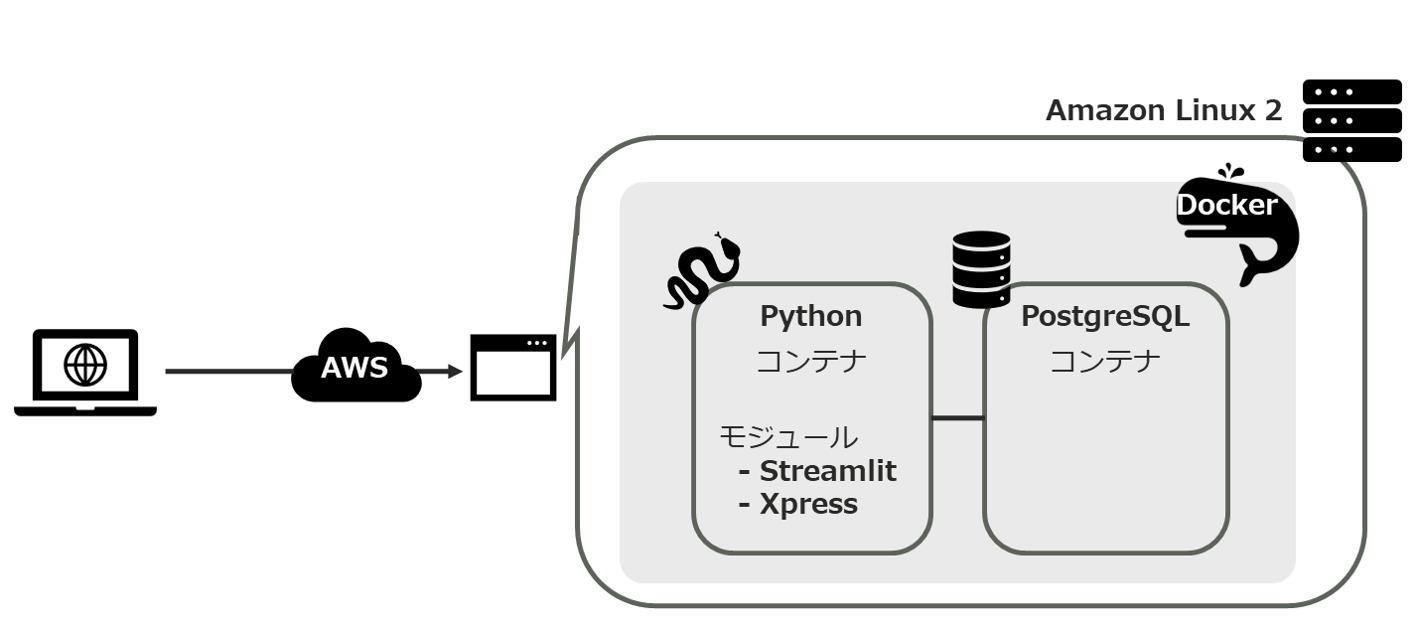
I wanted to develop a prototype quickly, so this time I used Streamlit and Docker for the following two purposes.
- Streamlit: Aim to draw interactive web UI easily with short code
- Docker: The purpose of easily porting the application developed in the local environment to the remote
Streamlit is one of the popular libraries for prototyping data science projects in the last few years.
The web application developed as a prototype is built on an instance on AWS as shown in the image below.
4. Development
Source code
The source code of this prototype web application is available on GitHub, although there are some differences from the one used internally.
https://github.com/kazukiigeta/assigner
*The above repository is the poster's personal repository, and Macnica is not responsible for it in any way.
Development flow
This prototype was developed while rotating the flow of 1 to 4 below.
- Develop locally with Docker
- Push source code from local to GitHub
- Clone the source code from GitHub on your server
- Deploy the app using Docker
Personally, I can comfortably proceed with development locally, and when porting to a server, I can prevent certain things such as "Well, it worked locally, but why doesn't it work on the server...?" I chose this flow because it is a simple method.
I didn't do it this time, but I think you can use CI/CD such as Github Actions to automatically deploy to the server when source code changes are merged into the main branch.
Using Docker
We prepared one container each for Python + Streamlit and PostgreSQL, and configured a total of two containers to build the application with docker-compose.
| container | explanation |
| Python + Streamlit |
|
| PostgreSQL |
|
Web application development using Python + Streamlit
In Streamlit, you can easily implement widgets such as file upload function and slide bar, just like you implemented in the setting change sidebar.
In addition, pandas.DataFrame of You can draw a table as it is with a single line of code Therefore, it was very easy to draw the staffing optimization results this time.
However, there was a problem with drawing pandas.DataFrame, so I decided to draw the same pandas.DataFrame with the following two functions.
streamlit.dataframe()streamlit.table()
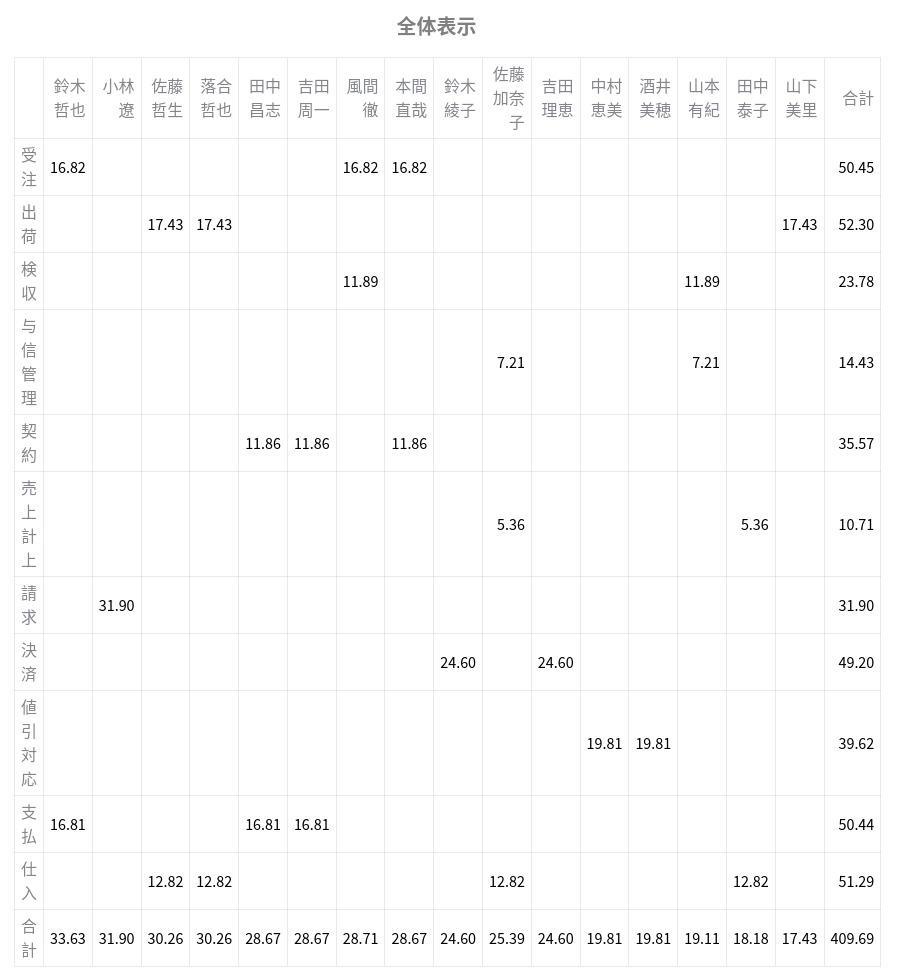
1. With streamlit.table()
When pandas.DataFrame is drawn with streamlit.table(), rows and columns are displayed on the screen without being omitted (of course, if it is a large table, the screen size required to display it without being cut off will be larger. increase).
However, I cannot sort by clicking on the column name.
2. When using streamlit.dataframe()
When drawing pandas.DataFrame with streamlit.dataframe(), if the number of rows or columns is large, the display will be cut off like the screen below. The values in the table are also abbreviated as "...".
If you click the enlargement button that appears when you hover the mouse over the table, it is possible to perform full-screen display without omission.
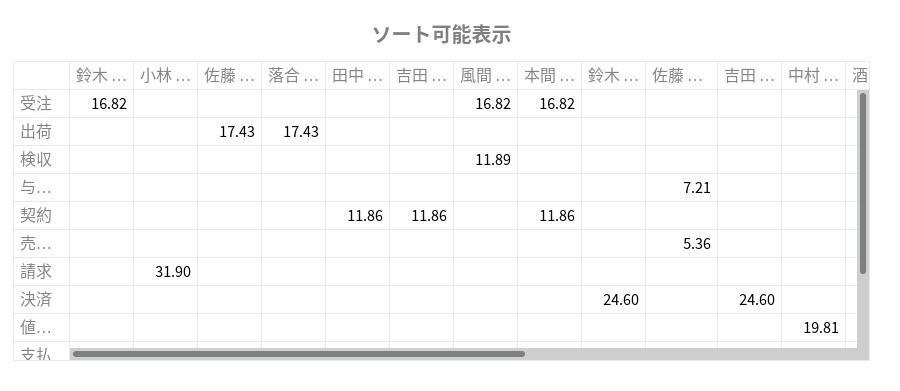
On the other hand, there is an advantage thatyou can sortby clicking the column name as shown in the image below.
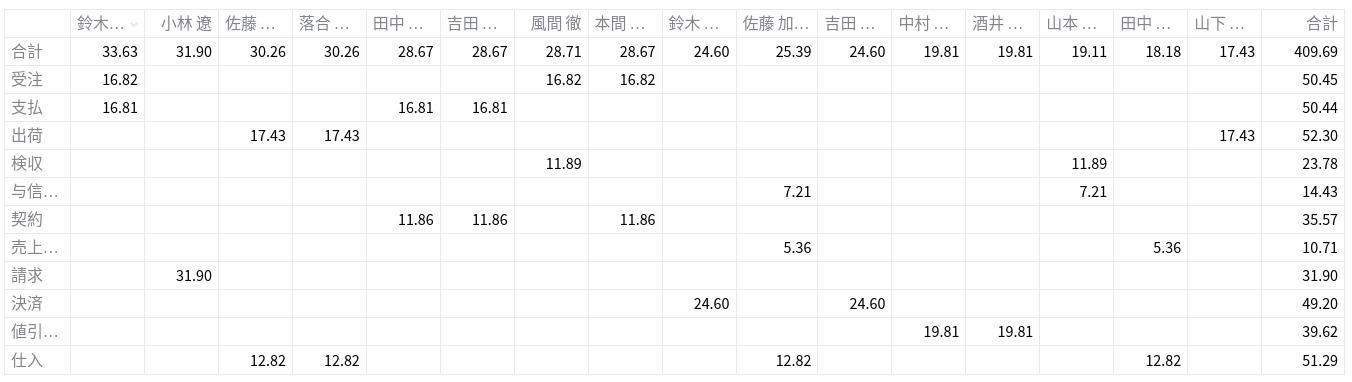
This time, I wanted to be able to see the results without omission immediately, but I thought it would be convenient to have a sort function, streamlit.table() When streamlit.dataframe() draw the same table in both I'm doing it.
When drawing tables with streamlit, you might want to try drawing the same table twice with both functions.
5. Finally
I have introduced a web application (prototype) that I developed to partially automate simple staffing through mathematical optimization.
used for optimization Number of people or working time Such It is difficult to decide all the conditions in advance with the person in charge on site Therefore, in reality, we needed a mechanism that would allow the person in charge to flexibly change the conditions on the spot and check the results.
In this prototype, a simple WebUI is provided so that site personnel can flexibly change the conditions.
In the sequel article, we plan to post an article that focuses on how to proceed with the staffing DX project and communication with the on-site staff. I look forward to reading your next article.
Kazuki Igeta
 Latest Information
 Case Study
 Blog
Blog Document List