- Semiconductor BusinessHOME
- Products and Services of Macnica,Inc.
-
technical information

-
Events and Seminars
- Handling Manufacturer
- Support
- Inquiry
- Click here to purchase products
- Semiconductor business e-mail magazine registration
![]()
![]() Narrow down by specifying conditions
Narrow down by specifying conditions
現在2183件がヒットしています。check

Debug function implementation method
Now let's talk about debugging. Table 1 shows a comparison of debug function implementation methods. This time, I mentioned the representative methods, but in reality, there are also intermediate methods. Each method is explained below.
Table 1 Comparison of major debug function implementation methods
|
method |
On-chip debugger |
hard support | ROM monitor |
OS dependent |
|
Constitution |
hard |
hardware + software |
Software (ROM) | Soft (RAM) |
|
debug target |
ROM/RAM |
RAM |
RAM |
RAM |
| Run/Stop/Abort |
○ |
○ |
○ |
○ |
|
Variable Reference/Modification |
○ |
○ |
○ |
○ |
|
real time |
○ |
× |
× |
× |
|
resource occupancy |
◎ |
○ |
× |
○ |
|
Others |
Functionality depends on hardware quantity |
RAM capacity |
On-chip debugger method
This is the method used in commercially available microcontrollers, in which all debugging functions are configured in hardware (see Figure 3). In Figures 3 to 6, purple indicates the resources required to implement the debug function, and yellow indicates the storage location of the software to be debugged. Communication with the host PC is performed through a JTAG-based serial communication path. The bus can be monitored in parallel with the CPU, and when a specific address or data occurs, CPU execution can be interrupted (called an address break/data break). It is possible to. Also, the trace function that dumps the contents of the CPU register in real time each time an instruction is executed is a feature that can only be done with this method.
However, the logic size also increases according to the support of functions, and in some cases the logic may be larger than the CPU.
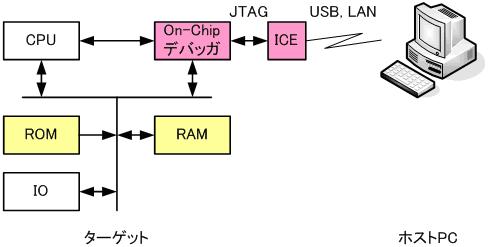
Figure 3 Configuration of On-Chip Debugger Method
Hardware support method
This method is used when you do not want the functionality up to the On-Chip Debugger, but you do want the minimum required debugging functionality (see Figure 4). As with the On-Chip Debugger, JTAG-based serial communication is performed, so dedicated resources on the board are not required. Other functions are the same as those of the ROM monitor method, which will be explained next.
Some CPU vendors provide hardware support for some of the On-Chip Debugger methods, such as address breaks at several points, but it cannot be said to be user-friendly due to many restrictions.
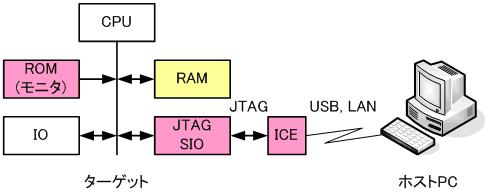
Fig. 4 Configuration of hardware support method
ROM monitor method
This is a debugging method that uses the CPU's software exception generation instruction (see Figure 5). A monitor program written in the ROM of the target starts up at startup, and communicates with the host PC via a serial interface (SIO) dedicated to debugging. The executable binary to be debugged is loaded into RAM, and execution management of the CPU is realized by replacing the instruction at the point where the execution is to be interrupted or stopped with this exception instruction. All other functions, such as referencing and changing memory and variables, are also implemented by CPU software. However, since it is a prerequisite that the debug target is on RAM, even in the case of an application that will eventually be converted to ROM, the target hardware must have a RAM capacity that considers debugging.
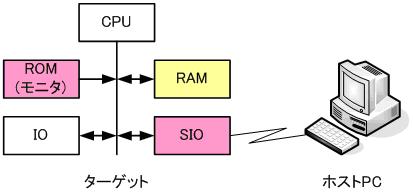
Figure 5 Configuration of ROM monitor method
OS dependent method
This is a method that uses the debug support function provided in the OS. Execution management is the same as the ROM monitor method. Unlike the previous three methods, it can also manage the state related to the OS, so it can be said that it is most suitable for debugging applications. However, since this method assumes that the OS is running, one of the three methods mentioned above is required for debugging the OS itself.
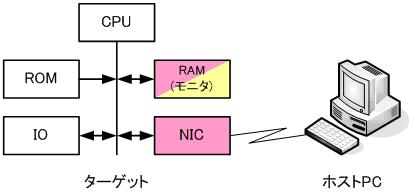
Figure 6 Configuration of OS-dependent method
This time, I tried to explain the debugging method in an easy-to-understand way, but in reality, products that combine several methods are shipped. For example, there are tools that support application debugging on the OS while using the On-Chip Debugger. Certainly, if the hardware + OS is a product that is almost fixed, it is the best way to increase the efficiency of application development. However, since this series is explained from a general point of view, it is excluded from the subject of explanation. I would appreciate it if you could supplement the surrounding information by yourself.
Nios II support
Figure 7 shows the Nios II debug function selection screen. This figure shows the screen that appears when Nios II is incorporated in SOPC Builder.
・No Debugger: ROM monitor method, OS dependent method
・Level 1, 2: Hardware support method
・Level 3, 4: On-Chip debugger method
Equivalent to
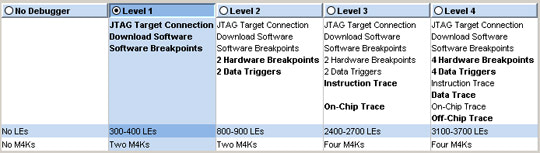
Figure 7 Nios II Debug Function Selection Screen
Also, the approximate number of LEs to be added to the second row from the bottom is displayed. It is well understood that the logical scale increases according to the function. Furthermore, Level 3 and above require the purchase of a commercial license, so the introduction of the debug function, including the scale of the device, depends on the budget.
*Level 3: Even if you do not have a license from First Sililon Solutions (FS2), you can evaluate the On-Chip Trace function of the instructions for 16 frames.
Integrated Development Environment
The tools that have been explained so far are independent and can be used independently, but especially when debugging progresses, it is often necessary to perform compilation → linking at once after correcting a part of the source due to a bug, so repeat operation easily. To do this, prepare a definition file that describes file dependencies, tool execution options, etc., and use a tool called make to manage execution. However, this make is not intuitive because it is a command line, and it was necessary to get used to writing the definition file. In addition, there were several issues in terms of operability, such as the debugger start-up procedure differing depending on the debugging function method described above.
Therefore, an integrated development environment (IDE) is designed to manage all of these together on a GUI (Graphical User Interface) basis. In the past, each vendor provided its own development, but recently we have seen many add-ons with C language debugging functions based on the open source development environment called Eclipse developed for Java. It has become
Altera's IDE is also based on this Eclipse (see Figure 8).
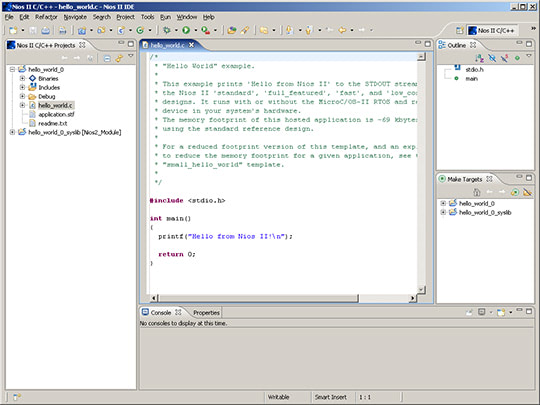
Figure 8 Screenshot of Nios II IDE
in conclusion
This time, I mainly explained the debugging function from the hardware side, but I hope you understood that there are various methods. Soft-core CPUs are designed to meet various needs, from logic to tool support, so making good use of them is the real pleasure of users.
Please experience the soft-core CPU + FPGA that "can realize a user-oriented SoC (System On Chip) from a single minimum order".
Over the next two installments, we will completely move away from hardware and focus on software, and will even explain examples of installing an OS (Operating System).