product
- Why choose Splunk
- Installation record
- price
- Splunk Enterprise Security
- Splunk Phantom (SOAR)
- Splunk ITSI (Next Generation IT Operations)
- Splunk Observability Cloud
- Splunk UBA
- Macnica CSIRT App Basic
- App for Splunk for Financial Institutions
- Splunk Analytics for Hadoop
- About Apps
- Splunk Edge Hub
- What is Splunk
service
- Dashboard/SPL Creation Pack [Implementation/Building Support]
- Version upgrade service [implementation and construction support]
- Smart Security Monitoring App [Original App/Service]
- Splunk × LANSCOPE Original App [Original App/Service]
- Security Monitoring App for Box [Original App/Service]
- Cloud Security Monitoring App [Original App/Service]
Specifications/Technical Information
Application for evaluation machine
- FAQ
Splunk
Splunk
Splunk technical blog Part 3 - Premium support case: Reducing indexer queue clogging -

Introduction
Hello, this is Macnica Splunk support.
In the third installment of the SplunkTechnology Blog - Premium Support Case Study: Reducing Indexer Queue Clogging - we will introduce how to deal with a clogged indexer queue based on actual customer inquiries.
We will start by explaining what a clogged queue is, so please feel free to use it as a reference.
*The content of this article is a case study for customers who purchased the Premium Support Utilization Support Package. For more information about this package service, please see the following: https://www.macnica.co.jp/business/security/manufacturers/splunk/premium_support.html
Customer requests
- There is a tendency for queues to become clogged in the indexer, so I would like to resolve it.
What is indexer queue blockage?
The indexer analyzes, processes, and imports data through a series of pipeline processes.
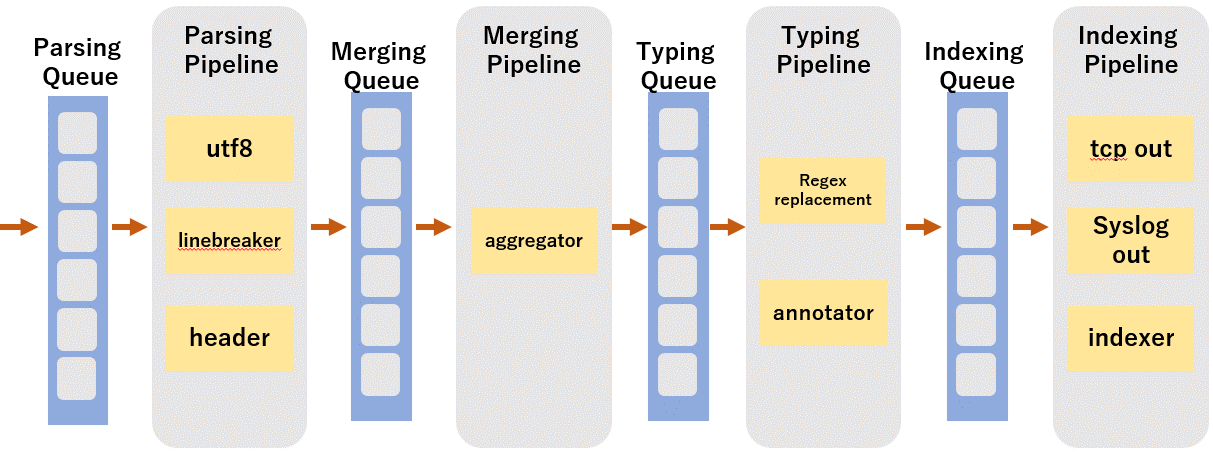
The main processing performed in each pipeline is as follows.
Parsing Pipeline: Data character code conversion and header recognition
Merging Pipeline: Convert data to events and extract timestamps
Typing Pipeline: Event processing using regular expressions
Indexing Pipeline: Writing data to index and transferring data to other destinations
A memory area is provided in front of each pipeline to store data waiting to be processed. This memory area is called a queue.
In other words, a clogged queue means that the memory area for data waiting to be processed is tight due to processing being delayed somewhere in the pipeline. If this condition continues, problems such as delays in data import processing may occur.
Therefore, the customer is requesting that the queue be unclogged, considering the possibility of delays in future data ingestion.
Flow to solution
We will investigate the cause of queue clogging in your environment and propose a solution using the following steps.
- Understand the status of your indexer
- Investigation of the cause
- Planning and proposing countermeasures
- Implementation of countermeasures
I will explain each item in turn.
① Understand the status of your indexer
Queue status is output to Splunk 's internal log, metrics.log.
You can check the queue status by using Splunk to analyze the metrics.log output to your indexer.
Upon investigation, we found that the customer's indexer queue was in the following state.
- No clogging occurs in the Indexing Queue.
- When the amount of data to be imported is large, the queues before the Typing Queue tend to become clogged.
- The amount of captured data varies over time.
Based on the above-mentioned phenomena occurring in the customer's environment, we will identify the cause of the problem and develop countermeasures.
② Investigation of the cause
1. Typing Pipeline processing is delayed
First of all, based on the customer queue situation ascertained in step 1, there was no blockage in the Indexing Queue. Since the queue before the Typing Queue is becoming clogged, it is thought that processing in the Typing Pipeline is delayed.
The main processing performed by Typing Pipeline is event processing using regular expressions. Therefore, regular expression processing may contain expressions that require a high load.
You can check which regular expression processing is putting the load on by analyzing Splunk 's internal log, metrics.log.
metrics.log records CPU usage time spent processing events, such as event splitting and regular expression processing, by host, source, source type, and index.
Regular expression processing is configured for each host, source, and source type, so it is possible to investigate which regular expressions are taking up CPU time.
After analyzing the customer's metrics.log, we found that the regular expression processing that was set for a certain source type was taking a long time to use the CPU.
2. Large amount of data to import
Based on the customer queue status ascertained in ①, we found that queue clogging does not occur chronically, but rather occurs during times when the amount of data being imported is high.
Therefore, during times when the amount of data being imported is large, the processing capacity of the indexer may not be able to keep up with the amount of data being imported.
③ Drafting and proposing countermeasures
Based on the results of the investigation in ②, we have devised two countermeasures. The first is to reduce the processing load on the indexer, and the second is to improve the indexer's processing capacity. Each is explained below.
1. Reduce the processing load on the indexer
- Regular expression processing changes
The investigation results show that regular expression processing takes a long time.
Therefore, the problem may be resolved by changing the applicable regular expression. - Reducing or smoothing the amount of data ingested
According to the investigation results, queue clogging occurs when the amount of data being imported is large. Additionally, in our customer's environment, we know that the amount of data ingested varies over time. Therefore, by reducing the amount of data to be imported or smoothing out the unevenness in the amount of data to be imported over time, it is possible to prevent the amount of data from increasing and eliminate the problem. - Introduction of heavy forwarder
In the customer's environment, the forwarder was a universal forwarder. The universal forwarder does not perform any data analysis processing, so all pipeline processing is performed by the indexer. On the other hand, heavy forwarders perform data analysis processing, so there is no need to perform analysis processing on the indexer for data imported by heavy forwarders. Therefore, by introducing a heavy forwarder, the load on the indexer may be reduced and the problem may be resolved.
2. Improve indexer processing power
- Expansion of pipeline
By improving the processing power of the indexer, pipeline processing will not be delayed and the problem may be resolved. The indexer allows you to add pipelines to increase ingest processing capacity. By default, there is one pipeline, and data ingestion processing is performed in one pipeline. By increasing the number of pipelines to two, it is possible to process data in parallel with the two pipelines, improving processing capacity.
Information on how to add pipelines is also posted in the FAQ article on our support site, so please check it out as well. - How to improve ingest processing speed by increasing the indexer pipeline
https://support.mnc.macnica.co.jp/hc/ja/articles/11058470373529
*Access is only available to our maintenance users.
We will make suggestions to the customer regarding the above measures.
At that time, we will consider possible measures from the above while asking about the specific requirements of the customer's environment.
④ Implementation of countermeasures
We proposed countermeasures for ③ to the customer, and after considering the balance with operational aspects, we decided to expand the pipeline and see how it goes.
Therefore, we will guide you through the pipeline expansion procedure, and once the countermeasure has been successfully implemented in the customer's environment and its effectiveness has been confirmed, this support will be closed.
in conclusion
Thank you for reading to the end.
What did you think. We hope that this article will be helpful to you.
As a result of this support, we were able to receive satisfactory evaluations from our customers.
At that time, they seemed to particularly value the proposal of countermeasures tailored to the customer's environment, which is unique to premium support.
We hope that you have read this article and are interested in our premium support.
Inquiry/Document request
In charge of Macnica Splunk Co., Ltd.
- TEL:045-476-2010
- E-mail:splunk-sales@macnica.co.jp
Weekdays: 9:00-17:00