Exabeam
Exabeam
Summarizing the Incident Timeline: Manual vs. Automated Processes (Part 2)

In my lastarticle, I described my attempt to manually put together an incident timeline, starting with the many questions security analysts have to ask every day when investigating an incident. Sorting out real problems from false positives is a laborious and difficult task. In this article, I'll walk you through how to build a timeline with manual research and discuss a better way to do this.
Parse the timeline
Depending on how often you log into your production environment, you can expect a user to access hundreds or even thousands of web pages each day. A single visit to a popular site like CNN.com can pull in content from various sources and generate 50, 60 or even 100 URLs. Analysts don't necessarily need to investigate every URL. A few queries are generally sufficient to draw conclusions. Focusing on the activities that humans are actually doing allows us to break down the period into smaller chunks and focus on what's important.
I ran 16 queries for Weber's listed processes and another 18 for related web activities. This is probably a conservative number. Going back to the timeline, the risky behavior appears to have happened since Weber first visited the "zoomer.cn" domain. We'll take a closer look at this time period and look at the 5 minutes before and 5 minutes after the site was accessed.
In a production environment, you'll probably see hundreds or even thousands of domains here, generating 100-200+ results per evaluation target. The most visited sites are relatively legitimate sites and tend not to pose a security risk. SOC analysts focus on URLs that require further querying, such as the unusual zoomer.cn.
さらなるクエリ
Now, we have analyzed suspicious URL access following several safe process executions. Next, consider how this URL affected your endpoint and how it might have been compromised. The first malware alert flagged the barbarian.jar file, so we will scrutinize it. When considering other suspicious activity that could indicate a security breach, we need to know which processes were running on the host. Here we can see that the endpoint security product alerted against barbarian.jar on Weber's laptop, and for some reason it was determined to be malware.
It is known that the first malware to infiltrate a host is often a "dropper". Its purpose is to bring in the following malware components: The next ingested component will attempt to burrow deep into the system and incorporate itself into the system to remain undetected. So, did your endpoint security product completely eliminate the barbarian.jar threat? Could it have been prevented? Were you able to remove it from the system? Were you able to clean up all the artifacts? Or am I missing something?
Many more queries are needed to complete the response to this incident. If your endpoint security product only partially removes the malware, you will likely have to clean the endpoint manually by accurately locating and removing the remaining components. In any case, Weber must be absolutely sure that no malware is resident on his system and cannot threaten the corporate network.
To confirm that the malware has been completely cleaned, we run additional queries to understand what the malware has done to the endpoint, as well as any other known intelligence about this threat to determine if it has been encountered. It should be checked to see if it matches what you have observed for the barbarian.jar file. This often involves interacting directly with the system looking for other evidence of its persistence, or isolating the system for a period of time and observing its behavior.
An ever-expanding survey
The question I'm trying to answer immediately here is: “Did the attack succeed? Is the attack spreading? Are the hosts still infected?” This is where the triage begins.
In our next study, we will look at the websites that Weber visited.
- what kind of site?
- What brought you to this zoomer domain?
- Did Weber Respond to Phishing Emails?
- Or is this event just a passing point?
- Did Weber visit another website that had a malicious ad that led him to the zoomer site?
- What can we learn from this incident to move forward?
The final step is root cause analysis. It is necessary to understand the infection route in detail. Beyond just looking at the websites you actually visit, what are some concrete ways you can improve your web filtering? Should I change the category of this website? What are some other ways to harden a host against similar attacks? Does the browser or the system itself have features that help strengthen its defenses?
Expanding our considerations to the scope of attacks, we need to ask questions such as: Are other users, endpoints, or other network resources affected? For example, is vssadmin.exe a normal process in this environment? In ransomware cases, shadow copies are often deleted, rendering the data unrecoverable.
Survey summary
The time required to investigate this incident with the standard "query and pivot" technique is:
Summary of results
- 96 queries (62 during demo, plus 34 to explore additional processes and URLs)
- Time required for each 12.9 minutes (average value, including human analysis time)
- 1238.4 minutes required => 20.64 hours
premise
Traditional SIEMs are reasonably tuned and have 60 days of historical data available.
Estimated time for query processing is:
- A day's worth of queries returns an answer in 2.9 minutes
- Each query for 60 days takes 47 minutes
analysis time
After each query, we added 10 minutes of analysis time to consider documenting the results, deciding next steps, and writing the next query.
Exabeam's approach
The simulation showed a traditional SIEM approach to incident investigation. In this approach, one or more analysts aggregated individual events into a timeline of related events to show what really happened in the course of the breach. Exabeam pre-builds such a timeline for every user and session on a daily basis. Additionally, Exabeam Smart Timelines contain information about deviations from normal behavior for users, their peer groups, and the organization as a whole. This is all passed through the Risk Rules, which award risk points for unusual or risky activity. This immediately points the analyst to problem areas without having to explore large amounts of raw log data.
A previously manual process can now be seen in Frederick Weber's Smart Timeline (Figure 5). Traditionally, analysts had to sift through and piece together events related to incidents, but this is now automated with the Exabeam Advanced Analytics solution.
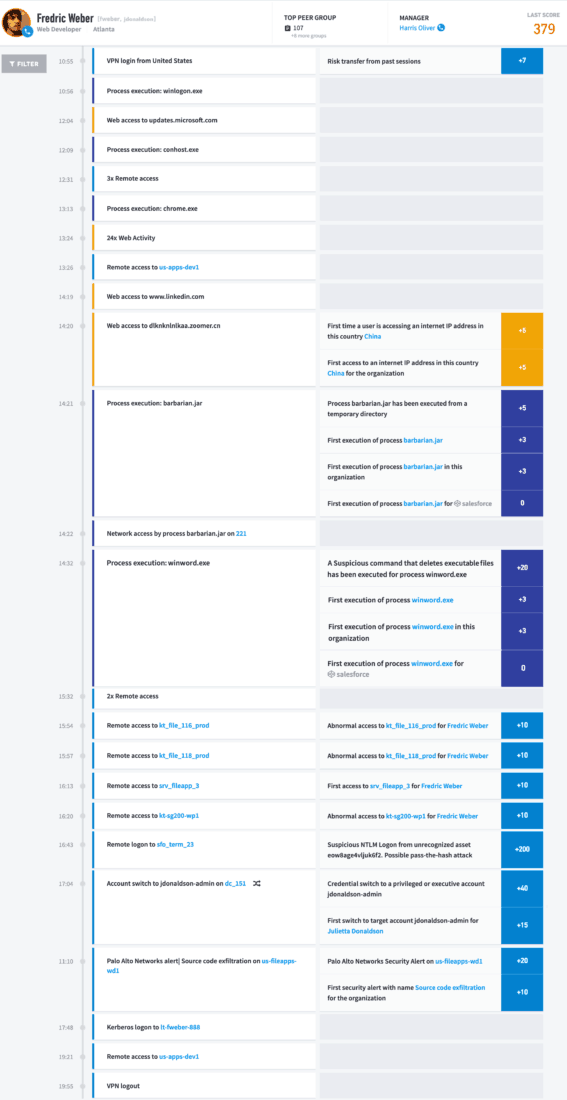
Figure 5: Frederick Weber's automated Smart Timeline. From the Exabeam Advanced Analytics Console
All recognized session activity is displayed.
Exabeam solves puzzles for analysts. Reduce analyst response times and free your team to focus on the issues that matter. Instead of spending valuable time searching through raw logs and trying to make sense of the data on your machine, you'll be able to respond to incidents.

Erik Randall
Exabeam, Inc. Sales Engineer
Inquiry/Document request
In charge of Macnica Exabeam Co., Ltd.
- TEL:045-476-2010
- E-mail:exabeam-sales@macnica.co.jp
Weekdays: 9:00-17:00