product
Application for evaluation machine
SNMP visualization of white Box switches using SONiC ~Grafana x InfluxDB edition~

Introduction
In this article, we will introduce a network visualization environment for white Box switches that utilizes Open Source Software (OSS) and visualization examples using the Grafana dashboard. Examples of visualizations on the Grafana dashboard include white Box switch traffic flow, interface status, and hardware resource information.
There are other articles related to Open Networking, so please see the articles you are interested in from the "Click here for list of articles" section below.
About the network visualization environment
In the network visualization environment introduced this time, we used Edgecore's Wedge100BF-32X as the white Box switch and the OSS version of SONiC as the network OS.
As shown in the configuration diagram below, a virtual machine (VM) is started within the server, and tools necessary for building a network visualization environment such as Grafana, InfluxDB, and Telegraf are installed on the VM.
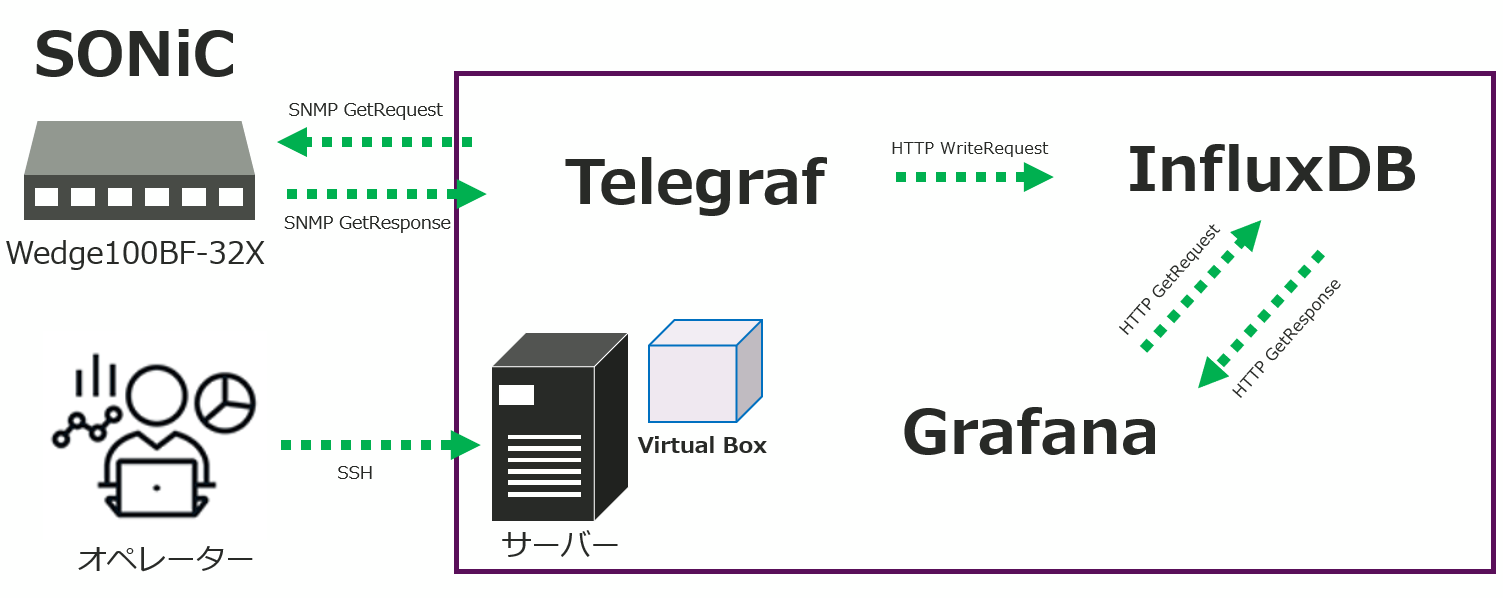
Figure 1: Visualization environment configuration diagram
The SNMP protocol is used to retrieve data from the Box switches. Specifically, an agent called Telegraf running on the VM periodically sends SNMP GetRequest operations to request data from the Box switch. The retrieved data is stored in a database called InfluxDB.
A dashboard tool called Grafana references the data stored in InfluxDB at regular intervals to visualize the data. Operators can interact with the VM's Grafana GUI via SSH to access the dashboard.
Overview of various OSS tools
We will introduce various OSS-based tools used in this network visualization environment.
Grafana
Grafana is a dashboard tool that can query data stored in a database and display data in real time in various display formats such as graphs, numbers, tables, and text. Various databases are supported, such as InfluxDB,Prometheus,MySQL, etc., and multiple data sources can be mixed in the same graph.
It is also rich in functionality, and representative ones include an alert function that notifies externally of data information when a threshold is exceeded, and a function that outputs dashboard visualization data to PDF.
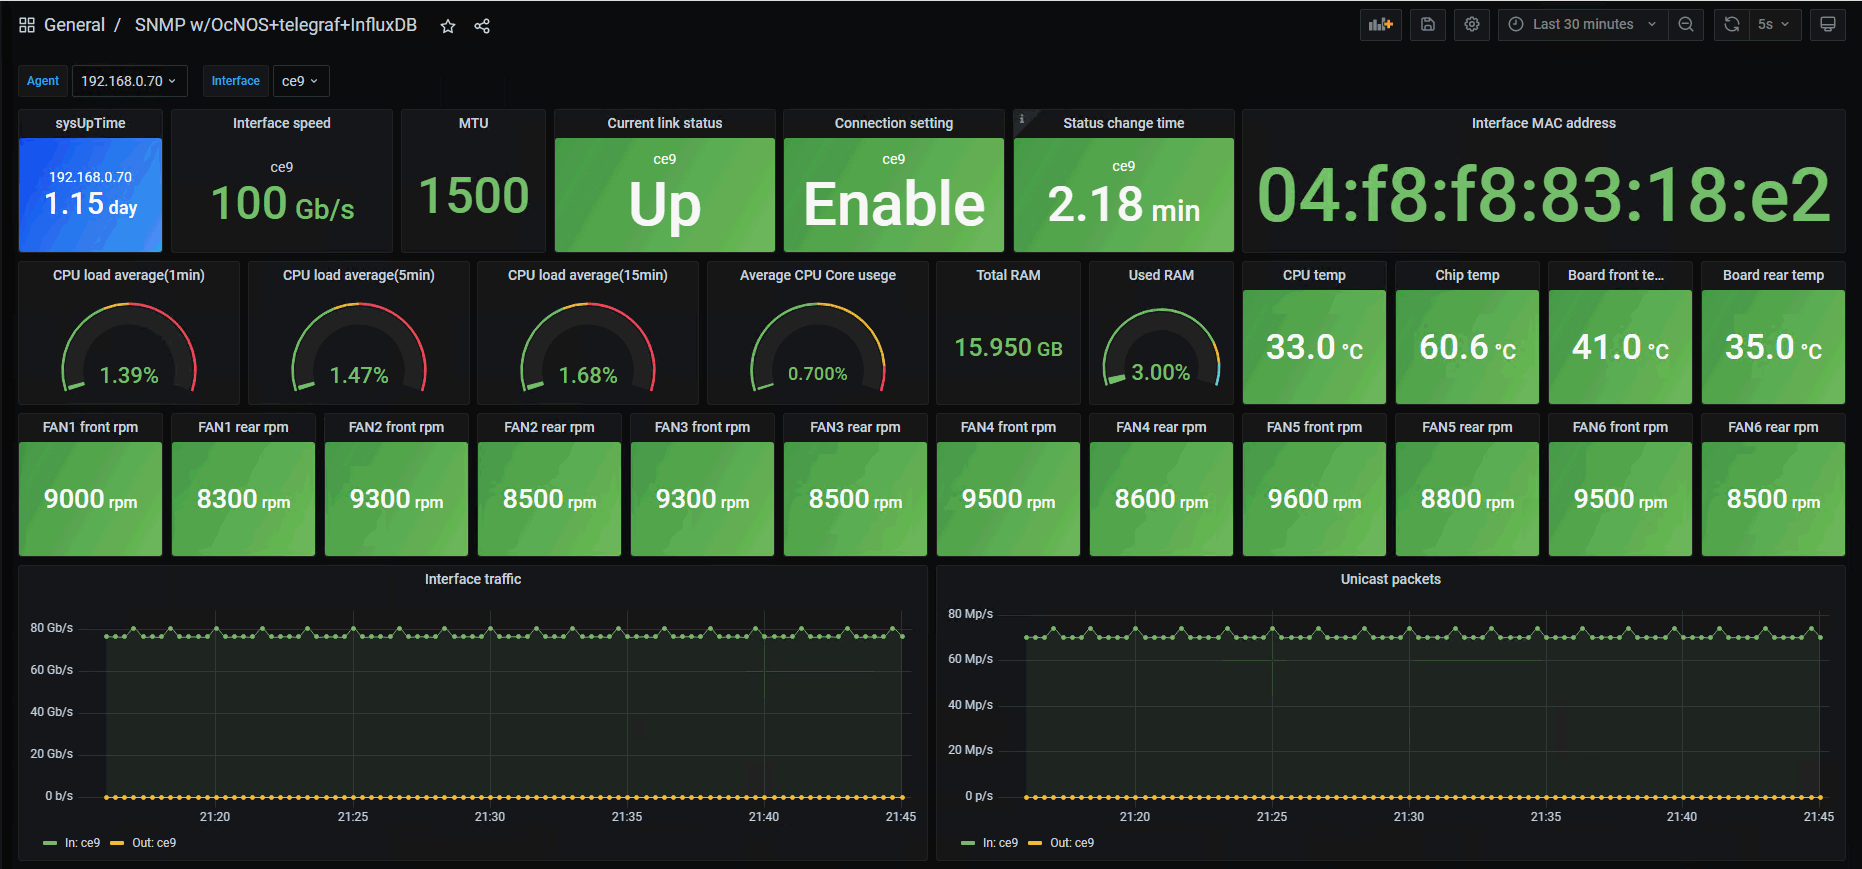
Figure 2: Grafana dashboard visualization example
Telegraph
Telegraf is an agent that periodically collects resource data of the target device and stores it in a database such as InfluxDB. It supports a wide range of protocols such as SNMP and gNMI. Since it is highly extensible, it is also possible to add original functions.
InfluxDB
InfluxDB is a time-series database that is useful when dealing with time-linked data. It is one of the representative data sources in Grafana, and the database can be controlled by command line or GUI.
Setting up the network visualization environment
We will briefly introduce the settings of SONiC and various OSS tools necessary for building a network visualization environment.
SONiC
The settings on the SONiC side are very simple as shown below.
In the configuration example, the command is executed assuming SNMPv2c, but the required settings differ depending on the version used.
admin@sonic:~$ sudo config interface ip add eth0 192.168.0.60/24 192.168.0.254 /* マネジメントポートへの IP アドレス設定 */ admin@sonic:~$ sudo config snmp community add macnica ro /* SNMP コミュニティを作成 */OSS various tools
Telegraf requires the following settings changes after installing the tool. Other tools work with the default settings.
・Enabling SNMP function
- MIB specification for SNMP monitoring
・Polling interval settings
Visualization example using Grafana dashboard
Here is an example dashboard visualization of data retrieved from a Box switch using the SNMP protocol. This time, we will mainly introduce visualization examples of traffic-related data, but all data that can be obtained with the SNMP protocol can be visualized on the Grafana dashboard.
Visualization by traffic
In this example, the following traffic data received by the interface is visualized on the dashboard.
・Total number of received traffic (IF Traffic)
・Total number of discarded traffic (IF Discards)
As mentioned above, Grafana collects data from the database at regular intervals, so the data is reflected in the dashboard in real time.
The graph below shows the communication status of the Ethernet124 interface.
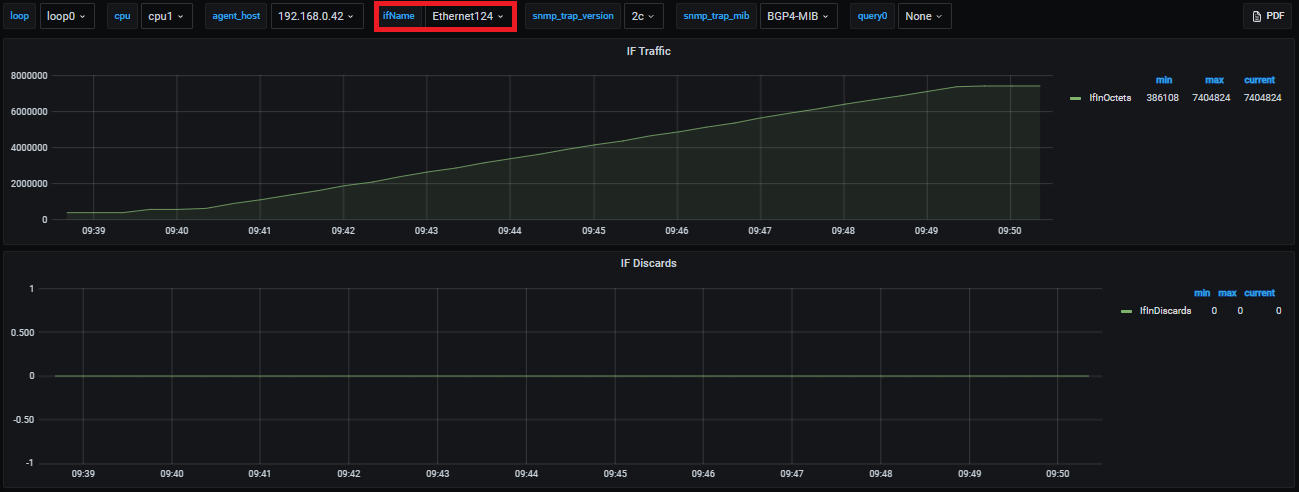
Figure 3: Ethernet124 communication status
It visualizes the 11-minute communication status received on the interface from 09:39:00 to 09:50:00, and the Y-axis shows the number of received traffic octets and the number of discards, respectively. Checking the IF Traffic graph, a certain amount of traffic was received from 09:40:00 and then continued until 09:50:00. You can see at a glance that no waste has occurred.
Variable filtering function
With Grafana, you can switch the display contents of multiple dashboards by filtering with registered variables. As an example, use the device interface name as a variable to toggle the dashboard content. Earlier I illustrated the data of the traffic received on Ethernet124, but the following is the data of the traffic received on Ethernet120.
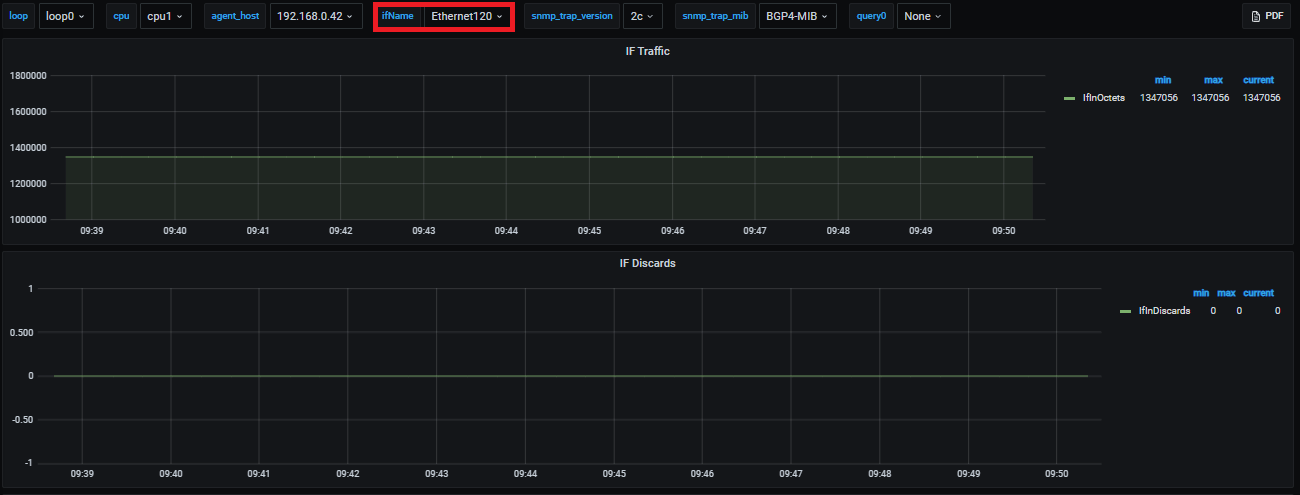
Figure 4: Ethernet120 communication status
It is a variable in which items such as loop and CPU displayed above the figure are registered, and it is possible to switch variables with a drop-down formula. The part surrounded by a red frame is the variable used for switching this time. Comparing the two diagrams, you can see that the dashboard switch was successful as the data displayed is different. If the data to be displayed in this way overlaps in units such as interfaces, it is possible to easily change the displayed data by switching variables without creating a new dashboard.
Visualization that aggregates multiple traffic
Grafana The data for multiple traffic 1 It is also possible to consolidate and visualize in one panel.
The graph below shows the TCP connection status for one day.
・Green line: Monitored machine is active (From own aircraft to other aircraft) Open a connection to
・Yellow line: Monitored aircraft is passive (From another machine to your own machine) Open a connection to
・Blue line: Connection establishment failure
・Orange line: Connection reset
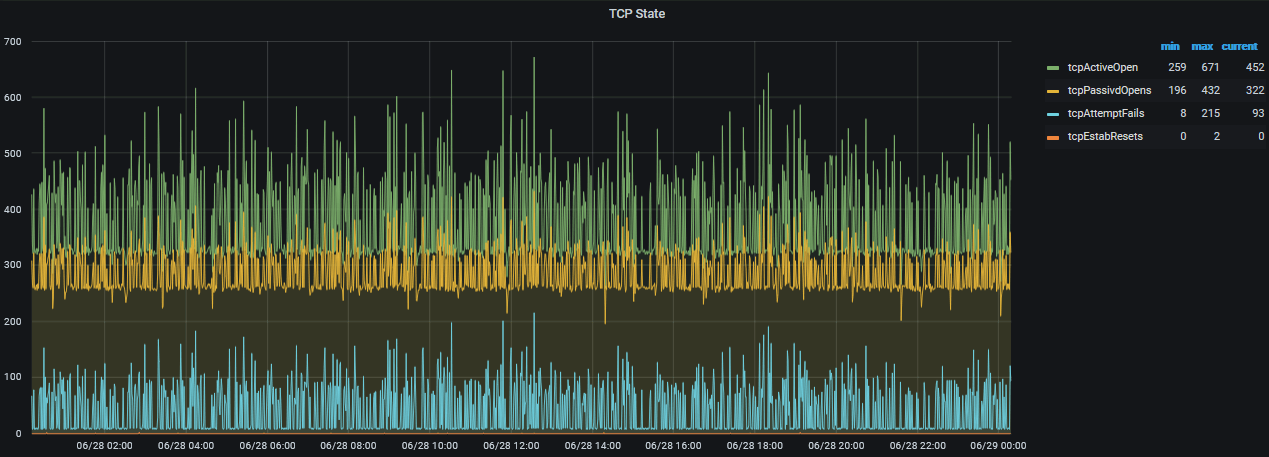
Figure 5: TCP communication status
The Y-axis represents the total amount of each TCP traffic, and if you look at the graph, you can see that the frequency of opening and failing all connections is slightly higher around 12:00. By consolidating highly related data into one panel in this way, data analysis can be performed efficiently.
This concludes the explanation of the network visualization environment for white Box switches using OSS. With ecSONiC, which was introduced in Part 5, it is possible to build an environment using the same procedure as the OSS version of SONiC. In future articles, we plan to introduce the network visualization environment combined with OcNOS provided by IP Infusion and know-how on creating a Grafana dashboard.
At the end
Macnica provides a service that remotely provides an environment where you can experience open networking and conduct tests and verifications.
This service allows you to verify the operability of network OSes and perform tests that combine network OSes from various manufacturers, white Box switches, and optical transceivers.
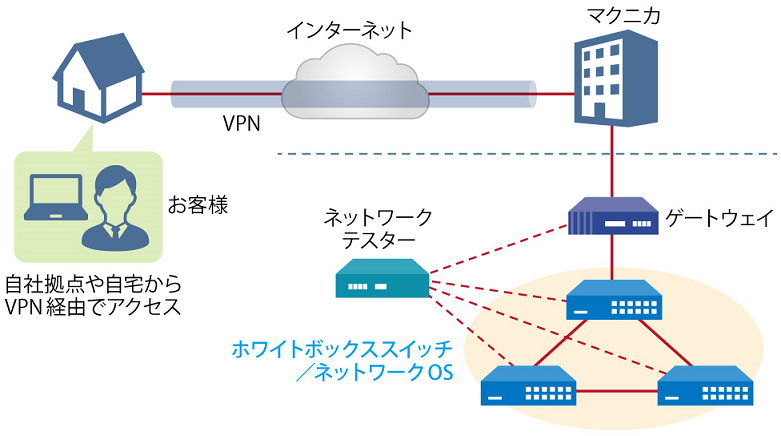
Image of remote verification service
It is a service that allows you to easily verify open networking, and the basic configuration is free of charge.
You can check the downloadable materials for available network OS and white Box switches, specific use cases, and how to apply. The materials can be downloaded from the URL listed in the information email by answering the questionnaire from the "Macnica Network OS Remote Verification Service" below.
These people are using the remote verification service.

Here are some testimonials from people who have actually used the service.
Furukawa Network Solution Co., Ltd.
“Recently, the number of remote service environments is increasing, but I was impressed with the ease of access to the evaluation equipment.
The materials you provided were easy to understand, and we were able to proceed smoothly with the intended verification. ”
Related information
![[10th] Thumbnail image of SNMP data visualization method using OSS ~Grafana x OcNOS~](/business/network/columns/2d131c51f152619d14c0af446a1ddc71_1.png)
![[11th] Thumbnail image of how to create a network visualization dashboard using Grafana for beginners](/business/network/columns/071625e009bd21fc48547707c0326d8a_1.png)
![[Part 12] Thumbnail image of network visualization of white Box switches using SolarWinds](/business/network/0b8a708630ee868e4b7084a332c4c21f.png)
Click here for list of materials
In addition to introducing products handled by Macnica,
We publish materials related to open networking, such as BGP cross network automatic construction files and network operation test evaluation reports.
Click here for details
Product Page Top
Edgecore Networks
We continue to be a pioneer in open networking by developing and selling products related to OpenNetworking/white Box switches.

Aviz Networks
We are pioneers of SONiC, an open source network operating system, providing observability, configuration automation tools and support from a team of SONiC experts.

IP Infusion
As a market leader among open networking providers, we provide reliable network solutions to over 600 customers, including carriers, service providers, and data centers.
Inquiry/Document request
In charge of Macnica Edgecore Networks
- TEL:045-470-9831
- E-mail:projectmonstar@macnica.co.jp
Weekdays: 9:00-17:00