Specifications/Technical Information
Application for evaluation machine
- FAQ
I tried implementing Prisma Cloud's CSPM Part 2: Investigating problems from visualized alerts
Last time, I wrote about registering the cloud account used by my team in Prisma Cloud and enabling the policy.
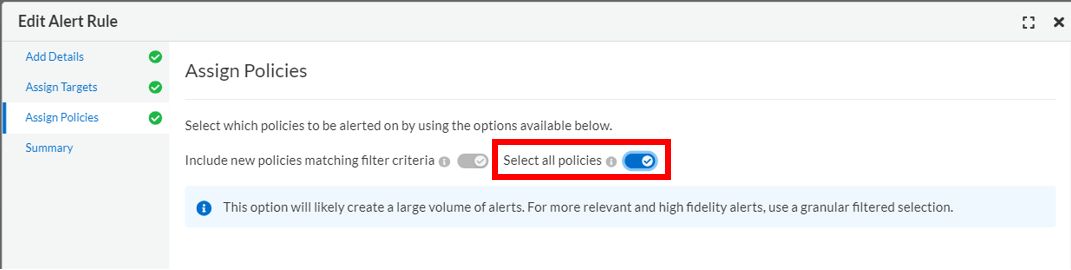
Just activating the policy does not raise it as an alert, so this time we will set an alert rule for that policy and deal with the policy violation alert.
Specifically, as a result of detecting policy violations, we will describe the investigation and countermeasures for the content displayed as violations related to Audit Event (*).
*Logs recorded in CloudTrail will be displayed as Audit Events when captured by Prisma Cloud.
We'll take a look here first.
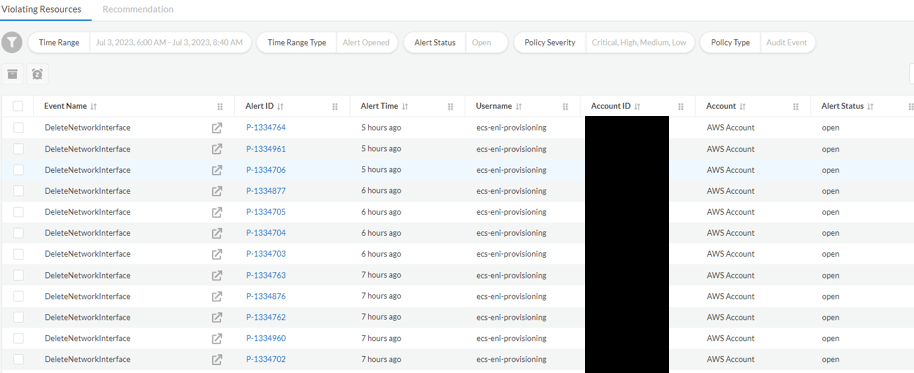
Review alerts from the last 24 hours to see how much you've had to watch recently. (Figure 2)
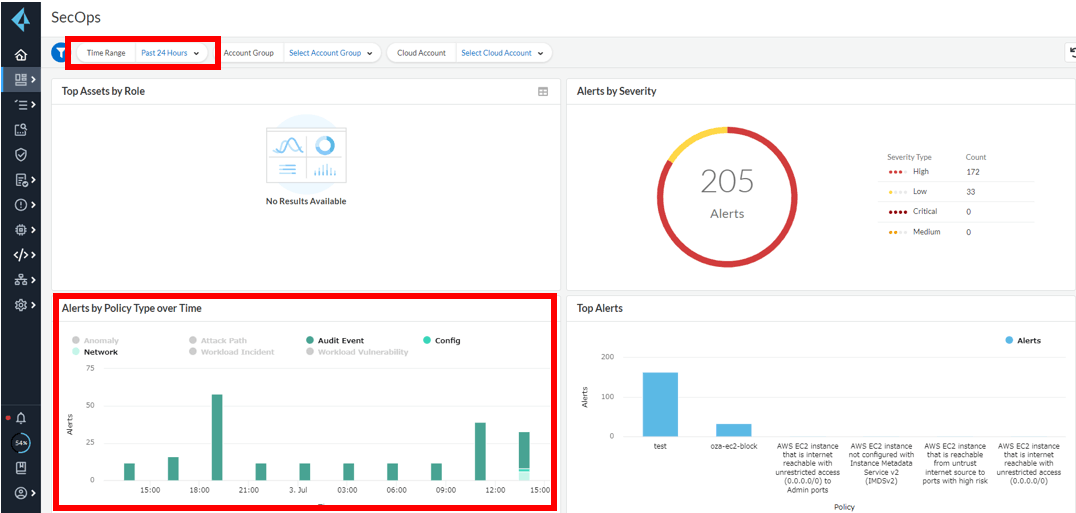
Due to the small number of people operating this cloud account, we did not expect to see so many violations.
We'll see what happened.
First of all, if you look at the lower left “Alert by Policy Type over Time” in Figure 2, the color is almost the same.
There is also a possibility that there is some kind of attack due to the large number of Audit Events.
Let's look at the events during the time when many Audit Events are occurring to see what is happening.
Let's click the bar graph from 18:00 to 21:00 in Figure 3.
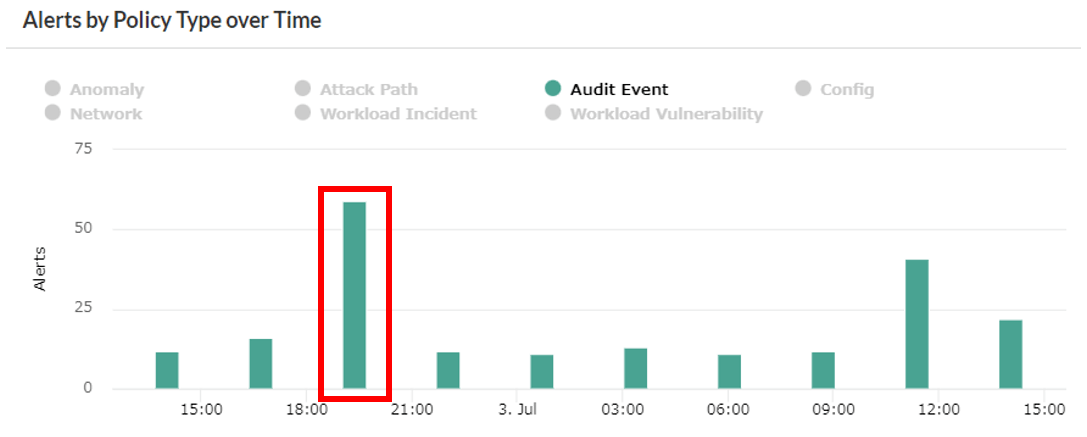
When I actually switch the region from the management screen and display ECS, there is a cluster that I do not know, and it seems that the service keeps failing to start up.
Due to this failure to start the ECS service, the network interface is automatically deleted, and ECS continues to retry to start the service, so the above behavior is occurring.
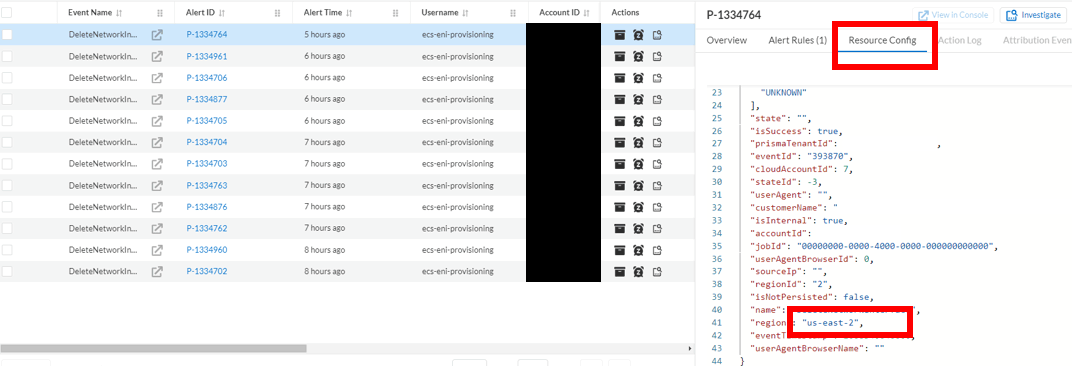
In order to deal with the Cluster where this problem occurs, let's check the Prisma Cloud log to see who created this behavior for the Service.
When you navigate to the Investigate section, a search Box appears and focusing on it will show possible entries.
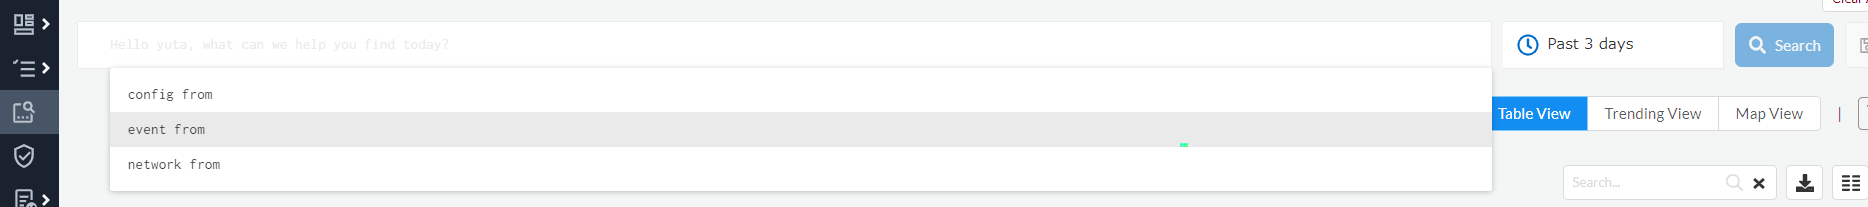
Candidates are output for values that can be entered below "event from". This time, when I searched with the following content, I was able to identify the user who most recently created a Service in us-east2.
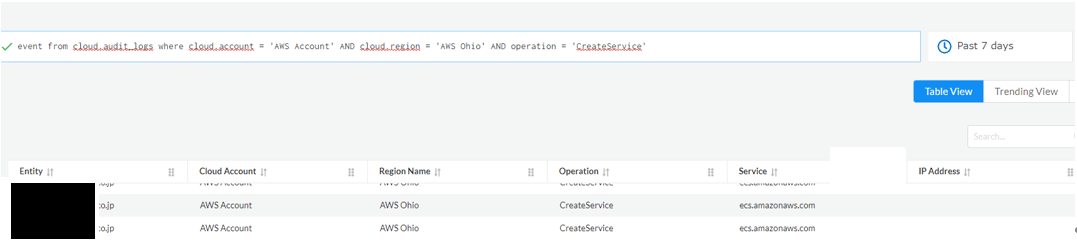
The operation may not be normal, but since the Cluster was created in a Region that was not originally intended to be used, I asked the creator to delete the entire Cluster that started this Service, and use it in an appropriate Region in the future. I requested
The creator contacted me about the deletion, and I was able to confirm that it was actually deleted, so I'd like to say that I'm relieved, but I don't like the situation where ECS and instances are being created without permission. .
After that, by extending the investigation period, further investigations such as checking the repair plan and past problem occurrence status from the Assets screen were found to be in violation of the CIS benchmark compliance from the instance created earlier. I'm taking measures, but it's getting longer, so I'm going to write it separately.
Summary
Just by registering account information in Prisma Cloud and checking it for a short period of time, we could see ECS information that was not visible before the improper setting, and found that we were not properly prepared.
As with ECS this time, stray VMs can also be a security risk, so in order to understand the operation status of resources in the entire cloud and detect suspicious behavior, we use Prisma Cloud and other CSPMs. We found that monitoring the state of the cloud by using the
Related video: "Achieving Secure Application Development -Improving Security Baselines with Posture Management-"
Providing a secure work environment for employees is a common challenge for all businesses. Suppression of security incidents is also recognized as a major issue in application development sites, but there are situations in which developers have to lower the priority of security due to unique reasons, and the importance of security is neglected. is not uncommon. In this session, we will explain Posture Management, a preventive solution for implementing the minimum mechanism necessary to reduce the probability of security incidents in the development environment and significantly improving the security baseline.
Inquiry/Document request
In charge of Macnica DevOps
- TEL:045-476-1972
- E-mail:twistlock@macnica.co.jp
Weekdays: 9:00-17:00